Evapotranspiration and Precipitation Data for Calculating Irrigation Water Requirements in Utah
Shital Poudyal and Anju Chaudhary
Introduction
Reference evapotranspiration (ETo) and precipitation data are essential for developing water budgets and calculating irrigation water requirements. However, it is crucial that the data used for such purposes are recent and easily accessible to stakeholders. In this fact sheet, we calculated average reference evapotranspiration and precipitation data for multiple locations in Utah, USA. To accomplish this, we collected the data from the Utah Climate Center and compiled it to show an average of 20 years of data by month in an easily digestible format. We compiled data for 69 locations in Utah, making it easy to find one close to your site. However, it is important to note that the data might not be accurate in every location, as some locations may have distinct microclimate. Nevertheless, stakeholders can use this data to develop a water budget and calculate irrigation water requirements for their area.
Evaporation and Transpiration

Evapotranspiration or actual evapotranspiration (ETa) is made up of two words: evaporation and transpiration. The amount of water lost through soil surface and water bodies is referred to as evaporation, whereas transpiration is the loss of water via plants' leaves, stems, and other surfaces. Several factors can influence evapotranspiration rates, including solar radiation, temperature, humidity, wind, soil moisture, topography, atmospheric pressure, and surface coverings, such as plant type, plant density, and mulch layer
While ETa is the amount of water that is actually lost for soil and plant surfaces, reference e vapotranspiration (ETo) is a standardized method of estimating the potential water loss from a well- watered, uniform cool- season grass or reference crop under specific meteorological conditions. The cool- season grass or reference crop has a uniform height and is assumed to always have sufficient water supply. ETo is a theoretical reference value that represents the maximum evapotranspiration that can occur under those idealized conditions. Therefore, ETo is often used as a standard, baseline, or reference for estimating crop water needs and scheduling irrigation. There are several methods that can be used to calculate ETo values; however, the Penman-Monteith method is most widely used. It is important to have accurate and reliable meteorological data, as generating precise ETo values depend on quality meteorological data used in the calculations.
Evapotranspiration Data in Utah
Utah is a climatically diverse state with varying geographical conditions, such as topography, altitude, and vegetation. As ETo is a function of various climatic and geographical conditions, ETo varies in different parts of the state. To understand this, let us consider the interaction between two factors: latitude (proximity to equator) and evapotranspiration. St.
George, Utah, is closer to the equator than Salt Lake City, Utah; therefore, St. George receives higher solar radiation, and thus, has a higher evapotranspiration rate.
Reference Evapotranspiration and Precipitation Data: Vital Roles in Water Management
Reference evapotranspiration (ETo) data plays a critical role in agricultural water management, as it provides essential information on crop or landscape water requirements under standardized environmental conditions. Landscapers rely on ETo data to estimate the amount of water required for crops and landscape, thus helping them manage irrigation systems and avoid over or underwatering . ETo data can be used in the landscape planning process to determine potential water savings that can be achieved by using low-water- use plants or changing landscape designs. The ETo values can also be used to:
• Develop water management plans for regions.
• Assist in forecasting areas of drought
• M anage water resources in agricultural and urban areas
• Plan landscape by budgeting the available water.
In addition to ETo, including precipitation data in calculations further increases accuracy of water budget estimation. Precipitation is any form of water that falls on earth. In Utah, rain and snow are the two most common forms of precipitation. While ETo data provides potential water loss numbers to determine the irrigation water needs, precipitation amount should be accounted and subtracted from irrigation water. In addition, if the laws allow, precipitation water can be stored and used as needed to reduce the reliance on culinary or secondary water.
Use Most Recent Data
However, as important as the ETo and precipitation data are, it is also equally important to have the most recent data because climate and other meteorological conditions change significantly over time. This is especially important as climate change is rapidly changing average temperature, precipitation, and other weather patterns that can impact ETo rates. Using decade old average ETo data may not account for these changes in weather patterns, resulting in inaccurate water budget calculations and poor accuracy in irrigation planning. In addition to climate variations, instruments used to capture those data have also come a long way and are more accurate, powerful, and reliable. Therefore, it is crucial to use the most recent data one can find.
Using Data for I rrigation Scheduling in Landscapes
Estimate irrigation requirements by applying the following formula
Gross Irrigation Requirement (GIR) (in gallons) = {(ETo – Precipitation) x PF x A } x 0.623
Net Irrigation Requirement (NIR) (in gallons) = GIR/IE
Where, ETo = Reference evapotranspiration data (in inches) are provided in Table 1.
PF = The plant factor accounts for the water requirements of specific plant types or species within the landscape. Different plants have varying water needs, and the plant factor adjusts the ETo value to reflect these differences. For example, drought- tolerant plants may have a lower PF, while high-water- use plants may have a higher PF. It ranges from 0 to 1, where 1 is high- water- use plants.
A = Area of the landscape that requires irrigation (in square feet)
IE = Irrigation efficiency reflects how effectively water is delivered to the landscape. It considers factors such as the irrigation system's design, maintenance, and management. Higher IE indicates a more efficient irrigation system, while a lower IE suggests that more water may be needed to achieve the desired result. It ranges from 0 to 1 where 1 is 100 % efficient.
Precipitation = Precipitation data (in inches) are provided Table 1.
Data Generation
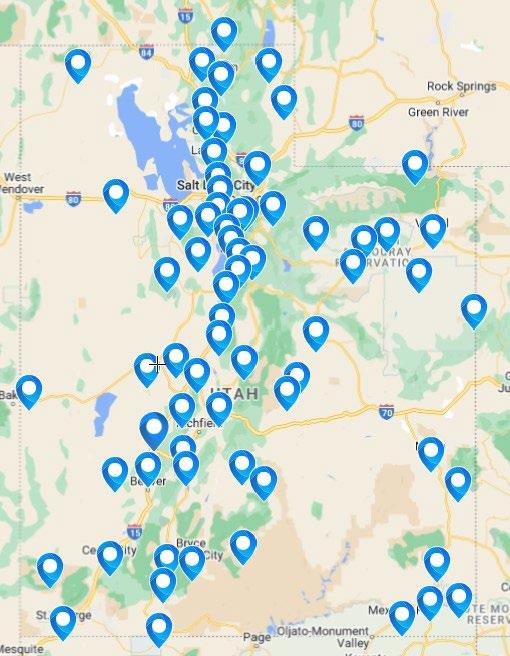
This fact sheet lists the most recent values for ETo and precipitation at different locations in Utah. To do so, we downloaded the reference evapotranspiration and precipitation data from the Utah Climate Center’s MapServer (https://climate.usu.edu/mapServer/mapGUI/index.php) website. We downloaded the data from the years 2000 to 2022, organized it by months, and averaged it for 22 years, aiming to cover all counties of Utah. Figure 1 shows locations included in this fact sheet. However, for some locations, we couldn’t find data for all 22 years, and in that case, we just included the data that was available. Some stations also had missing precipitation data and, in that case, we used the precipitation data from a nearby station Those limitations are also highlighted in Table 1
Limitations
Although this fact sheet has ETo and precipitation data for multiple Utah locations, and we advise choosing the station closest to your site, we also know it is important to understand that there are limitations to these data. Local weather and meteorological conditions can influence site- specific evapotranspiration rates, which can be challenging to capture accurately due to spatial and temporal variability. As such, it is important to consider the limitations of evapotranspiration data and contextualize it with additional information when making decisions or drawing conclusions.
Figure 1. The Spread of Stations Selected to Include ETo and Precipitation Data
Table 1. Tables for Average M onthly and Annual Reference Evapotranspiration (ETo) and Precipitation (ppt) Data for V arious Utah Locations
Altamont, UT *Missing ETo data from 2000–2001
Aragonite, UT * Used nearby station for ppt data, Mining Fork, UT
Hatch 10 SW, UT *Used nearby station for ppt data, Harris Flat, UT
Alta, UT Average (2000–2022) Jan Feb Mar Apr May Jun Jul Aug Sep Oct Nov Dec Annual Total ETo (inches) 0.61 0.71 1.44 2.19 3.40 4.79 5.59 4.65 3.14 1.69 0.85 0.51 29.84 Total ppt (inches) 5.69 5.53 5.52 5.44 3.29 1.84 1.53 2.24 2.63 3.46 4.24 6.17 47.14 Alpine, UT Average (2000–2022) Jan Feb Mar Apr May Jun Jul Aug Sep Oct Nov Dec Annual Total ETo (inches) 0.86 1.27 2.63 3.79 5.56 7.10 7.93 6.73 4.65 2.63 1.31 0.76 45.41 Total ppt (inches) 2.05 1.90 2.01 2.47 2.21 0.76 0.60 1.07 1.37 1.81 1.53 2.42 19.92
Average (2000–2022) Jan Feb Mar Apr May Jun Jul Aug Sep Oct Nov Dec Annual Total ETo (inches) 0.64 1.02 2.36 3.59 5.17 6.63 7.34 6.18 4.31 2.43 1.20 0.58 41.43 Total ppt (inches) 0.54 0.48 0.50 0.70 0.90 0.61 0.55 0.99 1.11 0.94 0.44 0.90 8.50 Alton, UT Average (2000–2022) Jan Feb Mar Apr May Jun Jul Aug Sep Oct Nov Dec Annual Total ETo (inches) 1.14 1.42 2.72 4.13 5.82 7.42 7.60 6.53 4.81 2.97 1.62 1.00 47.19 Total ppt (inches) 1.67 1.75 1.42 0.77 0.65 0.25 1.44 2.09 1.63 1.99 1.08 1.81 15.99
Average (2000–2022) Jan Feb Mar Apr May Jun Jul Aug Sep Oct Nov Dec Annual Total ETo (inches) 0.86 1.25 2.51 3.67 5.36 6.90 7.84 6.66 4.49 2.58 1.25 0.75 44.13 Total ppt (inches) 3.85 3.60 3.88 4.05 3.44 1.43 1.02 1.45 1.88 3.23 3.05 4.22 35.10
Average (2000–2022) Jan Feb Mar Apr May Jun Jul Aug Sep Oct Nov Dec Annual Total ETo (inches) 1.10 1.30 2.38 3.46 5.03 6.43 6.84 5.92 4.32 2.67 1.47 0.94 41.86 Total ppt (inches) 2.13 2.31 1.70 0.89 0.70 0.36 1.87 2.09 1.67 1.99 1.59 2.76 20.05
Assay-
Beaver Canyon PWR House, UT *2022 data is missing
Average (2000–2021) Jan Feb Mar Apr May Jun Jul Aug Sep Oct Nov Dec Annual Total ETo (inches) 1.03 1.28 2.38 3.40 5.11 6.63 7.00 6.13 4.32 2.60 1.39 0.90 42.56 Total ppt (inches) 1.42 1.68 1.86 1.79 1.65 0.62 1.97 1.60 0.89 1.50 0.93 1.51 17.71 Black Rock, UT Average (2000–2022) Jan Feb Mar Apr May Jun Jul Aug Sep Oct Nov Dec Annual Total ETo (inches) 1.07 1.61 3.32 4.79 6.67 8.29 9.00 7.69 5.43 3.23 1.64 0.96 53.47 Total ppt (inches) 0.58 0.72 0.89 0.94 0.74 0.36 0.58 0.74 0.64 0.97 0.51 0.82 8.34 Blanding, UT Average (2000–2022) Jan Feb Mar Apr May Jun Jul Aug Sep Oct Nov Dec Annual Total ETo (inches) 1.09 1.50 2.93 4.22 6.01 7.46 7.79 6.62 4.66 2.93 1.56 0.95 47.78 Total ppt (inches) 1.40 1.23 0.96 0.55 0.61 0.32 0.98 1.20 1.31 1.27 0.77 1.35 12.10 Bluff, UT Average (2000–2022) Jan Feb Mar Apr May Jun Jul Aug Sep Oct Nov Dec Annual Total ETo (inches) 1.26 1.90 3.67 5.33 7.22 8.76 8.87 7.58 5.54 3.46 1.86 1.11 56.41 Total ppt (inches) 0.75 0.60 0.48 0.26 0.39 0.27 0.66 0.94 0.90 0.78 0.42 0.68 7.20 Bountiful Bench, UT Average (2000–2022) Jan Feb Mar Apr May Jun Jul Aug Sep Oct Nov Dec Annual Total ETo (inches) 0.79 1.15 2.37 3.46 4.99 6.27 7.04 5.92 4.04 2.36 1.17 0.70 40.26 Total ppt (inches) 2.49 2.35 3.13 3.58 2.63 1.14 0.60 1.26 1.53 2.18 2.34 2.84 26.16 Brigham City West PLT, UT Average (2000–2022) Jan Feb Mar Apr May Jun Jul Aug Sep Oct Nov Dec Annual Total ETo (inches) 0.74 1.16 2.56 3.82 5.55 7.08 8.25 7.03 4.75 2.70 1.25 0.67 45.72 Total ppt (inches) 1.42 1.18 1.38 1.61 1.76 0.83 0.15 0.72 1.36 1.53 1.13 1.37 14.37
Brighton, UT *Missing ETo data from 2018-2020
Average (2000–2022) Jan Feb Mar Apr May Jun Jul Aug Sep Oct Nov Dec Annual Total ETo (inches) 0.73 0.91 1.75 2.56 3.77 4.98 5.68 4.72 3.23 1.83 0.94 0.60 31.70 Total ppt (inches) 4.31 3.60 3.36 3.66 2.44 1.25 0.98 1.80 2.12 3.10 3.45 4.57 35.93 Bryce Canyon AP, UT
ETo
of 2000 Average (2000–2022) Jan Feb Mar Apr May Jun Jul Aug Sep Oct Nov Dec Annual Total ETo (inches) 0.86 1.11 2.29 3.57 5.28 6.87 7.29 6.26 4.51 2.71 1.41 0.76 42.93 Total ppt (inches) 0.60 0.64 0.70 0.59 0.61 0.32 1.54 1.42 1.49 1.36 0.68 0.71 10.65 Capitol Reef NP, UT Average (2000–2022) Jan Feb Mar Apr May Jun Jul Aug Sep Oct Nov Dec Annual Total ETo (inches) 1.05 1.53 2.93 4.29 5.92 7.35 7.64 6.52 4.68 2.80 1.45 0.89 47.06 Total ppt (inches) 0.42 0.52 0.53 0.40 0.57 0.31 1.24 1.06 0.98 0.95 0.49 0.31 7.72 Castle Dale, UT Average (2000–2022) Jan Feb Mar Apr May Jun Jul Aug Sep Oct Nov Dec Annual Total ETo (inches) 1.02 1.54 3.15 4.55 6.30 7.83 8.48 7.28 5.28 3.19 1.62 0.90 51.00 Total ppt (inches) 0.55 0.58 0.50 0.42 0.54 0.39 0.52 0.82 0.93 1.05 0.31 0.45 7.09 Cedar City MUNI AP, UT Average (2000–2022) Jan Feb Mar Apr May Jun Jul Aug Sep Oct Nov Dec Annual Total ETo (inches) 1.16 1.57 3.02 4.30 6.17 7.78 8.24 7.11 5.20 3.18 1.71 1.02 50.36 Total ppt (inches) 0.71 0.94 1.23 1.02 0.86 0.36 1.19 0.93 0.71 1.15 0.77 1.02 11.12 Chalk Creek #2, UT *Missing ETo
2017–2020 Average (2000–2022) Jan Feb Mar Apr May Jun Jul Aug Sep Oct Nov Dec Annual Total ETo (inches) 0.67 0.88 1.84 2.85 4.21 5.37 6.01 4.97 3.24 1.86 0.90 0.56 33.37 Total ppt (inches) 2.27 2.03 2.35 2.77 2.30 1.34 0.82 1.58 1.90 2.23 2.20 2.51 24.92
*Missing
data
data from
City Creek WTP, UT *Missing ETo data from 2000–2001
UT *Missing ETo data of 2000,
Average (2000–2022) Jan Feb Mar Apr May Jun Jul Aug Sep Oct Nov Dec Annual Total ETo (inches) 0.84 1.20 2.48 3.66 5.47 6.95 7.92 6.78 4.70 2.67 1.29 0.71 44.58 Total ppt (inches) 2.30 2.17 3.07 3.47 2.78 1.13 0.52 0.88 1.60 2.22 2.21 2.65 25.00 Clayton Springs,
and 2019 Average (2000–2022) Jan Feb Mar Apr May Jun Jul Aug Sep Oct Nov Dec Annual Total ETo (inches) 0.86 1.08 2.02 2.78 4.08 5.41 5.74 4.84 3.45 2.08 1.12 0.72 34.17 Total ppt (inches) 1.98 2.16 2.10 1.90 1.21 0.53 2.40 2.49 1.86 2.37 1.56 2.33 24.02 Cottonwood Weir, UT Average (2000–2022) Jan Feb Mar Apr May Jun Jul Aug Sep Oct Nov Dec Annual Total ETo (inches) 0.82 1.24 2.54 3.76 5.26 6.65 7.39 6.27 4.32 2.55 1.23 0.73 42.47 Total ppt (inches) 1.78 1.92 2.60 2.91 2.25 1.18 0.38 0.88 1.55 2.04 1.49 2.10 20.69 Cutler Dam, UT Average (2000–2022) Jan Feb Mar Apr May Jun Jul Aug Sep Oct Nov Dec Annual Total ETo (inches) 0.61 0.97 2.28 3.63 5.22 6.68 7.94 6.75 4.56 2.53 1.14 0.59 42.65 Total ppt (inches) 1.71 1.38 1.37 1.79 1.86 0.76 0.40 0.73 1.25 1.74 1.27 1.61 16.22 Deseret, UT Average (2000–2022) Jan Feb Mar Apr May Jun Jul Aug Sep Oct Nov Dec Annual Total ETo (inches) 0.95 1.51 3.18 4.63 6.57 8.23 9.07 7.75 5.40 3.12 1.55 0.84 52.78 Total ppt (inches) 0.65 0.58 0.86 0.88 0.85 0.36 0.32 0.50 0.66 0.97 0.48 0.76 7.86 Duchesne, UT Average (2000–2022) Jan Feb Mar Apr May Jun Jul Aug Sep Oct Nov Dec Annual Total ETo (inches) 0.71 1.19 2.74 4.07 5.73 7.19 7.70 6.49 4.54 2.63 1.30 0.64 44.47 Total ppt (inches) 0.47 0.49 0.61 0.71 0.87 0.53 0.70 1.09 1.13 0.94 0.44 0.65 9.00
2018,
Liberty, UT *Missing ETo and ppt data from 2000–2010 and missing ETo data from 2014–2016
Utah, UT *Missing ETo data from 2000–2002; *Used nearby station for ppt data, Little Grassy, UT
Echo Dam, UT Average (2000–2022) Jan Feb Mar Apr May Jun Jul Aug Sep Oct Nov Dec Annual Total ETo (inches) 0.73 1.13 2.52 3.83 5.60 7.31 8.35 7.13 4.92 2.82 1.27 0.65 46.21 Total ppt (inches) 1.14 0.89 1.26 1.46 1.66 0.96 0.63 1.01 1.21 1.43 1.13 1.29 14.09 Eden-
Average (2011–2022) Jan Feb Mar Apr May Jun Jul Aug Sep Oct Nov Dec Annual Total ETo (inches) 0.66 0.98 2.25 3.37 4.95 6.79 7.86 6.83 4.72 2.55 1.24 0.63 43.23 Total ppt (inches) 2.64 1.81 1.78 1.92 2.03 0.76 0.46 0.53 1.18 1.58 2.07 1.98 18.49 Enterprise
Average (2000–2022) Jan Feb Mar Apr May Jun Jul Aug Sep Oct Nov Dec Annual Total ETo (inches) 1.20 1.59 3.03 4.29 6.09 7.72 8.26 7.23 5.31 3.26 1.74 1.03 50.71 Total ppt (inches) 2.47 2.45 1.55 1.14 0.49 0.16 1.40 1.85 1.25 1.80 1.33 3.03 19.58 Ephraim, UT Average (2000–2022) Jan Feb Mar Apr May Jun Jul Aug Sep Oct Nov Dec Annual Total ETo (inches) 0.80 1.25 2.75 4.10 5.96 7.70 8.67 7.33 5.20 3.05 1.50 0.77 48.91 Total ppt (inches) 0.71 0.80 1.01 0.87 0.87 0.55 0.52 0.72 0.87 1.03 0.68 1.17 9.86 Escalante, UT Average (2000–2022) Jan Feb Mar Apr May Jun Jul Aug Sep Oct Nov Dec Annual Total ETo (inches) 1.25 1.73 3.31 4.78 6.69 8.29 8.69 7.51 5.47 3.36 1.80 1.10 53.90 Total ppt (inches) 0.89 0.75 0.72 0.36 0.51 0.40 1.27 1.49 1.17 1.43 0.54 0.71 10.26 Eskdale, UT Average (2000–2022) Jan Feb Mar Apr May Jun Jul Aug Sep Oct Nov Dec Annual Total ETo (inches) 1.06 1.54 3.15 4.53 6.34 7.90 8.61 7.50 5.31 3.18 1.60 0.95 51.89 Total ppt (inches) 0.41 0.38 0.58 0.71 0.62 0.29 0.47 0.57 0.46 0.59 0.36 0.41 5.80
Fairfield, UT *Missing ETo data from 2010–2011 Average
UT *Missing ETo data from 2000–2013; *Used nearby station for ppt data, Rock
Hobble Creek, UT *Missing ETo and ppt data from 2000–2011
Hollow- Cove Fort 5W, UT *Used nearby station for ppt data, Kimberly Mine, UT Average
(2000–2022) Jan Feb Mar Apr May Jun Jul Aug Sep Oct Nov Dec Annual Total ETo (inches) 0.85 1.25 2.79 4.13 6.06 7.39 8.37 7.23 4.94 2.96 1.43 0.81 48.08 Total ppt (inches) 0.76 0.89 0.81 0.71 0.59 0.43 0.51 0.58 0.55 0.73 0.42 0.87 9.64 Ferron, UT Average (2000–2022) Jan Feb Mar Apr May Jun Jul Aug Sep Oct Nov Dec Annual Total ETo (inches) 0.92 1.35 2.76 4.14 5.75 7.34 7.85 6.64 4.78 2.89 1.46 0.82 46.99 Total ppt (inches) 0.55 0.57 0.56 0.41 0.67 0.43 0.74 0.73 0.90 1.06 0.34 0.52 7.75 Fremont Indian SP, UT Average (2000–2022) Jan Feb Mar Apr May Jun Jul Aug Sep Oct Nov Dec Annual Total ETo (inches) 1.12 1.48 2.91 4.12 6.01 7.46 8.32 7.16 5.21 3.11 1.64 0.97 49.69 Total ppt (inches) 0.69 0.91 0.93 1.12 0.97 0.49 1.34 1.35 0.92 1.18 0.77 0.92 11.82 Hanna,
Creek,
Average (2000–2022) Jan Feb Mar Apr May Jun Jul Aug Sep Oct Nov Dec Annual Total ETo (inches) 0.84 1.08 2.22 3.29 4.64 6.21 6.94 6.06 4.09 2.51 1.21 0.65 39.74 Total ppt (inches) 1.67 1.38 1.04 1.23 1.28 0.96 1.49 1.70 2.02 2.08 1.15 1.93 18.37
UT
Average (2012–2022) Jan Feb Mar Apr May Jun Jul Aug Sep Oct Nov Dec Annual Total ETo (inches) 0.88 1.12 2.21 3.17 4.58 5.94 6.80 5.89 3.94 2.26 1.19 0.70 38.83 Total ppt (inches) 3.14 2.52 1.95 1.65 1.48 0.43 0.81 1.46 1.88 1.38 2.18 3.35 23.21
(2000–2022) Jan Feb Mar Apr May Jun Jul Aug Sep Oct Nov Dec Annual Total ETo (inches) 1.05 1.35 2.58 3.74 5.46 6.96 7.57 6.53 4.63 2.73 1.41 0.91 44.92 Total ppt (inches) 2.57 3.05 3.23 3.13 1.80 0.71 1.91 1.99 1.97 2.48 2.36 3.25 29.49
Horse
Levan, UT *Missing ETo data from 2008-
Little Sahara REC AREA, UT *Missing ETo data from 200–2009
Kamas, UT Average (2000–2022) Jan Feb Mar Apr May Jun Jul Aug Sep Oct Nov Dec Annual Total ETo (inches) 0.82 1.12 2.37 3.61 5.46 6.88 8.09 6.86 4.60 2.62 1.25 0.70 44.01 Total ppt (inches) 1.42 1.12 1.30 1.12 1.25 0.74 0.86 1.17 1.59 1.57 1.22 0.87 14.57 Kanab, UT Average (2000–2022) Jan Feb Mar Apr May Jun Jul Aug Sep Oct Nov Dec Annual Total ETo (inches) 1.49 1.95 3.55 5.03 6.85 8.41 8.57 7.41 5.55 3.56 2.00 1.27 55.66 Total ppt (inches) 1.24 1.49 1.08 0.73 0.46 0.18 1.21 1.49 1.16 1.51 0.90 1.58 12.81 La Sal 1SW, UT Average (2000–2022) Jan Feb Mar Apr May Jun Jul Aug Sep Oct Nov Dec Annual Total ETo (inches) 0.90 1.20 2.51 3.78 5.37 7.10 7.47 6.25 4.23 2.62 1.38 0.81 44.33 Total ppt (inches) 0.73 0.73 0.97 0.88 0.75 0.57 1.26 1.40 1.47 1.29 0.84 0.97 11.82 Laketown, UT Average (2000–2022) Jan Feb Mar Apr May Jun Jul Aug Sep Oct Nov Dec Annual Total ETo (inches) 0.59 0.81 1.89 3.22 4.72 6.20 7.08 5.99 4.05 2.24 1.02 0.55 38.44 Total ppt (inches) 1.29 1.20 1.13 1.49 1.96 0.70 0.46 0.95 1.05 1.27 1.30 1.29 14.15
(2000–2022) Jan Feb Mar Apr May Jun Jul Aug Sep Oct Nov Dec Annual Total ETo (inches) 0.89 1.31 2.75 4.06 5.87 7.36 8.12 7.04 4.91 2.92 1.47 0.80 47.17 Total ppt (inches) 0.93 1.02 1.38 1.33 1.23 0.54 0.63 0.60 0.99 1.24 0.94 1.40 12.65
2009 Average
(2000–2022) Jan Feb Mar Apr May Jun Jul Aug Sep Oct Nov Dec Annual Total ETo (inches) 0.89 1.30 2.76 4.09 5.93 7.59 8.45 7.25 5.04 2.83 1.38 0.75 48.47 Total ppt (inches) 1.30 0.77 0.98 1.07 0.98 0.26 0.47 0.52 0.73 0.88 0.43 0.75 9.75
Average
Logan 5 SW EXP FARM, UT
Manila, UT *Missing ETo data from 2000–2007
Marysvale, UT *Missing ETo data from 2011–2018
Mexican Hat, UT *Missing ETo and ppt data from 2020–2022
MUNI AP, UT
Average (2000–2022) Jan Feb Mar Apr May Jun Jul Aug Sep Oct Nov Dec Annual Total ETo (inches) 0.62 0.99 2.27 3.60 5.21 6.80 8.04 6.93 4.60 2.62 1.18 0.60 43.27 Total ppt (inches) 1.63 1.47 1.74 1.89 1.96 0.90 0.32 0.85 1.41 1.64 1.30 1.75 16.37
Average (2000–2022) Jan Feb Mar Apr May Jun Jul Aug Sep Oct Nov Dec Annual Total ETo (inches) 0.78 1.00 2.20 3.32 4.69 5.96 7.03 5.89 4.07 2.34 1.21 0.64 40.17 Total ppt (inches) 0.25 0.32 0.65 0.71 1.21 0.84 0.90 0.92 0.91 0.76 0.22 0.29 7.64
Average (2000–2022) Jan Feb Mar Apr May Jun Jul Aug Sep Oct Nov Dec Annual Total ETo (inches) 1.08 1.52 2.94 4.35 6.20 7.68 8.31 7.19 5.18 3.11 1.62 0.99 50.81 Total ppt (inches) 0.41 0.49 0.42 0.36 0.44 0.25 0.91 0.82 0.57 0.83 0.46 0.61 6.80 McCook Ridge, UT *Used nearby station for ppt data, East Willow Creek, UT Average (2000–2022) Jan Feb Mar Apr May Jun Jul Aug Sep Oct Nov Dec Annual Total ETo (inches) 0.91 1.24 2.46 3.63 5.37 6.92 7.50 6.30 4.40 2.58 1.30 0.78 43.29 Total ppt (inches) 1.57 1.48 1.37 1.23 1.01 0.73 1.61 1.76 2.03 1.69 1.28 2.04 18.49
Average (2000–2019) Jan Feb Mar Apr May Jun Jul Aug Sep Oct Nov Dec Annual Total ETo (inches) 1.36 1.94 3.72 5.23 7.19 8.89 8.83 7.57 5.72 3.68 1.95 1.20 57.29 Total ppt (inches) 0.73 0.73 0.36 0.19 0.33 0.23 0.57 0.75 0.89 0.67 0.40 0.50 6.32 Milford
Average (2000–2022) Jan Feb Mar Apr May Jun Jul Aug Sep Oct Nov Dec Annual Total ETo (inches) 1.03 1.50 2.94 4.39 6.38 8.06 8.78 7.36 5.26 3.16 1.62 0.92 52.03 Total ppt (inches) 0.57 0.60 0.91 0.78 0.71 0.30 0.86 0.67 0.60 1.18 0.57 0.80 8.53
Moab, UT Average (2000–2022) Jan Feb Mar Apr May Jun Jul Aug Sep Oct Nov Dec Annual Total ETo (inches) 1.16 1.80 3.55 5.10 7.16 8.50 9.03 7.78 5.72 3.51 1.80 1.06 56.28 Total ppt (inches) 0.57 0.64 0.73 0.72 0.70 0.36 0.91 0.93 0.90 1.06 0.62 0.89 9.04 Neola, UT Average (2000–2022) Jan Feb Mar Apr May Jun Jul Aug Sep Oct Nov Dec Annual Total ETo (inches) 0.65 1.07 2.50 3.80 5.34 6.68 7.24 6.21 4.42 2.50 1.20 0.60 42.46 Total ppt (inches) 0.54 0.54 0.58 0.70 0.73 0.58 0.52 0.88 1.30 1.16 0.52 0.75 8.88 Nephi, UT Average (2000–2022) Jan Feb Mar Apr May Jun Jul Aug Sep Oct Nov Dec Annual Total ETo (inches) 0.88 1.30 2.72 3.95 5.61 7.05 7.86 6.76 4.75 2.77 1.40 0.78 45.57 Total ppt (inches) 1.12 1.09 1.37 1.44 1.36 0.60 0.46 0.68 0.90 1.25 1.03 1.37 12.84 Oak City, UT Average (2000–2022) Jan Feb Mar Apr May Jun Jul Aug Sep Oct Nov Dec Annual Total ETo (inches) 0.91 1.34 2.76 4.02 5.81 7.37 8.03 6.96 4.83 2.83 1.40 0.83 47.08 Total ppt (inches) 1.14 1.10 1.84 1.52 1.29 0.43 0.43 0.59 0.80 1.42 0.92 1.66 13.25 Ogden, UT, Hinkley AP Average (2000–2022) Jan Feb Mar Apr May Jun Jul Aug Sep Oct Nov Dec Annual Total ETo (inches) 0.75 1.15 2.49 3.64 5.34 6.90 7.93 6.65 4.49 2.53 1.22 0.69 43.78 Total ppt (inches) 1.35 1.25 1.58 1.85 1.92 0.80 0.30 0.80 1.13 1.59 1.20 1.44 15.21 Ouray 4 NE, UT Average (2000–2022) Jan Feb Mar Apr May Jun Jul Aug Sep Oct Nov Dec Annual Total ETo (inches) 0.55 1.16 2.99 4.58 6.57 8.26 8.97 7.64 5.28 3.02 1.38 0.59 50.92 Total ppt (inches) 0.31 0.32 0.61 0.58 0.75 0.38 0.45 0.51 1.06 0.92 0.39 0.39 6.62
Pleasant Grove, UT Average (2000–2022) Jan Feb Mar Apr May Jun Jul Aug Sep Oct Nov Dec Annual Total ETo (inches) 0.90 1.36 2.80 4.02 5.81 7.20 8.16 6.99 4.92 2.82 1.35 0.81 46.92 Total ppt (inches) 1.28 1.35 1.47 1.79 1.84 0.60 0.41 0.80 0.85 1.35 0.95 1.24 15.58 Price Carbon CO AP, UT Average (2000–2022) Jan Feb Mar Apr May Jun Jul Aug Sep Oct Nov Dec Annual Total ETo (inches) 0.84 1.24 2.67 4.08 5.84 7.42 8.06 6.77 4.74 2.68 1.34 0.74 46.31 Total ppt (inches) 0.60 0.57 0.62 0.50 0.60 0.58 0.48 0.82 1.08 1.00 0.41 0.72 8.15 Provo BYU, UT Average (2000–2022) Jan Feb Mar Apr May Jun Jul Aug Sep Oct Nov Dec Annual Total ETo (inches) 0.94 1.44 2.93 4.30 6.13 7.84 8.72 7.35 5.14 2.97 1.45 0.86 50.05 Total ppt (inches) 1.57 1.41 1.45 1.79 1.67 0.63 0.42 0.78 1.20 1.54 1.25 2.01 15.71 Richmond, UT Average (2000–2022) Jan Feb Mar Apr May Jun Jul Aug Sep Oct Nov Dec Annual Total ETo (inches) 0.61 0.97 2.31 3.69 5.42 7.07 8.30 7.05 4.72 2.58 1.13 0.60 44.67 Total ppt (inches) 1.83 1.74 1.99 2.36 2.26 0.90 0.40 0.85 1.59 1.82 1.44 1.80 19.30 Rosette, UT Average (2000–2022) Jan Feb Mar Apr May Jun Jul Aug Sep Oct Nov Dec Annual Total ETo (inches) 0.71 1.03 2.16 3.21 4.75 6.00 7.09 6.13 4.27 2.39 1.09 0.60 39.94 Total ppt (inches) 1.07 0.82 0.72 1.00 1.35 0.64 0.65 0.75 1.09 0.88 0.63 1.19 11.28 Salina 24 E, UT Average (2000–2022) Jan Feb Mar Apr May Jun Jul Aug Sep Oct Nov Dec Annual Total ETo (inches) 0.73 0.94 1.98 3.03 4.50 6.14 6.66 5.61 3.99 2.26 1.08 0.65 36.89 Total ppt (inches) 0.91 0.92 1.07 0.80 1.06 0.66 1.35 1.37 1.19 1.47 0.67 1.16 12.46
Santaquin Chlorinator, UT Average (2000–2022) Jan Feb Mar Apr May Jun Jul Aug Sep Oct Nov Dec Annual Total ETo (inches) 0.89 1.30 2.59 3.78 5.53 7.04 7.91 6.84 4.73 2.77 1.35 0.80 45.65 Total ppt (inches) 1.66 1.48 1.95 1.94 1.44 0.67 0.43 0.87 1.11 1.79 1.42 1.95 17.42 Scipio, UT Average (2000–2022) Jan Feb Mar Apr May Jun Jul Aug Sep Oct Nov Dec Annual Total ETo (inches) 0.92 1.33 2.82 4.13 6.03 7.65 8.11 7.10 5.06 2.98 1.49 0.81 48.62 Total ppt (inches) 1.15 1.09 1.37 1.22 1.16 0.51 0.61 0.91 1.02 1.25 0.97 1.65 12.76 Sevier Reservoir- Scipio 9NNE, UT *Used nearby station for ppt data, Scipio, UT Average (2000–2022) Jan Feb Mar Apr May Jun Jul Aug Sep Oct Nov Dec Annual Total ETo (inches) 1.01 1.44 2.83 4.05 5.86 7.48 8.30 7.13 5.10 3.00 1.53 0.88 48.45 Total ppt (inches) 1.15 1.09 1.37 1.22 1.16 0.51 0.61 0.91 1.02 1.25 0.97 1.65 12.76 Spanish Fork PWR HOUSE, UT Average (2000–2022) Jan Feb Mar Apr May Jun Jul Aug Sep Oct Nov Dec Annual Total ETo (inches) 0.87 1.35 2.85 4.22 5.99 7.58 8.45 7.21 4.99 2.87 1.36 0.76 48.48 Total ppt (inches) 1.82 1.75 2.11 2.25 1.74 0.80 0.52 0.89 1.43 1.81 1.50 2.26 18.98 St. George, UT Average (2000–2022) Jan Feb Mar Apr May Jun Jul Aug Sep Oct Nov Dec Annual Total ETo (inches) 1.60 2.20 3.92 5.23 7.06 8.47 8.69 7.72 5.83 3.82 2.13 1.37 59.68 Total ppt (inches) 0.73 1.14 0.76 0.60 0.26 0.07 0.56 0.63 0.38 0.65 0.49 0.91 7.78 Tooele, UT Average (2000–2022) Jan Feb Mar Apr May Jun Jul Aug Sep Oct Nov Dec Annual Total ETo (inches) 0.91 1.33 2.68 3.93 5.60 7.07 8.04 6.87 4.71 2.70 1.33 0.79 45.93 Total ppt (inches) 1.28 1.43 2.14 2.26 2.10 0.87 0.79 0.76 1.02 1.39 1.28 1.71 17.02
Conclusion
The data on ETo and precipitation in Utah highlights the substantial variation in water requirements for landscapes across the state. ETo can range from as low as 30s to as high as 50s, with a corresponding significant difference in water needs. For instance, a 10,000 square foot landscape would demand approximately 150,000 gallons of water annually with a lower ETo of 30, and 250,000 gallons with a higher ETo of 50. This example assumes consistent plant types and excludes precipitation, thus emphasizing the critical role that location and climate play in determining irrigation needs. Including precipitation data further enhances precision water budgeting. This fact sheet provides valuable insights for Utah residents interested in accurately estimating and budgeting for landscape water requirements to promote responsible and efficient water management practices throughout the state.
References
Nouri, H., Beecham, S., Hassanli, A. M., & Kazemi, F. (2013). Water requirements of urban landscape plants: A comparison of three factor- based approaches. Ecological Engineering, 57, 276–284. https://doi.org/10.1016/j.ecoleng.2013.04.025
Pereira, L. S., Alves, I., & Paredes, P. (2023). Crop and landscape water requirements. In Encyclopedia of soils in the environment (pp. 571–592). Elsevier. https://doi.org/10.1016/B978-0-12-822974-3.00044-6
Texas A&M School of Irrigation. Landscape water budgeting. Texas A&M Ag riLife Extension Service. Retrieved September 12, 2023, from https://irrigation.tamu.edu/files/2018/06/Landscape-Water- Budgeting -manual-8-614.pdf
Utah Climate Center. (n.d.). Utah State University. Accessed September 12, 2023, at https://climate.usu.edu/
Vernal, UT Average (2000–2022) Jan Feb Mar Apr May Jun Jul Aug Sep Oct Nov Dec Annual Total ETo (inches) 0.60 1.07 2.55 4.01 5.53 7.15 7.70 6.67 4.45 2.57 1.22 0.58 44.13 Total ppt (inches) 0.62 0.52 0.77 0.71 0.99 0.53 0.53 0.70 1.26 1.12 0.49 0.63 8.81 Vernon-10 N Utah, UT *Used nearby station for ppt data, Vernon Creek, UT Average (2000–2022) Jan Feb Mar Apr May Jun Jul Aug Sep Oct Nov Dec Annual Total ETo (inches) 1.01 1.33 2.61 3.86 5.78 7.53 8.57 7.32 5.00 2.89 1.46 0.87 48.37 Total ppt (inches) 2.78 2.79 2.73 2.25 1.95 0.70 0.69 1.09 1.26 2.37 2.09 3.23 23.93 Woodruff, UT Average (2000–2022) Jan Feb Mar Apr May Jun Jul Aug Sep Oct Nov Dec Annual Total ETo (inches) 0.50 0.76 2.04 3.53 5.21 6.66 7.79 6.66 4.50 2.48 1.09 0.49 41.71 Total ppt (inches) 0.45 0.48 0.58 0.73 1.26 0.73 0.52 0.91 1.13 1.06 0.62 0.53 8.99
Vanderkimpen, P J. (1991). Estimation of crop evapotranspiration by means of the Penman-Monteith Equation (3842)
[Doctoral dissertation, Utah State University]. All Graduate Theses and Dissertations, Spring 1920 to Summer 2023. https://digitalcommons.usu.edu/etd/3842.
In its programs and activities, including in admissions and employment, Utah State University does not discriminate or tolerate discrimination, including harassment, based on race, color, religion, sex, national origin, age, genetic information, sexual orientation, gender identity or expression, disability, status as a protected veteran, or any other status protected by University policy, Title IX, or any other federal, state, or local law. Utah State U niversity is an equal opportunity employer and does not discriminate or tolerate discrimination including harassment in employment including in hiring, promotion, transfer, or termination based on race, color, religion, sex, national origin, age, genetic information, sexual orientation, gender identity or expression, disability, status as a protected veteran, or any other status protected by University policy or any other federal, state, or local law. Utah State University does not discriminate in its housing offerings and will treat all persons fairly and equally without regard to race, color, religion, sex, familial status, disability, national origin, source of income, sexual orientation, or gender identity. Additionally, the University endeavors to provide reasonable accommodations when necessary and to ensure equal access to qualified persons with disabilities. The following office has been designated to handle inquiries regarding the application of Title IX and its implementing regulations and/or USU’s non-discrimination policies: The Office of Equity in Distance Education, Room 400, Logan, Utah, titleix@usu.edu, 435-797-1266. For further information regarding non-discrimination, please visit equity.usu.edu, or contact: U.S. Department of Education, Office of Assistant Secretary for Civil Rights, 800-421-3481, ocr@ed.gov or U.S. Department of Education, Denver Regional Office, 303-844-5695 ocr.denver@ed.gov. Issued in furtherance of Cooperative Extension work, acts of May 8 and June 30, 1914, in cooperation with the U.S. Department of Agriculture, Kenneth L. White, Vice President for Extension and Agriculture, Utah State University.
September 15, 2023
Utah State University Extension
Peer-Reviewed Fact Sheet
