Transportation Group


Include all metro and bus stops in Metro Atlanta Table of XY coordinates via Atlanta Regional Commission Used ArcGIS Pro to determine population center of each tract Determined number of stops within 0.5 mi of each tract center
Median household income Via US Census Bureau


Median age Via US Census Bureau
Percent of people who have graduated from high school Via US Census Bureau
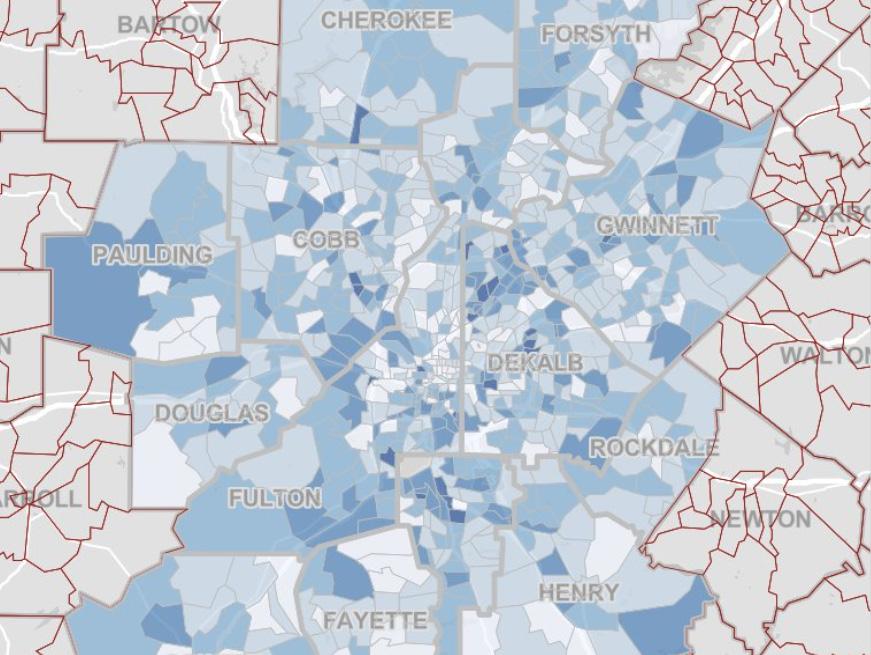
Percent of people who used public transit to commute to work Via Atlanta Regional Commission
Population used public transit to commute to work Via Atlanta Regional Commission
Percent of people used public transit to commute to work Via Atlanta Regional Commission
Dependent variable in red, independent variable in blue

4488.5
R-Square: 0.593
AdjustedR-Square: 0.589

This table shows the results of regression analyses of two models for PercentTransitCommute (percentage of commute using public transport). The first model (Raw) incorporates the linear form of the variable, while the second model (Final) introduces non-linear terms (e.g., quadratic terms) for the variable. Below is an interpretation of the key results:
MedianAge (median age) had a significant positive correlation on public transport use in both models (p<0.05) and the effect increased in the Final model (from 0.105 to 0.176).
MedianIncome (median income) has a significant negative correlation with PercentTransitCommute (p<0.01). This trend is more pronounced in the Final model (coefficient decreases from -0.00005 to -0.0002).
NumAccessibleStops (number of accessible bus stops) has a significant positive effect on commuter public transport use (p<0.01), which is significantly higher in the Final model, increasing from 0.173 to 0.272.
PopNearTransit (number of residents close to transit) has a significant negative effect on commuter transit use (p<0.01). However, the coefficient decreases slightly in the Final model (from -0.001 to -0.0003).
The role of non-linear terms: The Final model introduces squared terms for variables such as I(MedianIncome^2) and I(NumAccessibleStops^2). These non-linear terms significantly enhance the fit of the model. For example, Adjusted R-square improved from 0.458 to 0.589.
Model Improvement: The overall explanatory power of the Final model is stronger (R-square increased from 0.462 to 0.593), while the AIC value decreased, indicating an improved model fit.