
Adopted June 12, 2025
EASTSIDE
Pensacola, Florida


ACKNOWLEDGMENTS
LEAD
Pensacola Community Redevelopment Agency
LEAD CONSULTANT
Urban Design Associates (UDA)
COMMUNITY ENGAGEMENT CONSULTANT
MonWin Consulting
TRANSPORTATION CONSULTANT HDR
MARKET CONSULTANT JLP+D
MAYOR
D.C. Reeves
Mayor of Pensacola
CRA BOARD MEMBERS
Teniade Broughton
City Council District 5
CRA Chairperson for 2025
Delarian Wiggins
City Council District 7
CRA Vice-Chairperson for 2025
Charles Bare
City Council District 2
Jennifer Brahier
City Council District 1
Casey Jones
City Council District 3
Jared Moore
City Council District 4
Allison Patton
City Council District 6
CITY ADMINISTRATION
Tim Kinsella
City Administrator
Amy Miller Deputy City Administrator
CRA STAFF
Erica Grancagnolo
Economic Development Director
Victoria D’Angelo
CRA Division Manager
Hilary Halford
Assistant CRA Division Manager
Shirley Baylis
CRA Program Manager
Rachel Benett
CRA Urban Design Planner
Tiffany Whiting-Cardenas
CRA Executive Assistant
EASTSIDE REDEVELOPMENT BOARD
Zachary Lane Chairperson
Aretta Anderson Vice-Chairperson
Jennifer Brahier City Council & Board Member
Tommy White Board Member
WESTSIDE REDEVELOPMENT BOARD
James Gulley Chairperson
Karl Schwelm Vice-Chairperson
Doug Baldwin Sr. Board Member
Jennifer Brahier City Council & Board Member
Lamar Brown Board Member
C. Marcel Davis Board Member
Michelle Press Board Member
URBAN CORE REDEVELOPMENT BOARD
Christopher Satterwhite Chairperson
Jared Moore City Council & Board Member
Melanie Nichols Board Member
Kelly Wieczorek Board Member

The recommendations in the Eastside CRA Plan were developed between May 2024 and January 2025. The analyses are based on point-in-time data sources, and the recommendations align with the regulations and funding programs effective during the period when the plan was developed.
This CRA Plan explores recommendations for a 20-year timeframe. Recommendations that may not be feasible in the short term due to market, funding, or policy conditions are still valid for the long-term vision and may take longer to implement.
EXECUTIVE SUMMARY
This Community Redevelopment Agency (CRA) Plan Update is intended to provide direction for policies, programs, and projects in the Eastside CRA District in the City of Pensacola, Florida. The process of listening to residents and stakeholders informed an ideal vision for Pensacola's Eastside CRA District. The recommendations outlined in this document are intended to establish a foundation of guiding principles, projects, and decision-making frameworks to achieve the community's visions for the future.
The role of the CRA is to lead decision-making efforts related to redevelopment within its jurisdiction and to utilize increment revenues to undertake and complete redevelopment projects authorized by Part III, Chapter 163, Florida Statutes. TIF is a funding mechanism authorized under Chapter 163, Part III, Florida Statutes which capture incremental growth in the tax base within the CRA district to be reinvested in strategic projects within the district. Key community redevelopment goals include:
• Preserving, rehabilitating, and enhancing the community redevelopment area neighborhoods to maximize livability and quality of life;
• Fostering a diverse supply of housing options, especially affordable and workforce housing; and
• Creating a robust and stable economy that offers employment, culture, and entertainment and is filled with people and businesses.
More specifically, this CRA Plan Update is intended to target the following topics and issues within the Eastside CRA District:
• Expanding housing options, especially affordable, workforce housing;
• Preserving traditional character and history and culture;
• Tempering gentrification and/or displacement;
• Building socioeconomic equity;
• Strengthening neighborhood identity;
• Fostering economic development and sustainability;
• Improving walkability, bikeability, transit and parking management; and
• Connecting people to the waterfront and neighborhood assets.
Residents and stakeholders led the way throughout the creation of this CRA Plan Update. From 2024 through 2025, members of the CRA District community were invited to establish the overall vision for the future and provide input on preliminary recommendations. Paired with an exhaustive analysis of existing and projected conditions of demographics, economics, physical urban patterns, and transportation systems, the needs of each CRA District and the paths forward were revealed.


Chappie James Museum of Pensacola
Crystal Ice House

This CRA Plan Update builds on past plans and represents potential investments to realize the vision of Eastside residents and stakeholders. The recommendations in this plan are organized into the following topics:
• Land Use, Zoning, and Special Districts
• Economic Development
• Neighborhood Development
• Housing
• Transportation, Streets, and Parking
• Open Space and Community Amenities
A series of Special Demonstration Projects illustrate the potential impact of targeted investments, identifying opportunities to solve issues raised by the community and uncovered through the analysis of the CRA Districts. Strategies for implementing these recommended policies, programs, and projects are provided, along with recommendations about prioritizing potential projects.
CRA Districts Map
INTRODUCTION


ACTIVITIES
In addition to specific special demonstration projects, recommendations and visions identified in the Plan, the CRA will be empowered to provide and may fund certain activities to further carry out the themes and principles of the Plan. Leveraging the private sector to the maximum extent and close coordination, cooperation and communication with other public and semi-public agencies is critical for the CRA to be most efficient with its redevelopment efforts.
In accordance with the limitations set forth in §163.387, Florida Statutes, the CRA may help directly stimulate and support private investment in new real estate development, property improvements, new business and infrastructure and may choose to offer financial incentives to fill the economic gap and stimulate redevelopment.
Property Acquisition
To help further the purposes of the Plan, the CRA may acquire property either for current or future redevelopment opportunities. The acquisition of property necessary to carry out the themes and principles of the Plan may be authorized by the CRA and City Council on a site-by-site basis or pursuant to established program policies and guidelines.
The CRA may also pay for related costs, including but not limited to, transaction costs, site clearance, demolition (with Council approval), and repairs.
Business Relocation1
The CRA may assist existing businesses within the Redevelopment Area to relocate in order to make way for redevelopment activities consistent with The Plan.
Environmental Improvements
Properties within the Redevelopment Area are known or are perceived to contain environmental contamination. The CRA is empowered to provide funding to cover costs associated with environmental cleanup in support of the redevelopment of such properties with approval by the CRA on a site-by-site basis or pursuant to established program policies and guidelines.
Prepare Sites For Redevelopment
The CRA may prepare or cause to be prepared as building and development sites, any property in the Redevelopment Area owned or acquired by the CRA, the City or any other person, in order to redevelop the site in accordance with the Plan. Such site preparation may include, but is not limited to demolition, building rehabilitation, building relocation, infrastructure, utilities, environmental cleanup and grading. Demolition may be pre-authorized by the CRA and City Council either on a site-by-site basis or pursuant to established program policies and guidelines.
1 Note: Limitation on assisting non-displaced businesses to relocate into the CRA, per AGO 2009-32. See 163.387(6)(c)(4); 163.370(2)(k), F.S..
Market Research And Site Due Diligence
The CRA may fund planning, surveys, and financial analysis efforts in order to assess market conditions and feasibility for redevelopment of the Redevelopment Area or for specific projects.
Property Disposition
The CRA is authorized to sell, lease, exchange, subdivide, transfer, assign, pledge, encumber by mortgage or deed of trust, or otherwise dispose of any interest in real property. To the extent permitted by law, the CRA is authorized, with the approval of City Council, to dispose of real property by negotiated sale, lease, or donation.
The leases, deeds, contracts, agreements, declarations of restrictions and other legal instruments relative to any real property interest conveyed by the CRA may contain restrictions, covenants, covenants running with the land, conditions subsequent, equitable servitudes, or such other provisions necessary to carry out the Plan and meet the objectives of the CRA.
The CRA also may pay for costs associated with the disposition of property, including but not limited advertisement for disposition, the solicitation process, and transaction costs.
Building Demolition, Rehabilitation, Reuse and Relocation Demolition
The CRA may demolish, clear, or move buildings, structures and other improvements from any real property in the Redevelopment Area which it has acquired and as may be necessary to carry out the purpose of the Plan with the approval of City Council either on a site-by-site basis or pursuant to established program policies and guidelines.
Building Rehabilitation And Reuse2
The CRA may rehabilitate, redevelop and/or improve property for reuse. The CRA may work with the owner(s) and/or tenants through a joint venture to redevelop, reuse and/or rehabilitate such structures (ex. Commercial Property Improvements Program).
Relocation3
If a particular structure which is in an area that is proposed for redevelopment is determined by the City and/or the CRA as worthy of being preserved, the CRA may, if they determine preservation is feasible, authorize funding necessary to move the structure to another location within or outside the redevelopment area.
Additionally, the CRA may fund relocation assistance on a case-by-case basis as may be necessary to carry out the Plan.
2 Note: TIF may not be utilized for recruitment activities it is constitutes a “promotional” or “marketing” activity.
3 Note: Limitation on relocation of buildings per AGO 2009-32.
Property Management and Maintenance
Property Management
The CRA may manage property in furtherance of the principals and themes of the plan either directly or indirectly through the employment of agents, employees, independent contractors, companies or other persons.
Landscape & Site Maintenance
The CRA undertakes projects, both future and past, that require maintenance once the project is completed and open to the public. The CRA may employ maintenance services either directly or indirectly through the employment of agents, employees, independent contractors, companies or other persons.
Public Improvements, Beautification & Infrastructure
The Plan identifies specific public improvement projects to be implemented. In addition, the CRA may undertake and fund, in cooperation with public and private partners, public infrastructure improvements throughout the Redevelopment Area. These projects are not designed to replace funding already allocated for capital improvements in the area but rather to augment them. Projects should be multifaceted, accomplishing several goals outlined in the prioritization criteria found within the Implementation section of the Plan. Projects may be authorized by the CRA on a project-by-project basis or pursuant to established program policies and guidelines.
Allowable improvements include the following:
• Streetscapes – including a combination of street improvements such as, paving, striping, curb & gutter, signalization, signage, street trees, landscaping, lighting and/or sidewalks.
• Pedestrian & bike improvements – such as sidewalks, crosswalks, trails, lighting, furnishings, bike racks, etc.
• Landscaping & hardscaping.
• Parking improvements – provision for off-street parking, parking structures (public and private), parking lot improvements (landscaping, lighting, striping, paving); public parking facilities and public/private parking joint ventures.
• Open space, parks and public space enhancements – Including but not limited to, parks, plazas, passages, trails, boardwalks and recreation facilities.
• Transit – trolley, bus, bus rapid transit (BRT), ferry, water taxi, rail, etc. located within the district.
• Public Art – when in conjunction with broader development or infrastructure projects.
• Waterfront & bay improvements – bulkheads, docks, marina slips, boardwalks and promenades, erosion control, etc.
• Utility upgrades – Upgrades to water, gas, sanitary sewer, phone, data, electric and other utilities when in conjunction with or in furtherance of broader development or infrastructure projects.
• Overhead utility relocation – relocation of overhead utilities shall be coordinated with utility electric company, phone, cable and data providers and the City when in conjunction with or in furtherance of broader development or infrastructure projects.
• Storm water management – storm water treatment (bio-swales, rain gardens, BMPs), detention, retention and conveyance when in conjunction with broader development or infrastructure projects.
• Environmental improvements – hazardous material cleanup, bay water-quality improvements, erosion control, etc. in preparation for broader development or infrastructure projects.
• Signage – District identification, district gateway, wayfinding, etc. in conjunction with or in furtherance of broader development or infrastructure projects.
Dissemination of Information
The CRA may undertake efforts to inform the public and stakeholders of CRA efforts to remedy slum and blighted areas as well as those specific opportunities available under CRA programs. Information may be disseminated via a number of methods, including but not limited to print and electronic means.
Community Policing Innovations
The CRA may fund Community policing innovations, as defined under Chapter 163, Part III, Florida Statues, to target or deter criminal activity within a community redevelopment area.
Administration and Professional Consulting Services
The CRA is empowered to fund all operational, management and administrative activities of the Agency including, but not limited to, employees’ salaries and benefits, equipment, supplies, software and vehicles.
The CRA is empowered to hire private consultants for expert and temporary services to carry out the Plan, including all planning and analysis activities necessary for implementation and decision making.
Not-for Profit Entity4
The CRA is empowered to create a not-for-profit entity to facilitate receipt of outside source funding for purposes of implementing the CRA Plan.
4 Note: The CRA may create a non-profit but may not use TIF funds for its creation.
EASTSIDE VISION
This CRA Plan Update entailed understanding where the Eastside is today and what is still needed to restore the Eastside to the thriving neighborhood it once was. Recent efforts include the construction of the park of Hollice T. Williams Park and the creation of a Neighborhood African American Heritage Trail to tell the story of prominent African Americans in Pensacola. While some challenges remain, there are strong community partners and advocates, including the Eastside Neighborhood Association, the East Pensacola Student Athlete Program, the E.S. Cobb Center, and Movement for Change, to name a few, who remain committed to making the vision of residents a reality. Community leaders are working together to tell the stories of the Eastside, prioritize residents in the redevelopment of the neighborhood, and ensure that the remaining fabric of this neighborhood is preserved.
The following elements from prior planning remain relevant and should anchor reinvestment in the Eastside. Over the coming years, reinvestment efforts should continue to address how to:
• Share the history of the Eastside, preserve structures of historical significance and minimize demolition;
• Address the high-speed traffic and appearance and safety of Dr. Martin Luther King Jr. Drive and the Davis Street corridors;
• Complement the unique architectural character of the neighborhood while encouraging compatible commercial development that will provide access to daily needs and other amenities;
• Provide affordable housing and ensure residents can stay in the neighborhood;
• Reimagine Hollice T. Williams Park in a manner that brings the neighborhood together and addresses the needs of current residents.


Movement for Change building
Eastside home
Community pool
HOW TO USE THIS CRA PLAN
PLAN ORGANIZATION
The Eastside CRA Plan Update is one of three parallel plan updates for each of the CRA Districts. Some high-level goals and policies overlap more than one district, but each Plan Update is tailored to specifically target the visions, opportunities, and implementation goals of the community in each district. Each Plan Update is structurally aligned for ease of use by the CRA throughout the implementation of these plans.
Introduction
This chapter provides an overview of the CRA's role and responsibilities specific to the Eastside. Also described is the alignment of the CRA Plan Updates with the city's 10-year strategic plan, Strive to Thrive: Pensacola 2035.
Planning Process
This chapter summarizes the robust community engagement process conducted by the CRA and the consultant team. Overall summaries of community feedback can be found in this chapter, with more detailed inventory of community feedback for reference in the Appendix.
Analysis
This chapter contains detailed analysis of the demographics, market potential, physical conditions, political boundaries, and transportation systems specific to the Eastside CRA District.
Recommendations
This chapter contains an index of all policy, program, and project recommendations that are either new or updated from past plans, categorized by the following topics:
• Land Use, Zoning, and Special District
• Economic Development
• Neighborhood Development
• Housing
• Transportation, Streets, and Parking
• Open Space and Community Amenities
This chapter also includes a selection of Special Demonstration Projects, which serve to illustrate the potential impact of the implementation of collections of recommendations. These pages are intended to be "one-stopshops" for potential actionable initiatives, but do not require exact conformity and do not represent the entirety of potential impactful projects for the district.
Impacts and Projections
This chapter describes the impact of recommendations on neighborhoods, provides a preliminary list of priority projects, and TIF revenue projections.
Appendices
The appendices provide detailed background and studies that were produced or collected throughout the process and informed the recommendations, including:
• Summary of Step 1 Engagement
• Summary of Step 2 Engagement
• Demographics and Market Analysis
• CRA Funding Resources
• Sidewalk Prioritization
• Micromobility Area Map
• Cost and Impact Countermeasures
• Transportation Analysis
STRATEGIC PLAN


2035, all residents have the support they need to stay and thrive in their city — at every stage of life.


ALIGNMENT WITH THE STRATEGIC PLAN
Strive to Thrive, Pensacola's 2035 Strategic Plan, is intended to create consensus around a shared community vision and build a strategic foundation to build towards this vision. The Strategic Plan is a summary of the needs and opportunities of the entire City of Pensacola and provides recommendations for a variety of initiatives that particular city departments (i.e. Mayor's Office, City of Pensacola Public Works & Engineering Department, Housing Department, Sustainability & Resiliency Department, etc.) could lead in order to achieve these goals city-wide.
The City's strategic plan is a tool to guide city government's decision-making and ensure that strategic initiatives add up to achieve the broader goals and values of the Pensacola community. The City's community redevelopment plans align with the strategic plan and identify specific projects and activities authorized for the expenditure of Tax Incremental Financing (TIF) within the Urban Core, Westside and Eastside districts. The redevelopment plans are statutorily required for the expenditure of TIF funding under Chapter 163, Part III, Florida Statutes.
Eight goals were developed through this extensive engagement and analysis process that will guide priorities in Pensacola over the next 10 years:
• Attainable Housing for All Income Levels
• Support for Youth Experiences
• More Walkable, Mixed-Use Districts
• Thriving Innovation and Businesses
• Safe Streets for All Mobilities
• Resilient Waterfront and Neighborhoods
• Public Spaces that Connect Communities
• Neighborhoods that Celebrate Culture and Honor Legacy
PLANNING PROCESS


OVERALL PROCESS
PROCESS OVERVIEW
The process to develop this plan began in 2023 and builds on the past plans for the Westside and an extensive engagement process with residents and stakeholders. A rigorous step-by-step process was followed, incorporating multiple rounds of community engagement to guide the development of the recommendations. The process for the Westside CRA Plan ran concurrently with the plans for the Urban Core and the Eastside, with dedicated opportunities for residents of each local area to provide input and feedback on the plan initiatives for each specific area. Below is a summary of the engagement that took place:
• Over 900 comments received from more than 270 participants at the community meetings;
• Over 200 comments from pop-up neighborhood workshops;
• Over 750 comments from 213 contributors on the interactive map.
Step 1: Analysis + Listening
The first step in this process involved meeting with community members, local business owners, and stakeholders to understand strengths and challenges and to receive suggestions about neighborhood improvements. In addition to reviewing existing plans and studies, this step also included:
• Listening Workshop #1 (May 28th-31st) — included stakeholder meetings;
• Online Interactive Map (May 28th-August 23rd) — to gather input from the public;
• Virtual Workshop (June);
• Neighborhood Association Luncheon (July 22nd);
• Vibe & Conversation — Belmont-DeVilliers (July 23rd);
• Cobb Center Summer Kids Camp Pop-Up (August 1st);
• Cobb Center Senior Bingo (August 2nd);
• Fricker Center Summer Kids Camp Pop-Up (August 5th);
• Coffee Conversation — Pensacola Library (August 7);
• Fricker Center Senior Bingo (August 9th);
• Pizza & Conversations — Lost Pizza (August 12th);
• Environmental & Waterways, Parks & Amenities, and Developers Virtual Meeting – (August 14th).

STEP 1
Analysis + Listening Listening and understanding the needs of the community Testing Concepts testing ideas for future investments with residents and stakeholders
STEP 2


STEP 3
Feasibility + Deciding Deciding what the best solutions are for Pensacola CRA areas
STEP 4
Adoption Adopting the Plan

Listening Workshop #1
Step 2: Testing Concepts
During this step, the team held a planning workshop to test concepts for priority projects in the neighborhood, such as housing and retail, and street and park improvements. Opportunities for feedback included:
• Four-day Testing Workshop (in-person);
• Digital surveys after Steps 1 and 2.
Step 3: Feasibility & Deciding
This step entailed reviewing what we learned from the Testing Workshop and subsequent survey, and documenting the preferred plan for the Eastside, including:
• Draft Plan Development;
• Two-day Implementation Workshop to get input on the Draft Plan.
Step 4: Adoption
The final steps of this process include:
• March – presentation to the CRA & recommendation from the Eastside redevelopment board;
• April – approval by the CRA;
• May – consistency review with the compilation plan by Planning Board;
• June – adoption by City Council.
COMMUNITY ENGAGEMENT STRATEGIES
This CRA Plan Update is anchored in the input received from Eastside residents about what is most needed in the neighborhood. The CRA team collaborated with the Eastside Neighborhood Association to identify opportunities for engagement with Eastside residents and stakeholders.
In order to maximize opportunities for participation, the team held multiple in-person and virtual events throughout the process. The CRA team also hosted additional engagement events (see Appendix) to meet people at existing gatherings and places of business. It was important to listen to residents about the existing conditions and key issues to address, while also establishing feedback loops to evaluate potential project ideas and opportunities for investment.
Ongoing communication was a core principle of this process. A CRA Plan website was established at the outset, and the following tools were used to keep participants up to date on the process:
• Regular website updates;
• Sign up via the website;
• Email updates to those that signed up on website, or at an in-person meeting;
• Digital surveys after each step of the process;
• Social media updates via Instagram and Facebook.


Testing Workshop
STAKEHOLDER GROUPS
• Workforce
• Housing
• Environment & Waterways
• Parks & Open Space
• Arts & Culture
• Neighborhood Associations
• Transportation
• Community Support organizations
The following is a summary of what we learned during this step and the factors that informed the recommendations in the CRA Plan.
Strengths to Build On
• Neighborhood history — the Eastside was home to important African Americans and has many historically and culturally significant sites;
• Historical and educational institutions (Chappie James Museum & Flight Academy, Movement for Change);
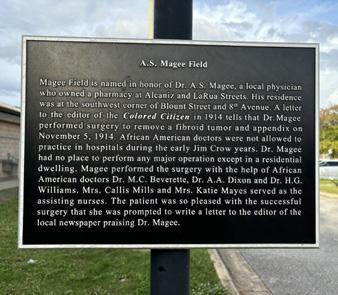
• Parks and community centers that offer activities and resources for families, children of all ages, and seniors (including Magee Field);
• Existing architectural character.
Major Concerns
• Lack of affordable, accessible grocery store;
• Lack of neighborhood-serving retail offering everyday goods & services;
• Existing parks are not well-maintained and difficult to walk to;
• Noise and air pollution from I-110 on the adjacent neighborhood;
• Vacant/rundown buildings and lots make the area feel unsafe and detract from the existing character;
• Poor bike and pedestrian connections to amenities and downtown;
• Lack of public amenities (i.e. bathrooms);
• Existing infrastructure is inadequate, leading to drainage issues & flooding;
• Speeding traffic;
• Littering.
Opportunities for Investment
• Additional amenities and programming for existing community centers & parks in the neighborhood;
• Create a safe community (better lighting, neighborhood watch);
• Celebrate the history of the area through public art, signage, building preservation, and education;
• Create safe pedestrian and bike connections to neighborhood amenities;
• Create a wide variety of parks with different uses and programming;
• Build affordable housing;
• Ensure existing residents have a say in the future of the Eastside.


Crystal Ice Company Building
Magee Field
Chappie James Museum & Flight Academy
STEP 2: TESTING CONCEPTS
Based on what we learned in Step 1, the team tested ideas for potential projects in the Eastside, which included:
• MLK & Davis conversion to the original 2-way street network;
• Restoration of the Ice House as a gathering space and marketplace ;
• Infill housing, opportunities for residential and commercial renovations;
• Enhancements to cultural landmarks such as the E.S. Cobb Resource Center;
• Opportunities to celebrate the unique history and character of the Eastside through gateways, public art, and branding;
• Safety enhancements;
• Small business incubation and capacity building.
STEPS 3 & 4: FINALIZING THE PLAN
The final steps of the process included refining the project ideas to prioritize investment in the neighborhood. The final plan reflects input from residents regarding the most impactful opportunities for improvement.


Developer Feedback: Important Factors Infrastructure
Placemaking and Amenities
• Well-maintained streets & sidewalks are attractive
• Open spaces nearby add a boost
• Near other developments (residential, commercial, mixed) is attractive
• Perception of safety is attractive
Economic and Job Hubs
• Clustering of high(er) paying jobs is attractive
• Resident today have mixed perceptions about economic growth accelerating
• Desire for proximity to or inclusion of jobs/ business/ entrepreneurship / workforce training opportunities
• Attracted to sites where the City takes on stormwater retention responsibility
• For now, high flood risk areas are avoided due to cost/risk
• Need for additional transit access
• City facilitating the availability of public land (via parcel cost or assembly) is attractive, as a means to support private development moving forward
• Project on other types of land (churches, etc.) with zoning changes is attractive
• Proposed projects on privately-owned land will be more expensive to develop
Parking Funding Permitting
• Existing minimum parking requirements are viewed as a cost challenge that could be reduced
• Investors and developers from outside of the region tend to be less risk averse, but need a compelling vision and project opportunities to attract them
• Projects that can easily obtain permits are more attractive
ANALYSIS


DEMOGRAPHICS AND MARKET ANALYSIS SUMMARY
Analyzing the existing demographics and market conditions of the CRA Districts was an essential step, laying the foundation for effective recommendations for policies, programs, and projects. This analysis was conducted across all three CRA Districts simultaneously, but also narrowed in on each district to identify specific conditions per district.
The intent of this analysis was to:
• Analyze demographics of each CRA District;
• Identify primary community stressors;
• Identify opportunities in the market;
• Determine the potential impacts of development in each district in order to prevent the displacement of residents and businesses;
• Provide priorities for designers and policymakers to make positive impacts and avoid negative impacts on the community.
DEMOGRAPHICS AND SOCIOECONOMICS
Resident Demographics
The Metropolitan statistical area (MSA) where Pensacola sits has a steadily growing population (1.1% annual average growth rate from 2020 to 2024, similar to the state’s overall trend at 1.3% per year in the same period). The MSA’s population is younger than the state’s overall (40.3 vs 43.5 in median age), an asset that the City leverages for job creation and economic development.
In the Eastside CRA District specifically, as of 2024, there are over 1,000 residents residing in the District, with a population density (3,165 per square mile) significantly higher than the city (2,375 per square mile) and the MSA (320 per square mile). The District’s population has been stable (0.1% annual average growth rate from 2020 to 2024), and the median age is significantly lower than that in the MSA (37.5 vs 40.3).
Income and Affordability
At the regional level, Pensacola MSA’s median household income is on par with and slightly higher than the state’s ($76k vs $75k), while the MSA’s median home prices tend to be lower than the state average ($331k vs $392k). Hence the MSA has a much higher affordability index, which takes into consideration both price and income factors, than the state (93 vs 75). Housing affordability index, developed by ESRI Business Analyst based on Census data, indicates the relative affordability of a place; an index greater than 100 suggests homes are easily afforded by the average area resident, and an index less than 100 suggests that homes are less affordable. In terms of poverty, the city’s and the MSA’s poverty rates are on par with the state’s level (all around 12%-14%).
Adopted June 12, 2025
Resident Demographics
(2000-2020)
Income and Affordability
Housing Affordability Index
Jobs, Businesses, and Employment
(2024)
Average size of business (employees per business) (2024)
Share of population age 25+ with bachelor's degree of higher (2024)
Data source: ESRI Business Analyst; American Community Survey
In the Eastside CRA District specifically, as of 2024, the homeownership rate is lower than the MSA (54% vs 69%). The District’s median home price is lower than the MSA ($267k vs $331k), but so is its median household income ($38k vs $76k). Therefore, the affordability index in the District is lower than that in the MSA (58 vs 93), pointing to the need for both increased income and attainable housing. The poverty rate in this district (25%) is higher than the city average (14%), hence residents in this area might be particularly vulnerable to major market fluctuations.
Jobs, Business, and Employment
In the region, the military has been a major employment driver, together with key sectors such as professional services, education, healthcare, tourism, and public administration. The city is a job hub in the area, with an employee to resident ratio of 1.1 to 1 (compared to the 0.4 to 1 ratio in the MSA). In terms of job growth, the MSA and the city have seen relatively stagnant growth (0.4% and -0.2% on average per year since 2010) compared to the state (2.2%). In terms of residents’ access to jobs, the city has a higher educational attainment than the MSA, measured by the share of population above 25 years old with a Bachelor’s degree or higher (43% vs 32%).
In the Eastside CRA District specifically, as of 2024, the area is more residential than the city as a whole, with the employee to resident ratio of 0.5 to 1.
The educational attainment of residents in the District tends to be lower than that in the city as a whole (32% of District residents above 25 years old have a Bachelor’s degree or higher, compared to the city’s 43%). The District’s median income is lower than the city median ($38k vs $69k), indicating a need for greater access to upskilling and quality job opportunities.
All these statistics and more are further detailed in the Appendix.

Assessed Property Value by Parcel (2024)
REAL ESTATE MARKET
Housing Market
Compared to the MSA, the city has a slightly lower share of single-family homes in the total housing market (73% vs 80%), and a higher share of small-sized multi-unit housing (11% vs 7%); the shares of larger structures are similar at the city and the MSA levels (both around 5%-6%). The city’s pace of building new housing, however, is slower than the MSA, as 6% of the city’s housing stock was built in 2010 or later, whereas the statistic in the MSA is 13%. The city’s vacancy rate is on par with the MSA’s (11%-12%). In terms of price, the median home value in the city is slightly higher than the MSA ($354k vs $330k), while median rent in the city is lower than that in the MSA ($1,144 vs $1,260).
In the Eastside CRA District, housing is predominantly single-family (84%). 8% of the total housing in the district was built after 2010, a slightly higher share than the city (6%) but still lower than the MSA (13%). Vacancy rate is higher than the city average (21% vs 11%), and median home value ($267k) and median rent ($841) are both significantly lower than the city medians.
Commercial Market
The city has a high concentration of office, retail and hospitality assets in the region, with the city’s commercial space (measured by SF or unit) to population ratios being 7 times as high as those in the MSA and state. For office, the city’s current vacancy rate (2%), on par with the MSA’s level (3%), is significantly lower than the state’s (8%); new construction and absorption activities in the city have been relatively low. For retail, vacancy rates at the city, MSA and state levels are similar (all around 3%); there is currently more new retail under construction in the city than new office construction. In the hospitality sector, the city’s current occupancy rate (62%) is on par with the state’s (63%), both slightly lower than the state average (70%); there are several new hotel developments under construction or in the pipeline within the city.
The Eastside CRA District has low office presence and no existing hotels, but the district’s retail spaces are noticeable (131,000 square feet) with a low vacancy rate (1%), indicating the potential need for commercial spaces that suit neighborhood character and can help grow local small businesses.
Property Value Analysis
The data for this analysis was obtained from the City and included a comprehensive list of assessed parcels within each Community Redevelopment Area (CRA). To ensure an accurate representation of taxable properties, all parcels with a noted exemption status or public ownership were removed from the dataset. This filtering process allowed for a focused analysis of non-exempt parcels, providing a clearer picture of the assessed property values within each CRA.
Data source: ESRI Business Analyst; American Community Survey; CoStar
The Eastside CRA has a total assessed value of $89 million across 759 non-exempt parcels, with an average assessed value of $118k. The highest-valued property is assessed at $6 million. Compared to other CRA districts, this CRA consists of smaller and lower-value properties, including single-family residential and underdeveloped commercial areas. Many of the lowest property values are clustered beneath the I-110 overpass at the Hollice T. Williams Park and scattered throughout the district, and highest property values are clustered around the edges of the CRA.

MARKET OPPORTUNITIES
Based on the assessment of the regional and local socioeconomic and market conditions, the following potential strategies are identified to further drive the city’s economic development efforts:
• Public realm strategy: Induce and organize private development with investments in parks, open spaces, high-quality streets and sidewalks, and amenities. In the planning and implementation strategy, be mindful of gentrification and displacement risks.
• Strategic development sites: Identify shovel-ready development and/or adaptive reuse sites as demonstration projects. Attract private investments with streamlined site assemblage and community-supported visions.
• Incentives: Motivate private investments where ROI is currently too low relative to competition from other
regions. Consider the following when designing and implementing potential incentive programs:
1. Tie the applicants’ qualifying criteria to KPIs aligned with key policy goals and the City’s Strategic Plan;
2. Conduct cost-benefit analysis to determine the programs’ fiscal impact;
3. Consider a broad array of incentive tools - in addition to fiscal tools, consider zoning policies, land contribution, and permitting and regulatory relief as part of the toolkit;
4. Consider a phased approach to test the programs in specific high-priority areas before expanding their application;
5. Consider combine guidance on community benefits agreement with incentive design to ensure fairness and preempt gentrification concerns;
6. Leverage state and federal programs to maximize the impact of local programs.
• Economic opportunities and wellbeing: Continue to leverage workforce training partnerships as well as education programs to prepare residents for high-quality careers and attract businesses. Uplift residents with access to fresh food, health, and social services. Improve the perception of public safety. These improvements also help attract further private investments.
Kindel Media
PHYSICAL PATTERNS

PATTERN ANALYSIS OVERVIEW


The following series of diagrams is intended to reveal key characteristics and opportunities about the community by isolating both physical and zoning elements such as land use designations, street typologies, open space amenities, vacancies, distinct classifications, and more. Identifying patterns through these standardized analytical plan diagrams helps to target specific community place-based needs and opportunities.
Mapping patterns during the workshop helps reveal objective conditions and prove residents' anecdotal experiences
EASTSIDE

EXISTING LAND USES
The primary existing land use in the Eastside is residential. Retail and commercial uses line Cervantes Street at the southern boundary and are located throughout the district, in particular along N Davis Highway and N 9th Avenue. The small geography and predominantly residential uses in the Eastside district are challenges for TIF revenue generation.

COMMERCIAL & RETAIL USES
The Eastside CRA District has the least commercial land use of the three CRA Districts. Retail and commercial uses line Cervantes Street at the southern boundary of the district, and are located throughout the district, in particular along N Davis Highway and N 9th Avenue. While not concentrated, the retail and commercial uses throughout the Eastside represent important cultural and social institutions, many of them minority-owned and serving the residents of the district.
EASTSIDE
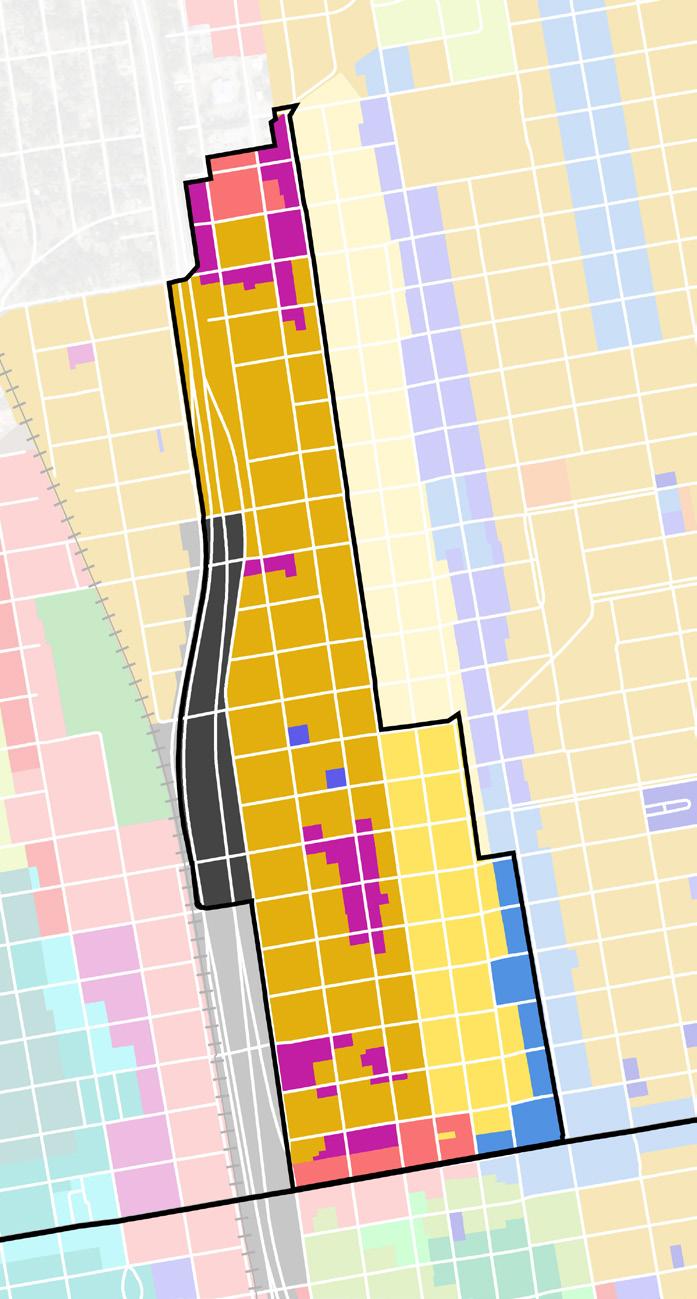
ZONING
The Eastside CRA District is largely zoned lower-density residential with some small pockets of Residential/Neighborhood Commercial zoning. Cervantes Street to the south is zoned Commercial (C-3) and 9th Avenue to the southeast is zoned Retail Commercial (C-1). The majority of the western boundary is zoned as Interstate Corridor.
Commercial (C-3)
Interstate
One and two family (R-1A)
One and two family (R-1AA)
Residential/Neighborhood
Commercial
Residential/Office
Retail Commercial (C-1)
EASTSIDE
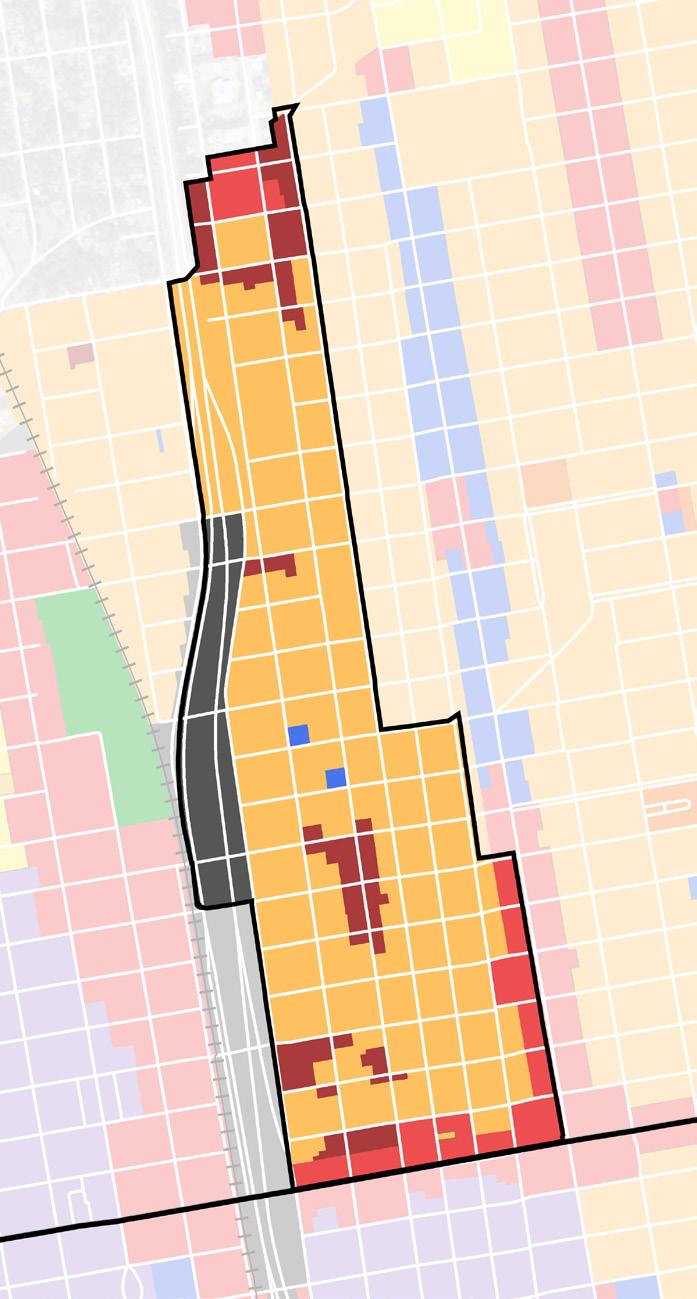
FUTURE LAND USE
The City of Pensacola Land Development Code (LDC) establishes the intended future land uses for districts and parcels. The City is currently in the process of revising the LDC, and the map to the left may change with future updates. The full range of future land use categories are listed below.
Conservation Land Use (CO)
Low-Density Residential Land Use (LDR)
Medium-Density Residential Land Use (MDR)
High-Density Residential Land Use (HDR)
Office Land Use (O)
Residential/Neighborhood
Commercial Land Use (RNC)
Commercial Land Use (C)
Industrial Land Use (ID)
Historic and Preservation Land Use (HP)
Redevelopment Land Use (R)
Business (B)
Interstate Corridor (IC)
EASTSIDE

VACANCY
Approximately eleven percent of the land in the Eastside CRA District is vacant. These are unoccupied lots that are not being used for their intended purpose. Most of the vacancies are small, single-family lots scattered throughout the entire district area. The vacancies create fragmented development patterns and lessen the value of the existing homes.
Vacant Lots
EASTSIDE

PUBLICLY-OWNED LAND
Publicly-owned land is an important asset. It can incentivize development that benefits the community and be used to create amenities such as open spaces and recreation facilities. The majority of the publicly-owned land in the Eastside CRA District is part of Hollice T. Williams Park, Magee Field, or the EB Cobb Resource Center. The City-owned block on Cervantes Street is the Fire Department headquarters and station. There are not currently publicly-owned development sites in the Eastside CRA.
Federal-owned land
State-owned land
County-owned land
City-owned land
City-owned parks & open space
City-owned vacant land
EASTSIDE

NEIGHBORHOODS
The Eastside neighborhood stretches almost the entirety of the Eastside CRA District. It is a historically African American neighborhood and is home to many important figures such as Daniel "Chappie" James, Jr. Residents have worked tirelessly to preserve and celebrate the cultural impact of the area through the African American Heritage Trail.
Baars St
Leonard St
Fisher St
Cross St

HISTORIC DISTRICTS
Because of Pensacola's long history, there are many areas that are historically and archaeologically important.
There are no historic districts currently located in the Eastside CRA District. This does not mean there are no historically-significant properties, structures, or sites; however, there are no protected preservation areas currently.
EASTSIDE
Hollice T. Williams Park
Chappie James Museum
Lloyd St
Brainerd St Gonzalez St De Soto St Strong St
EASTSIDE

UNIQUE DISTRICTS & OVERLAYS
There are several unique zoning districts, resource protection overlays, and other overlays that require sensitive design and enhanced access in the City of Pensacola. The Eastside CRA District includes the CRA Urban Design Overlay and Wellhead Protection Areas.
CRA Urban Design Overlay
The CRA Urban Design Overlay area covers all of the Eastside CRA District. The purpose of the district is to improve the visual appearance of these areas, while preserving the urban and architectural character. The regulations support replacing blighted properties with quality, pedestrian-oriented development and encourages a mix of uses that can support a variety of locally-oriented businesses and cultural institutions.
Wellhead Protection Area
Two Wellhead Protection Areas overlap into the Eastside CRA District. These areas are established to protect underground-based sources of drinking water. The goal is to protect the ground area around public water supply wells from contamination.

PARKS, OPEN SPACE, AND AMENITIES
The CRA Districts include various parks, open spaces, and public amenities that enhance the livability and desirability of these areas. The following inventory lists all of the open space and recreation amenities in the Eastside CRA District.
• Hollice T. Williams Park
• Magee Field
Further analysis should categorize the parks as passive versus active open space and show how future planned open space connections could better link the existing parks, open space, and amenities to ensure that all parks and open spaces are utilized appropriately and contain amenities that are well-maintained by the city and well-used by the community.
THIS PAGE INTENTIONALLY LEFT BLANK
TRANSPORTATION ANALYSIS SUMMARY
EXISTING CONDITIONS
Understanding the existing conditions of transportation infrastructure and usage establishes a foundation for developing near-, medium-, and long- term recommendations to ensure that all residents enjoy safe and comfortable mobility options. This assessment was assembled from a variety of sources, including city and FDOT traffic and crash data, previous plans, and resident comments.
Geography & Layout
The Eastside district is geographically very narrow. Major roadways separate and divide the district making walkability and connectivity a challenge. Major north-south connectors to and from downtown are the one-way couplets Dr. Martin Luther King, Jr. Drive and N Davis Highway. This one way pair becomes the main access point to I-110 and lacks traffic calming measures that improve safety and well being for pedestrians and cyclists.
Pedestrian & Bicycle Facilities
There are many challenges with the pedestrian and bicycle infrastructure in the Eastside. The lack of crosswalks, bicycle lanes, and maintenance of these facilities further amplifies barriers to safety and comfort by residents.
Although there is a general lack of facilities in the Eastside, this district does happen to contain the longest segment of continuous bike lane in the city along N Davis Highway. But despite its length, both ends of this bike lane are dead ends in undesirable locations and there are no east-west connections that provide dedicated bicycle infrastructure.
Roadway Safety
The widths of rights-of-way in the Eastside are relatively narrow, indicative of the city's age and the primarily residential nature of this CRA District.
Additionally, the allocation of space within rights-of-way tends to favor space for cars over any other form of travel. Drivers tend to drive faster as lanes widen, further decreasing the safety of pedestrians, bicyclists, and the drivers themselves.
The Active Transportation Plan (ATP) adopted in 2023 identified the intersection of Dr. Martin Luther King, Jr. Drive and E Blount Street as one of the top five "high crash intersections" within the CRA Districts. Additionally, the Emerald Coast Regional Council Safe Streets and Roads For All Safety Action Plan (December 2024) identifies N Davis Highway as a Tier-1 Priority High-Injury Network roadway.

WHAT IS WALKABILITY?
Walkability is a term that refers to the ease and ability to access amenities on foot. Great urban places tend to be very walkable, meaning that residents and visitors are able to walk (or use mobility aids) to safely and comfortably reach destinations like shops, daily services, parks, schools, employment centers, and more. Ideally, making a place more walkable will translate into more people choosing to walk instead of driving, which has health, social, economic, and environmental benefits.
This concept also often extends to bicycling infrastructure, called "bikeability." Leading to the same benefits, bikeability is another important ingredient for great urban places.
RECOMMENDATIONS


BIG IDEAS FOR THE EASTSIDE
ABOUT THE RECOMMENDATIONS
The recommendations in this plan are based on the input gathered from Eastside residents and stakeholders throughout this process and an extensive analysis of existing conditions and ideas in prior plans. These recommendations build on prior work while acknowledging the current market conditions and the ever-evolving needs of the community. This chapter includes a series of core ideas to restore the Eastside to a thriving community grounded in its unique history and culture, followed by policy recommendations that provide additional detail on how to make that a reality.
CORE CONCEPTS
The following is a summary of the core concepts to revitalize the Eastside, incentivize equitable development, and ensure that the neighborhood continues to evolve in a manner consistent with the vision of its residents. These ideas reflect the community feedback received throughout the public engagement process.
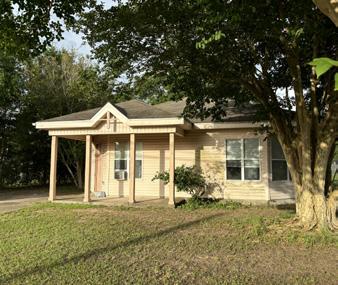
Diverse and Attainable Housing
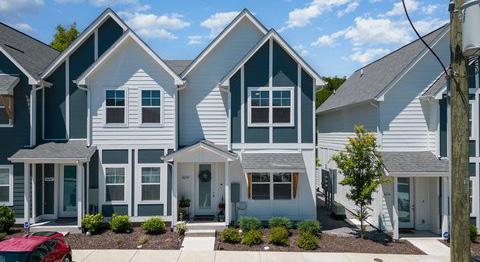
Expanding the range of attainable and affordable housing options is a serious need in the Eastside. A long history of displacement and blight can still be felt in the vacancy along some streets and Eastside residents want to see opportunities for diverse housing types that can accommodate a wide range of income types. Infill development can also provide smaller development opportunities for local entrepreneurs, which is a priority of the Eastside Neighborhood Association. Investment in new housing should complement the existing scale and character of the neighborhood, while ensuring that existing residents are able to stay in their homes.
Enhancing Parks and Recreational Amenities
Hollice T. Williams Park, Magee Field, and the E.S. Cobb Resource Center are just a few of the treasured amenities in the neighborhood. Enhancing these existing centers and ensuring that residents can travel to and between them is a priority for the youth of the neighborhood. Continuing to maintain, invest in, and explore the appropriate programming of these spaces will be a critical part of continuing to serve local residents by creating spaces to gather and enhancing recreational amenities in the Eastside.


Eastside neighborhood entry sign
Infill housing example
Historical marker at Magee Field

Prioritizing Safety and Walkability


The street grid in the Eastside was seriously impacted by the construction of I-110, and therefore is often confusing for both drivers and pedestrians, resulting in some hazardous conditions. There’s an opportunity to restore a neighborhood-scale street grid that prioritizes walking and biking, while allowing for the flow of traffic through the neighborhood. The recommendations in this chapter describe potential improvements to key streets that enhance pedestrian safety, provide additional bike connectivity, and complement neighborhood character, encouraging future investment.
Culture and Economic Mobility
The Eastside has a unique history as the home of many prominent African-Americans, such as General Daniel “Chappie” James, and neighborhood treasures such as the former H&O Cafe. For years, the Eastside Neighborhood Association has worked to create an African American Heritage Trail that shares the history of its many prominent African-American residents. There’s an opportunity to build on this momentum and anchor future economic development efforts around celebrating and telling the complex history of the Eastside. This could include bringing some of these important sites back to life while supporting local entrepreneurs and businesses and providing economic opportunities.
Sidewalk conditions along major Eastside corridors
The Chappie James Museum
Heritage trail pamphlet
Baars

Cross St
RECOMMENDATIONS
1. Transfer Maintenance of Dr. Martin Luther King, Jr. Drive and/or N Davis Highway to the City of Pensacola
2. Stormwater and Drainage Infrastructure Maintenance
3. Potential Trail Connection along Blount Street
4. Eastside African American Heritage Trail
SPECIAL DEMONSTRATION PROJECTS
Special Demonstration Projects are examples of potential projects that achieve community goals by addressing all six categories of recommendations. These projects show potential future visions that are subject to change. In the Eastside, these catalytic projects could include:


HOW THE RECOMMENDATIONS ARE ORGANIZED
Recommendations are organized into the following topics:
Land Use, Zoning, and Special Districts
These recommendations are focused on optimizing planning regulations to encourage appropriate future development while preserving the existing character of neighborhoods.
Economic Development
These recommendations target initiatives that boost local economies by bringing commercial and rich mixes of uses into the district.
Neighborhood Development
These recommendations are aimed at strengthening neighborhoods through partnerships, capacity building, and building on existing assets.
Housing
These recommendations are focused on creating a wide range of affordable/attainable housing options.
* The quotes shown on the Special Demonstration Project pages represent comments received from residents and stakeholders throughout the engagement process, including community meetings, surveys, website commenting tools, etc. Minor adjustments to the language of the comments were made for clarity purposes only.


Transportation,
Streets, and Parking
These recommendations are intended to improve safety, connectivity, accessibility, and navigability for all users.
Open Space and Community Amenities
These recommendations aim to improve public spaces and equitably distribute and provide community resources.
3. Hollice T. Williams Park Equitable Development Framework Plan
1. Crystal Ice House Market
Eastside Infill Housing
4. Hayne Street Improvements
5. Dr. MLK Jr. Drive and N Davis Highway Streetscapes
6. Gonzalez Street Shareway
CRYSTAL ICE HOUSE MARKET


Do you think that the Crystal Ice House is an important cultural landmark that should be preserved and reused?
56% of Eastside Residents say YES
22% say NO
22% say NOT SURE
About the Special Demonstration Project
The Crystal Ice House is a cultural landmark located at E Jordan Street and N Davis Highway. Built in 1932, this is the only remaining ice house of four that supported the local fishing industry before household refrigeration. The Crystal Ice House was added to the national register of historic places in 1983, and in 2007, Pensacola named it as one of the "Seven Wonders of Pensacola."
In the future, the Crystal Ice House and adjacent parking lot could be transformed into an outdoor market to catalyze economic development in a neighborhood that once had many thriving African-American businesses. A new outdoor market could complement the longstanding LA Store that is directly across the street, which has served the neighborhood residents for many years.
This newly imagined market could provide space for local entry-level entrepreneurs, including African-American-owned business owners seeking to scale up, local food trucks, and artists. The market could also serve as a gathering space with a new pavilion for performances, community celebrations, and a space for sharing the rich history of the Eastside.
An ice cream or other themed vendor could re-occupy the Ice House, anchoring a new space of commercial activity for Eastside residents.
Community Feedback
Eastside residents were in support of reutilizing the Crystal Ice House, and adding incubator spaces for local small businesses. Their suggestions included:
• Reserve a percentage of vendor spaces for Eastside entrepreneurs alongside regional businesses;
• Find a themed vendor for the Crystal Ice House that pays homage to the former use.
Implementation & Next Steps
The CRA is coordinating with the Escambia County School District, which owns the Crystal Ice House, to explore options to replace the parking spaces in the lot north of the Spencer Bibbs Center in the surrounding neighborhoods. They may include shared parking agreements with churches or acquisition of vacant lots to develop parking lots for the school district. Rezoning would be required in order to add commercial spaces at this location. Continue to partner with the school district to look for funding opportunities for restoration of building facilities.
"I like the idea of a connected space to hang out and socialize"

LEARNING FROM THE HISTORY OF THE ICE HOUSES OF PENSACOLA
Pensacola was once home to several ice houses, which were built in the late nineteenth and early twentieth century to provide ice to Pensacolians before the invention and proliferation of modern refrigeration. This ice was mainly used to preserve fish for the local fishing industry. The quirky building features stucco icicles and a polar bear on the roof – an architectural landmark as much as it is a cultural one.
Pensacolians have fond memories of the ice houses. One resident remembers:
"On my walk home, which most of the year was in sunny, hot, and humid weather, I always stopped at the ice house.... All of my friends and I stopped for long and ice-cold drinks and water from the faucet. We drank all we could. At the time I took the plentiful and free freezing cold water for granted but looking back, I can see it was an unspoken gift of the ice company to use school children of the neighborhood."
*For full survey results, see Appendix


RELATED POLICY RECOMMENDATIONS
LAND USE, ZONING, AND SPECIAL DISTRICTS
• Develop Design and Form Standards for all projects receiving CRA funding
• Adaptively reuse vacant historic structures for neighborhood-serving retail, restaurants, and shops
ECONOMIC DEVELOPMENT
• Support the development of small retail nodes near higher visibility corridors and cultural landmarks
• Integrate the market with organizations that provide small business support
• Build the relationship with Escambia County School District
NEIGHBORHOOD DEVELOPMENT
• Support neighborhood capacity building
• Support the neighborhood in developing a unique identity and branding for the Crystal Ice House Market
• Offer incentives and support projects that preserve and celebrate cultural destinations and preserve historic buildings
TRANSPORTATION, STREETS, AND PARKING
• Transform Dr. MLK, Jr. Drive and N Davis Highway into slower-moving two-way streets with wider, shaded sidewalks
• Transfer ownership of Dr. MLK, Jr. Drive and N Davis Highway to city ownership
• Improve east-west walking and biking connections to Hollice T. Williams Park along E Jordan Street
• Underground utilities on Dr. MLK, Jr. Drive and N Davis Highway
OPEN SPACE AND COMMUNITY AMENITIES
• Fund and build a community gathering space on the northern Spencer Bibbs parking lot with an open-air pavilion for outdoor dining and events
• Enhance the historical markers along the Black History Trail, including the Historic Crystal Ice House and Spencer Bibbs Academy
Examples of small, pop-up, gathering spaces centered around food, live music, and other activation
"I'm a big fan of food parks!"
EASTSIDE INFILL

the blocks surrounding the Spencer Bibbs Center and throughout the Eastside CRA District. Smaller infill housing, like cottages and townhouses, should be built to increase housing options in the neighborhood and to add vibrancy around the Ice House Market. This could also provide opportunities for smaller, local developers in the neighborhood. Partnerships with local non-profits, such as the Eastside Neighborhood Association, should be pursued to explore opportunities for enhancing
Community Feedback
Eastside residents were in support of building infill housing. Their priorities included:
• Ensure housing affordability, especially for existing residents;
• Design infill housing that fits with the character of the surrounding neighborhood;
• Preserve on-street parking that is used by existing residents.
ries of pre-approved building plans that could be purchased by property owners and/or developers. These established standards make the design and construction processes easier, which may help encourage residential construction. Identifying candidate lots for these infill projects, or creating a checklist to determine an effective strategy for identifying candidate lots, could be the next step.
E Jordan St
Spencer Bibbs Center
Crystal Ice House Market
Crystal Ice House E Hernandez St
Lakeview Ave
Davis
"There are vacant lots that should be utilized"
"Housing quality should be improved!"
*For full survey results, see Appendix


RELATED POLICY RECOMMENDATIONS
LAND USE, ZONING, AND SPECIAL DISTRICTS
• Develop Design and Form Standards for all projects receiving CRA funding
• Refine the minimum lot sizes for development in this area, considering that the blocks do not have alleys and many lots are currently too narrow for on-lot parking
NEIGHBORHOOD DEVELOPMENT
• Offer incentives and support projects that preserve and celebrate historic buildings
HOUSING
• Continue offering property improvement programs to preserve and create affordable housing units
• Develop a companion program to the Residential Property Improvement Project (RPIP) for substantial demolition and reconstruction for primary structures and ADUs, rehabilitated or new construction, to facilitate new infill development
• Acquire lots for infill development and partner with organizations such as the Homebuilders Association to keep construction costs as low as possible for new housing construction projects
• Partner with Community Land Trusts, such as the Northwest Florida CLT, to acquire and develop infill housing on vacant lots surrounding Spencer Bibbs Center
• Continue to develop pre-approved building plans
• Use incentive programs to continue to fund affordable housing projects
R EC o MME n DA t I on S
• Identify target areas for incentives to encourage the construction of residential uses
TRANSPORTATION, STREETS, AND PARKING
• Transform Dr. MLK, Jr. Drive and N Davis Highway into slower-moving two-way streets with wider, shaded sidewalks
• Transfer ownership of Dr. MLK, Jr. Drive and N Davis Highway to city ownership
• Improve east-west walking and biking connections to Hollice T. Williams Park along Gonzalez, Blount, Jordan, and Maxwell Streets
• Underground utilities on Dr. MLK, Jr. Drive and N Davis Highway
• Explore curb management plans and develop revised parking requirements for infill projects
"More residential options is a great idea!!"
HOLLICE T. WILLIAMS PARK EQUITABLE DEVELOPMENT FRAMEWORK PLAN

Demonstration Project
Located along the western edge of the Eastside CRA District, Hollice T. Williams Park is an important community anchor. The park was created on the land remaining under and around the I-110 overpass. In the 1970s, this highway was cut through a thriving Black and African American neighborhood, uprooting and displacing long-standing homes, churches, businesses, and residents.
The communities surrounding the park have been exploring enhancements for years, with previous planning efforts taking place in 2004, 2010–2014, and 2021. In 2023, the City applied for and received a $25 million CDBG-DR grant and a $5 million NRDA grant to fund the first phase of park improvements, including stormwater upgrades. Additionally, the City applied for and received a $1.2 million TA grant to fund a multi-use trail. In the same year, Mayor Reeves commit-
opment Framework Plan to guide the development of the park and within a 1/2-mile radius of the park. The Equitable Development Plan planning process began in the summer of 2024, with the plan adopted by City Council in November 2024.
Community Feedback
The 335 responses gathered from a Community Equity Survey were used to inform the Equitable Development Values and Principles. Results from this survey as well as conversations with key stakeholders, such as the Friends of Hollice T. Williams Park group and nearby neighborhood associations, helped to establish the following top ten priorities:
• Be welcoming and safe to everyone;
• Meet the needs of all ages and abilities;
• Include community members in the decision-making process;
"The community should have an active role in shaping the future"
• Create comfortable gathering spaces;
• Create jobs for local residents;
• Address and prevent flooding;
• Provide programming for children and adults;
• Celebrate local history and culture;
• Create affordable housing;
• Allow community members to help guide, program, and manage park use.
Implementation & Next Steps
The Equitable Development Framework Plan defined the high-level values and principles that should guide the design of the Hollice T. Williams Stormwater Park and the development of public and private projects within a 1/2-mile radius of the park.
As per this plan, the next steps should include the commission of a more detailed set of recommendations, supported by a consensus negotiation process that involves elected and appointed officials, community leaders, and other key stakeholders. A Step 2 document should outline the policies that the City is committed to putting in place to ensure the negative impacts (like increasing rents and home prices) are minimized and development is inclusive to everyone, especially long-time residents and businesses.
HAYNE STREET IMPROVEMENTS

About the Special Demonstration Project
Hayne Street has been identified by the community as a primary pedestrian, bicycle, and vehicle connection in the Eastside CRA. Today, Hayne Street is a northbound one-way street with an unprotected bike lane paralleling Hollice T. Williams Park, which recently received funding to build a wide, shaded multi-use path for pedestrians and bicyclists.
Recently, the City of Pensacola studied improvements to Hayne Street, specifically to improve the pedestrian and bicycle experience in relationship to Hollice T. Williams Park. Those improvements could include:
• Narrowing car travel lanes;
• Converting to narrower, two-way travel to provide better connections to the park;
• Adding on-street parking along the edge of Hollice T. Williams Park for public parking;
• Removing the on-street bicycle lane and revising signage to encourage bicyclists onto the multi-use path within the park;
• Locate gateway opportunity areas that align with major amenities in the park.
"Encourage a road diet with wider green spaces along the street"
"Make streets safer for pedestrians and bicyclists"
Hayne Street
Hollice t. Williams Park

TOMORROW

Community Feedback
Eastside residents rated Hayne Street as a high-priority pedestrian/ bicycle connection, specifically in relationship to Hollice T. Williams Park. Most agreed that shade, landscaping, and protected bicycle routes were top priorities, so shifting the bike lane on Hayne Street to the park multi-use path was well-received.
Implementation & Next Steps
The CRA should conduct further studies regarding the two-way conversion of Hayne Street for implementation in the long-term. The CRA could hold a design competition for artistic park gateways at the Gonzalez and Hayne Street intersection and other important intersections that could be considered entrances to Hollice T. Williams Park.


RELATED POLICY RECOMMENDATIONS
ECONOMIC DEVELOPMENT
• Ensure that neighborhood organizations and residents are aware of job and business opportunities that arise from investment coming into the neighborhood around Hollice T. Williams Park
NEIGHBORHOOD DEVELOPMENT
• Work with Escambia County to execute joint projects such as streetscape improvements
• Pursue grants for neighborhood capacity building, and update to the neighborhood plan, and additional neighborhood identity, placemaking, and branding
HOUSING
• Offer the RPIP program along Hayne Street
• Partner with Community Land Trust(s), such as the Northwest Florida CLT, to acquire and develop infill housing on vacant lots, focusing along Hayne Street
TRANSPORTATION, STREETS, AND PARKING
• Transform Hayne Street into a slower-moving two-way street with wider, shaded sidewalks
• Improve east-west walking and biking connections to Hollice T. Williams Park along Gonzalez, Blount, Jordan, and Maxwell Streets
• Explore curb management plans and develop revised parking requirements for infill projects
• Underground utilities on Hayne Street
OPEN SPACE AND COMMUNITY AMENITIES
• Prioritize tree canopy along streets to provide shade and make Eastside more walkable
• Recommend that the City address stormwater and drainage issues on Eastside streets
Examples of artistic gateways
DR. MLK JR DRIVE AND N DAVIS HIGHWAY STREETSCAPES

Dr. MLK Jr. Drive
Davis Highway Dr. MLK Jr. Drive
"Add/improve bike lanes with protection from moving cars"
"Add green along the streets and narrow the travel lanes"

About the Special Demonstration Project
Dr. Martin Luther King, Jr. Drive and North Davis Highway are two of the primary north-south connections in the Eastside. Today, both are oneway streets, with Dr. MLK Jr. Drive carrying traffic south towards the Urban Core CRA District and N. Davis Highway carrying traffic north out of the city. Both streets lack consistent crosswalks and shade; additionally, speeding is a major safety issue.
The restoration of Dr. Martin Luther King, Jr. Drive and N Davis Highway to two-way streets has been identified as a priority in the TPO. These plans are underway and require coordina-

tion between the City of Pensacola and the Florida Department of Transportation as the roads are currently on the State Road system (S.R. 291).
Community Feedback
Although Eastside residents were overwhelmingly concerned with the safety of drivers, cyclists, and pedestrians on these streets, most prefer improvements to landscape and beautification as opposed to a twoway conversion. Most residents were in favor of improvements including:
• Wider sidewalks with shade;
• Enhanced landscaping;
• Curb bump-outs added to the corners of blocks to shorten pedestrian crosswalks and provide space for landscaping;
• Street lights, banners, signage, and other street furniture additions along priority streets.
Implementation & Next Steps
The CRA should continue to explore and potentially test streetscape improvements on both Dr. MLK Jr. Drive and North Davis Highway, primarily focused on creating safe, beautiful, and comfortable streets.
The CRA should explore the ability to partner with the City and FDOT to implement near-term improvements to the bicycle and pedestrian infrastructure along these two corridors as phased approach towards the two-way restoration of the one-way pair. Eastside community members agree that later phases of improvement should focus on the core of the district, specifically between Scott and Mallory Streets.


Potential stand-alone streetscape improvements such as the ones listed below may considered:
• Paint and install vertical elements to enhance separation of bicycle lanes;
• Add striping to on-street parking to maximize opportunity for temporary streetscape improvements and provide clearly defined zones that adhere to sight triangles;
• Adding high-visibility crosswalks to key east-west intersections that connect to Magee Field and Hollice T. Williams Park;
• Prioritize reconstruction of sidewalks where hazardous conditions exist along the corridor;
• Add landscaping to planting strips;
• Paint new bicycle lanes on the west side of Dr. Martin Luther King, Jr. Drive.
Examples of pedestrian- and bicyclist-friendly streets
"Underground the utilities and power lines"
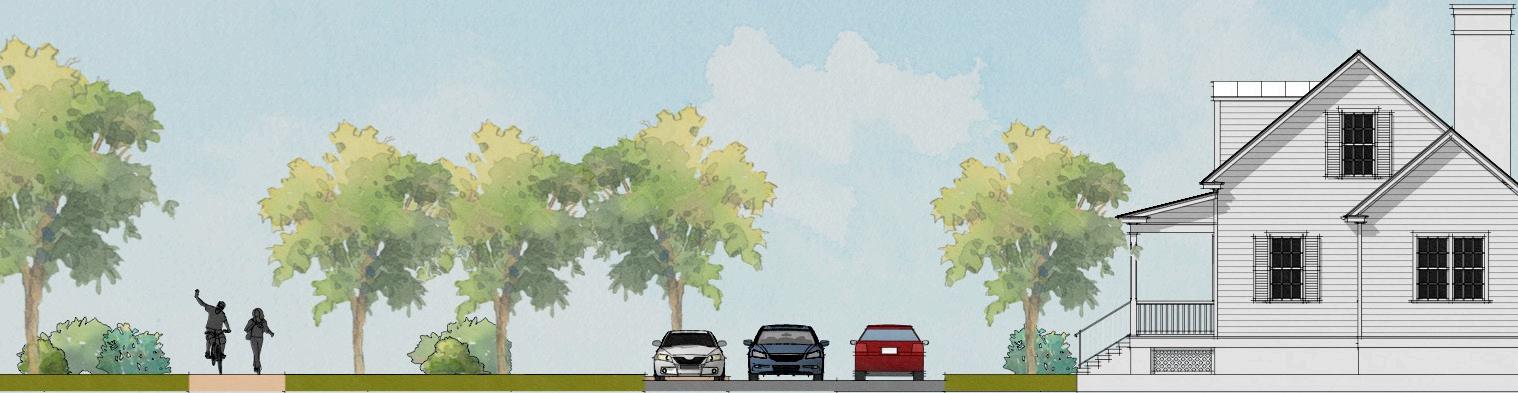
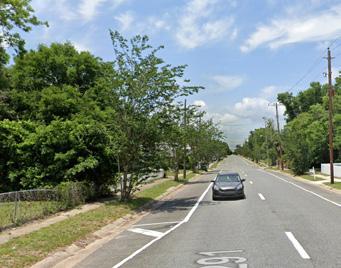
Dr. MLK Jr. Drive: TODAY

Dr. MLK Jr. Drive: TOMORROW
Streetscape improvements on Dr. MLK Jr. Drive could include undergrounding utility lines, adding landscaped curb bump-outs at the corners of blocks, adding street lights and banners, and increasing the width of sidewalks.

N Davis Highway: TODAY

N Davis Highway: TOMORROW
Streetscape improvements on N Davis Highway could include undergrounding utility lines, switching the on-street parking to the southbound side of the street, creating a protected northbound bike lane, adding landscaped curb bump-outs at the corners of blocks, and adding street lights and banners.

Additional recommendations may include other long-term efforts such as:
• Provide guidance, based on plan goals and principles, for the design for the restoration of Dr. Martin Luther King, Jr. Drive and N Davis Highway from one-way streets to two-way streets;
• Assist property owners to buy trees to plant on private property to supplement street tree canopy where it is not possible to plant within the public right-of-way;
• Advocate for underground utilities where possible;
• Advocate for transfer of jurisdictional maintenance for either Dr. Martin Luther King, Jr. Drive or N Davis Highway. from FDOT to the City;
• Fund wayfinding master plan for the Eastside and specifically along these corridors that celebrate the history and culture of the neighborhood along these streets.
RELATED POLICY RECOMMENDATIONS
LAND USE, ZONING, AND SPECIAL DISTRICTS
• Refine the minimum lot sizes for development in this area, considering that the blocks do not have alleys and many lots are currently too narrow for on-lot parking, which increases the demand for on-street parking in Eastside
NEIGHBORHOOD DEVELOPMENT
• Work with Escambia County to execute joint projects such as streetscape improvements
• Pursue grants for neighborhood capacity building, and update to the neighborhood plan, and additional neighborhood identity, placemaking, and branding
TRANSPORTATION, STREETS, AND PARKING
Do you think these concepts would improve safety on Dr. MLK Jr. Drive?
Do you think these concepts would improve safety on N Davis Highway?
• Transform Dr. MLK, Jr. Drive and N Davis Highway into slower-moving two-way streets with wider, shaded sidewalks
• Transfer ownership of Dr. MLK, Jr. Drive and N Davis Highway to city ownership
• Improve east-west walking and biking connections to Hollice T. Williams Park along E Jordan Street
• Underground utilities on Dr. MLK, Jr. Drive and N Davis Highway
OPEN SPACE AND COMMUNITY AMENITIES
• Prioritize tree canopy along streets to provide shade and make Eastside more walkable
• Recommend that the City address stormwater and drainage issues on Eastside streets
SPECIAL DEMONSTRATION PROJECT
GONZALEZ STREET SHAREWAY
About the Special Demonstration Project
Gonzalez Street has been identified by the community as one of the main pedestrian, bicycle, and vehicle connections in the Eastside CRA. Gonzalez Street is a wide, unmarked two-way street with inconsistent sidewalks and minimal landscape or shade. Intersections along the street are wide, unclear, and inconsistent with signage and direction.
Because this street is important for connection throughout the neighborhood and beyond, intersections along Gonzalez Street should be enhanced. By reserving stop signs to the north-south paths of travel crossing Gonzalez Street between 9th Avenue to Palafox Street, Gonzalez Street becomes a thoroughfare with continuous traffic lanes. Landscaped, slightly-raised planters at each intersection calms traffic, while allowing for bicyclists to have a continual, unobstructed path of travel along Gonzalez Street. The plantings in the center of the intersections would not obstruct views, but slow down car traffic, making the streets safer for pedestrians and bicyclists.
These interventions can be done one intersection at a time, allowing for an incremental and economical improvement plan. A phasing plan should be developed to firstly target the intersections of Gonzalez Street at Hayne Street, Dr. MLK Jr. Drive, and N Davis Highway, as they have
"Gonzalez is very dangerous"

Lee St
Lloyd St
Brainerd St De Soto St 9th Ave I-110
gonzalez Street Shareway
Strong St
Cervantes St
high connectivity south to the Urban Core CRA District and will incentivize further intersection improvements headed west toward Palafox Street and east toward 9th Avenue.
In addition to (or in lieu of) the intersection adjustments, other enhancements could be made to improve the pedestrian and bicycling safety and comfort along Gonzalez Street. Those could include:
• Narrowing car travel lanes to encourage slower driving speeds;
• Wider planting strips to accommodate landscaping that provides shade and protection;
• Creating a gateway element (signage, special paving, public art, etc.) at the Hollice T. Williams Park intersection at Hayne Street;
• Undergrounding utility lines.
Community Feedback
Eastside residents rated Gonzalez Street as a high-priority pedestrian/bicycle connection. Additionally, most agreed that shade and landscaping were top priorities.
Implementation & Next Steps
The CRA should conduct a phasing plan to improve the intersections along Gonzalez, starting simply with the relocation of stop signs and painted crosswalks, and continuing with the implementation of raised planters at each of the identified intersections between Palafox Street and 9th Avenue (shown in Option 1). Further street improvements along Gonzalez between the intersections should be considered (shown in Option 2).
Option 1: Intersection Reconfiguration

Painted Crosswalks
Example of typical intersection improvements
Reconfigured Stop Signs
Landscaped Planter
Reconfigured Stop Signs
"Gonzalez & MLK is the worst intersection" "Gonzalez Street should be a priority for bikes"
First Phase

gonzalez St
The first phase should start with intersection improvements along Gonzalez Street at the intersections at Hayne Street, Dr MLK Jr Drive, and Davis Street
Hollice t Williams Park
Option 2: Basic Street Improvements

Basic street improvements include narrowing travel lanes, implementing trees along the street for shade, undergrounding the power lines, and creating a multi-use path along the north side of Gonzalez Street.

"Sidewalks need to be replaced and/or maintained"

Right-of-Way
Curb-to-Curb
Gonzalez Street: TODAY
Gonzalez Street: TOMORROW
Gonzalez Street today
Curb-to-Curb Right-of-Way
Sharrow/Travel Sharrow/Travel Park Strip Park Strip Sidewalk
Multi-use Path 20' 0"


RELATED POLICY RECOMMENDATIONS
LAND USE, ZONING, AND SPECIAL DISTRICTS
• Refine the minimum lot sizes for development to prevent front-loaded garages along the future Gonzalez shareway, considering that the blocks do not have alleys and many lots are currently too narrow for on-lot parking
• Refine the minimum lot sizes for development in this area, considering that the blocks do not have alleys and many lots are currently too narrow for on-lot parking, which increases the demand for on-street parking in Eastside
NEIGHBORHOOD DEVELOPMENT
• Work with Escambia County to execute joint projects such as streetscape improvements
• Pursue grants for neighborhood capacity building, and update to the neighborhood plan, and additional neighborhood identity, placemaking, and branding


HOUSING
• Offer the RPIP program for owners along Gonzalez Street
• Partner with Community Land Trust(s), such as the Northwest Florida CLT, to acquire and develop infill housing on vacant lots, focusing along Gonzalez Street
• Develop pre-approved building plans
• Develop high-quality affordable housing that is affordable to existing residents of the neighborhood (both rental and homeownership)
TRANSPORTATION, STREETS, AND PARKING
• Transform Hayne Street into a slower-moving twoway street with wider, shaded sidewalks
• Improve east-west walking and biking connections to Hollice T. Williams Park along Gonzalez, Blount, Jordan, and Maxwell Streets
• Explore curb management plans and develop revised parking requirements for infill projects
• Underground utilities on Hayne Street
OPEN SPACE AND COMMUNITY AMENITIES
• Prioritize tree canopy along streets to provide shade and make Eastside more walkable
• Recommend that the City address stormwater and drainage issues on Eastside streets
Examples of mini traffic circles with plantings
LAND USE, ZONING, AND SPECIAL DISTRICTS


The Land Use, Zoning, and Special Districts category includes recommendations that entail adoption of policies or development of guidelines, standards, or tools. These recommendations form the regulatory framework to allow the other recommendations and projects to take place. Examples of recommendations in the Land Use, Zoning, and Special Districts category include:
• Design and Form Standards;
• Design Review Processes;
• Recommendations to explore changes to zoning districts, minimum lot sizes, density, and land use adjacencies in the City's Land Development Code (LDC);
• Updates to special or aesthetic review districts, including the CRA Urban Design Overlay District (CRAUDOD).
The policy recommendations emerged as important through the CRA Plan Update process, through a combination of community input and suggestions, conversations with CRA and City staff about challenges of the current development review and approvals process, and relevant recommendations from the previous plans. Some recommendations are location-based, while others are global and applicable to the whole district.
The Land Use, Zoning, and Special Districts policy recommendations, like the Special Demonstration Projects, are intended to provide examples of appropriate CRA projects. However, policies are not limited to those listed. The policies included are not listed in order or priority. The CRA will use the evaluation tools in the Implementation chapter to prioritize projects and match projects to available funding.
RECOMMENDATIONS
1. Design and Form Standards for CRA-Funded Projects
Develop a single set of design and form standards and a design review process for any projects in the CRA Districts receiving CRA funding. The Form and Design standards can be opt-in from a regulatory standpoint, and participation in the design review process should be a condition for any projects receiving CRA funding. In addition to the topics already covered in the Urban Design Overlay, these expanded standards should also address the design of renovation projects and the appropriateness of architectural character. This tool should ensure that CRA investment in neighborhoods doesn't compromise or detract from historic character.
2. Adjacent Use Considerations
• Explore the compatibility of adjacent uses in more detail through the Neighborhood Plan process.
• Consider additional strategies to minimize impacts of commercial areas on residential neighborhoods.
3. Upzoning for Higher Density Housing and Mixed-Use
• Explore opportunities to upzone for higher density housing and mixed-use, in particular along higher visibility corridors.
• Balance the recommendations for upzoning for higher density housing and the protection of residential character.
4. Minimum Lot Sizes
• Work with the Planning and Zoning Department to conduct a survey of lot sizes and development trends in the district to determine where conflicts are occurring.
• Update the LDC and Comprehensive Plan accordingly.


Examples of neighborhood-scale adaptive reuse Google
OVERVIEW OF REGULATORY AND
NON-REGULATORY
STANDARDS
ADDITIONAL DESIGN & FORM STANDARDS FOR CRA-FUNDED PROJECTS
Write and adopt design standards for CRA-funded projects that would further improve urban form.
• Include guidelines for preserving architectural character (scale, composition, etc.)
• Because these standards would not be adopted as part of the Land Development Code, they could be updated iteratively to respond to project needs
• Administer through the CRA's internal plan review & work with owners and developers
URBAN DESIGN OVERLAY DISTRICT (CRAUDOD)
What it Currently Covers
• New construction only
• Maximum building height
• Minimum floor-to-floor heights
• Roof pitches
• Frontages percentages, facade types, and entrance locations
• Facade composition standards
• Location and screening of service and mechanical equipment
• Setbacks (in particular ensuring they respond to their context)
• Lot width & coverage
• Parking
Additions to the CRAUDOD that Would Further Improve Urban Form:
• Expand the CRAUDO to apply to renovations
• Address architectural character, scale, and composition
• Address the location of parking


Map of the Eastside CRA District
Map of the Urban Design Overlay District in the Eastside
5. Adaptive Reuse
Neighborhood-serving commercial is a desirable complementary use within residential neighborhoods. The scale, design, and servicing of these non-residential uses must be carefully designed to reduce any negative impacts on neighborhoods. Both commercial and residential buildings can be adaptively reused to house neighborhood offices, small-scale retail specialty shops, and other similar uses. These projects may not be allowed under current zoning regulations. CRA funding should support projects of this nature in areas supported by the community, in particular along commercial corridors or in historic commercial nodes (such as at N Davis Highway and DeSoto Street).
6. Protect Residential Character
In areas that are primarily residential, support the preservation and protection of residential character.
7. Update the CRA Urban Design Overlay District (CRAUDOD)
• Expand the CRAUDOD to apply to renovations, building in regulations that renovations and rehabilitation projects do not worsen non-conformities with the Urban Design Overlay.
• Add standards to address architectural character, scale, composition, and the location of parking.
• For areas not currently covered by any special or aesthetic review district, expand the CRAUDOD to include.
8. Incorporate Neighborhood-Serving Retail
The goal is to allow more neighborhood-serving commercial/retail in places where it makes sense. Through the neighborhood planning, process, the community should develop a plan, identifying specific corridors and nodes that are desirable locations for neighborhood-serving retail. Future updates to the LDC and Comprehensive Plan should reflect these recommendations.


SPECIAL DISTRICTS & UDOD
Where guidance and standards are provided on architectural scale, options should be provided to allow flexibility to meet the intent of the standards through comparable or similar design strategies and materials. The focus should be on building and parking siting, simple massing, appropriate scale, facade composition, and other strategies that improve design without adding cost.

9. CRA Boundary Expansion
The Eastside CRA is the smallest of the CRA districts, and it generates the least TIF funding, limiting the impact that the CRA investment has in the district. This has reinforced a self-fulfilling pattern: an area that has historically been disinvested in receives less investment year-over-year compared to other districts. The Eastside Neighborhood Association supports the expansion of the Eastside CRA boundary to the east, west, and north. An expanded boundary would generate more TIF revenue, which could be reinvested back into the district. The CRA should conduct a Necessity of Finding to explore potential boundary expansions for all of the CRA Districts and engage the community in the process to determine which areas should be expanded, depending on compliance with the statute and demographic analysis. The boundary shown is a prospective boundary that may be modified with further data analysis and community input.
Potential CRA District Boundary Expansion
City of Pensacola Boundary
Urban Core CRA District Boundary
Eastside CRA District Boundary
Westside CRA District Boundary
CRA expansion areas to be explored through a Necessity of Finding
Potential Boundary Expansion proposed by the Eastside Neighborhood Association
Pensacola Bay


DESIGNING FOR SAFETY AND COMFORT
In Public Square, the journal for the Congress of New Urbanism, Robert Steuteville writes about necessary elements to create spaces that feel safe and comfortable. Quoting noted architect and urban designer Ray Gindroz, Steuteville outlines the following seven qualities:
HUMAN PRESENCE
People in a public space must feel the presence of other people in the space and in the buildings surrounding the space. The sense that we are not alone and are being observed helps us to behave properly and feel safe. Windows are symbols of that presence, whether people are behind them or not. Mixed-use buildings help promote 24-hour presence.
CONGENIALITY
The dimensions and scale of the space should encourage comfortable interactions among people.
HUMANE PROTECTION
Mechanical devices such as cameras and gates should be invisible. Where possible, police presence should be personal, on foot or bicycle, so police officers can interact with others.
VISIBILITY, LIGHT, AND OPENNESS
Open views that enable us to see other people and to be seen—by people driving by, as well as by others in the space— provide natural supervision. Light should ensure nighttime visibility.
ORDER
Coherent landscapes, streetscapes, and signs in both the public rights-of-way and bordering properties make a clear statement that a space is well-managed and safe.
CONNECTIONS
Spaces must be perceived as part of an interconnected network of streets and public open space, so we feel we have access to others who make the space safe.
LEGIBILITY
The clarity with which each space connects to the rest of the city helps us understand the form of the city and keeps us from feeling lost.
MiguelMalo
Aleksandr Vorobev
Fly View Productions
ECONOMIC DEVELOPMENT
The Economic Development category includes recommendations that would bring commercial and mixed-uses to the districts, add jobs, and build support for businesses. Examples of recommendations in the Economic Development category include:
• Mixed-use and commercial infill development;
• Incubators and employment uses;
• Building strategic partnerships;
• Commercial property improvement programs;
• Partnering to support small businesses and workforce development.
The policy recommendations emerged as important through the CRA Plan Update process, through a combination of community input and suggestions, conversations with CRA and City staff about challenges of the current development review and approvals process, and relevant recommendations from the previous plans. Some recommendations are location-based, while others are global and applicable to the whole district.
The Economic Development policy recommendations, like the Special Demonstration Projects, are intended to provide examples of appropriate CRA projects. However, policies are not limited to those listed. The policies included are not listed in order or priority. The CRA will use the evaluation tools in the Implementation chapter to prioritize projects and match projects to available funding.


Mikael Blomkvist
Alvarez
RECOMMENDATIONS
1. Commercial Property Improvement Program (CPIP)
• Recommend that the CPIP program be expanded to this district.
• Explore incentives that close gaps for private developers and property owners to make improvements.
2. Neighborhood Commercial Nodes
• Support the development of small neighborhood-scale retail nodes through the construction of single-story retail buildings or the conversion of houses into small-scale restaurants and shops. Neighborhood commercial should be located along higher visibility/traffic corridors, or at nodes that have historically had commercial uses. Some of these locations include along De Soto and Blount Streets. Another area may include sites along Dr. Martin Luther King, Jr. Drive and N Davis Highway, specifically between Scott Street and Mallory Street.
• Prioritize these nodes for the Commercial Property Improvement Program (CPIP), once expanded to this district.
• Ensure that neighborhood nodes are not zones for multi-story or vertical mixeduse buildings that would disrupt the scale and character of the neighborhood.
3. Workforce Development and Skills Training
• Partner with local organizations that coordinate workforce training opportunities and support for entrepreneurs and small businesses.
• Connect these opportunities and programs to places neighborhood residents already frequent (community centers, libraries, etc.).
• Ensure that neighborhood organizations and residents are aware of job and business opportunities that arise from investment coming into the neighborhood, especially around Hollice T. Williams Park and as part of the Crystal Ice House Market.
• Partner with developer(s) and/or local organization(s) to create spaces for small local businesses and entrepreneurs to lease and operate.
4. Relationship with Escambia County School District
• Continue to build a relationship between the Escambia County School District and the CRA.
• Provide constructive input into planning for future school sites and the redevelopment of any surplus school district-owned property.


Land owned by the Escambia County School District in the Eastside CRA District
Neighborhood grocery store in Eastside
5. Partnership with Escambia County
Work with Escambia County to execute joint projects, such as streetscape improvements or design guidelines, and coordinate with ongoing plans.
6. Strategic Development Support and Incentives
• Motivate private investments where the return on investment is currently too low relative to competition from other regions. Consider a broad array of incentive tools - in addition to fiscal tools, consider zoning policies, land contribution, and permitting and regulatory relief as part of the toolkit.
• Tie the applicants’ qualifying criteria to Key Performance Indicators (KPIs) aligned with key policy goals and the City’s Strategic Plan.
• Conduct cost-benefit analysis to determine the programs’ fiscal impact.
• Consider a phased approach to test the programs in specific high-priority areas before expanding their application.
• Consider combining guidance on community benefits agreement with incentive design to ensure fairness and preempt gentrification concerns.
• Leverage state and federal programs to maximize the impact of local programs.
7. Community Benefits Guideline
• Consider establishing a standardized process and framework of structuring Community Benefits Agreements for redevelopment projects. Ensure fair and predictable outcomes for the community, the City, and the private developers and investors.
• Pay special attention to potential redevelopments around the Hollice T. Williams Park.

fauxels
THIS PAGE INTENTIONALLY LEFT BLANK
NEIGHBORHOOD DEVELOPMENT
The Neighborhood Development category includes recommendations that would build neighborhood organization capacity, preserve cultural landmarks and historic buildings, and create branded destinations. Examples of recommendations in the Neighborhood Development category include:
• Neighborhood identity and wayfinding;
• Neighborhood capacity building;
• Corridor development;
• Development of entertainment destinations;
• Community policing strategies.
The policy recommendations emerged as important through the CRA Plan Update process, through a combination of community input and suggestions, conversations with CRA and City staff about challenges of the current development review and approvals process, and relevant recommendations from the previous plans. Some recommendations are location-based, while others are global and applicable to the whole district.
The Neighborhood Development policy recommendations, like the Special Demonstration Projects, are intended to provide examples of appropriate CRA projects. However, policies are not limited to those listed. The policies included are not listed in order or priority. The CRA will use the evaluation tools in the Implementation chapter to prioritize projects and match projects to available funding.


Community destinations in the Eastside
RECOMMENDATIONS
1. Neighborhood Capacity Building
• Secure grants to support and help the neighborhood organization build capacity.
• Identify resources that the neighborhood organization can connect to (such as non-profit development courses at Pensacola State College, Neighborworks, etc.).
2. Develop Neighborhood-Specific Plans
Fund and support the development of neighborhood plans that define projects and activities that are most important to the neighborhood. The CRA and City should define the topics appropriate for neighborhood plans (such as increases in density, locations for mixed-use, lot sizes, and considerations about adjacent uses). The City and CRA should also help to identify implementation activities that would be the responsibility of the neighborhood and those that would be led by the City, CRA, or partner organizations.
3. Neighborhood Identity and Wayfinding
• Fund efforts to support neighborhoods in developing unique identity, branding, and wayfinding for individual neighborhoods, areas of cultural significance, and special districts. These efforts can be used to reinforce sense of place and distinguish neighborhoods and special districts from one another.
• Fund the installation of branded neighborhood gateway signs, banners, and other placemaking elements.
• Rather than marking and defining the edges of CRA Districts, placemaking signage should be used to indicate centers and places people gravitate toward. Identity signage should focus on places like Hollice T. Williams Park, the Crystal Ice House Market, Magee Field, and other cultural landmarks or community destinations.
4. Revitalize Cultural Landmarks and Historic Buildings
Offer incentives and support projects that preserve and celebrate cultural destinations and preserve historic buildings, like the H&O Cafe. Look for viable uses to adaptively reuse important buildings in the neighborhood.


Signage based on local destinations
Public art establishes a theme
5. Community Safety Fund programs that enhance community safety in the CRA District, reducing minor and violent crimes. Making places feel safe will encourage further investment and new residents moving into the district. Community policing strategies may include:
• Funding increased patrols in the CRA District;
• Working with the police department to employ community policing best practices (bicycle patrols, community outreach events, etc.);
• Funding violence prevention programs, such as park or community ambassadors or outreach team members.

LEARNING FROM SAFE COMMUNITIES
BUILDING RELATIONSHIPS
Police should work with community members to build trust and rapport. This can lead to more people reporting crimes and providing information.
TRANSPARENCY
Police should be open about their policies and procedures, and how they operate. This can help build trust and accountability.
PROACTIVELY SOLVING PROBLEMS
Police should work with the community to identify and address the underlying causes of public safety issues.
EMBEDDING COMMUNITY ENGAGEMENT
Community engagement should be a core part of an agency's culture. When people trust the police, they are more likely to follow the law and help create a safer community.
WHAT ARE EXAMPLES OF COMMUNITY VIOLENCE INTERRUPTION (CVI) INITIATIVES?
• Violence interrupter programs, which use peace-building approaches to stop violence before it occurs by placing ambassadors on the street who can de-escalate conflict, provide mediation, and build supportive relationships with those at highest risk of experiencing violence.
• Programs to reduce gang-related affiliation and connect at-risk young people to employment and economic opportunities.
Brett Sayles
THIS PAGE INTENTIONALLY LEFT BLANK
HOUSING
The Housing policy category includes recommendations that will increase the options for housing in the district, including rental and homeownership and a range of housing types and affordability. Examples of recommendations in the Housing category include:
• Providing incentives for developers to build affordable housing;
• Working with developers to improve the quality of proposed housing design;
• Developing pre-approved building plans;
• Acquiring land for infill housing;
• Substantial rehabilitation of existing housing;
• Residential property improvement programs;
• Supporting first-time homebuyers;
• Large-scale mixed-use, mixed-income housing development.
The policy recommendations emerged as important through the CRA Plan Update process, through a combination of community input and suggestions, conversations with CRA and City staff about challenges of the current development review and approvals process, and relevant recommendations from the previous plans. Some recommendations are location-based, while others are global and applicable to the whole district.
The Housing policy recommendations, like the Special Demonstration Projects, are intended to provide examples of appropriate CRA projects. However, policies are not limited to those listed. The policies included are not listed in order or priority. The CRA will use the evaluation tools in the Implementation chapter to prioritize projects and match projects to available funding.


RECOMMENDATIONS
1. Residential Property Improvement Project (RPIP)
Continue offering property improvement programs, such as RPIP and the Resiliency program, to preserve and create affordable housing units.
2. Demolition and Reconstruction Funding Program
• Develop a companion program to the RPIP for substantial demolition and reconstruction (for primary structures and ADUs, rehabilitated or new construction). This could be accessed by both owners as well as developers to facilitate infill in the districts.
• Applicants would need to demonstrate that preservation wasn't feasible.
• The CRA should conduct a study of contributing structures to historic character in neighborhoods to ensure that significant buildings are not demolished as part of this program.
3. CRA-Led Infill Development
• Acquire lots for infill development.
• Help fund the construction of new housing, partnering with organizations such as the Homebuilders Association to keep costs as low as possible.
• Facilitate land swaps to locate the highest and best uses along key corridors.
4. Partnership with Community Land Trusts for Infill Development
• Acquire lots for infill development and convey to Community Land Trust(s), such as the Northwest Florida Community Land Trust. Reference Escambia County's escheated property list to target lots for potential acquisition.
• Help fund the construction of new infill housing, partnering with organizations such as the Homebuilders Association to keep costs as low as possible.
• Facilitate land swaps to locate the highest and best uses along key corridors.
5. Pre-Approved Building Plans
Continue to develop a selection of pre-approved building plans, especially for narrow 30-foot infill lots, and establish a program where potential homebuyers can apply to use these plans. Partnering with a local builder experienced in this building type should be explored to help implement this program.
6. First-Time Homebuyers
• Identify barriers that may keep residents from using the first-time homebuyers programs provided by the City and the county.
• Connect potential first-time homebuyers to financial incentives.
• Explore strategies for increasing homeownership.

Minor cosmetic upgrades include painting and small repairs

LEARNING FROM GREAT NEIGHBORHOODS
Require affordable housing projects receiving CRA funding to meet general design standards, including the principles of good design described below.
BUILDINGS FRONT PUBLIC AREAS
If a development does not include public streets, parking drive aisles should be designed with enhancements to make them "street-like," i.e. with shade trees, non-circuitous sidewalks, street furniture such as benches, trash receptacles, and street lights.
ACCESS
Convenient access to public transit, walking/bike trails, and amenities enhances access to opportunities for employment, education, and cultural experiences.
NEIGHBORHOOD-SCALE STREETS AND BLOCKS
Development should be organized into blocks that are less than 3 acres each to create a walkable community. Streets should create an interconnected grid, with comfortable, shaded sidewalks.


FRONTS AND BACKS
Buildings should have discernible fronts and backs. Front facades should face other front facades and rears of buildings should face other rear facades.
PERIMETER FRONTAGE
Fronts of buildings should face publicly accessible streets (or parking lot drive aisles designed to be "street-like") or greenways. Service areas, off-street parking, and semi-private outdoor space should be located in the center of blocks or in the rear of buildings.
DIVERSE BUILDING TYPES
The objective is to build new homes in new or extended neighborhoods. A range of building types and architectural designs are required to move from building a development or apartment complex (typically with one or two repeating building designs) to a neighborhood.
MIXED-INCOME
If possible, affordable projects should aim to serve a range of incomes by offering a range of unit types and sizes, or by building in long-term affordability through subsidy for a portion of the units.
HUMAN-SCALE BUILDING ELEMENTS
Architectural elements including porches, stoops, awnings, balconies, and other elements are necessary to create places where people can interact and enjoy outdoor space. The scale of buildings should be consistent with the surrounding neighborhood.
ACCESSIBLE AMENITIES
The development has a diverse range of indoor and outdoor amenities, including small parks for children, indoor community gathering space, fitness amenities, etc.
QUALITY MATERIALS
Build affordable housing with high-quality, durable materials that are comparable in quality to moderate market-rate projects to ensure affordable projects will not be easily identified or stigmatized.
7. Affordable Housing Incentive
• Use incentive programs aligned with the principles and goals of the redevelopment plan to continue to fund affordable housing projects.
• Identify target areas for incentives, which may include affordable housing, infrastructure improvements, coordination with redevelopment project(s), floodproofing as a means to encourage certain uses, etc.
• Engage partners like the Northwest Florida Community Land Trust to develop high-quality affordable projects in the CRA Districts.
• Include supportive housing as part of the affordable housing incentive.
• Ensure that all affordable housing is designed to fit into the character of the surrounding area.
8. Small-Scale Affordable Housing Rental Program
Create an incentive program to create and preserve affordable missing middle rental housing. The CRA is restructuring the TIF Rebate Incentive program to offer greater flexibility and effectiveness in supporting redevelopment within the city's redevelopment areas. The updated program is designed to be more robust, enabling developers to access tailored incentives that better align with the unique needs of their projects. By introducing a more adaptable framework, the revised TIF Rebate program will provide a wider range of options, ensuring that developers receive timely support while fostering sustainable growth in key redevelopment zones. This revamped incentive structures aims to drive economic development and revitalization efforts across the city, enhancing the overall impact of the program.
9. Large-Scale Redevelopment Projects
• Ensure that there are authentic opportunities for community engagement and public participation.
• Select developers and design consultants that adhere to principles of good urban design (connected street grid, walkable block size, streets designed for pedestrians, mix of uses, dense and compact building types, access to transit, creation of public gathering spaces, etc.).
• Large-scale redevelopments must be broken into walkable block sizes with public streets or publicly-accessible private drives designed like public streets (with on-street parking and sidewalks).
10. Quality Multifamily Development
Use New Urbanist design principles in the design of multifamily housing developments. Incorporating language into the CRA's RFQs and RFPs specifying the selection of developers and/or design consultants who adhere to New Urbanist design principles will ensure alignment with best practices.
11. Sensitive and Flexible Design Standards
Rather than establishing new historic districts with rigid requirements that can be onerous to lower-income households, the CRA should develop expanded Design and Form Standards that are a requirement for all projects receiving CRA funding. These standards will be intended to protect the neighborhood scale and character, but will be administered by the CRA, allowing for collaboration and flexibility to work with homeowners to find solutions they can afford.

Increasing opportunities for homeownership is a priority Oleksandr
Pidvalnyi
TRANSPORTATION, STREETS, AND PARKING
Transportation investments are an essential component to achieving broader community goals. Streets, trees, sidewalks, bicycle lanes, public art, and parking spaces often make up the majority of the land area of communities and are the heart of the public realm. As a result, many economic development plans and community-oriented policies are contingent on their thoughtful alignment with transportation projects. Ensuring that residents feel safe and comfortable while walking, driving, biking, taking transit, using public amenities, and patronizing businesses is always an important factor for all great neighborhoods.
The transportation recommendations outlined in this section can be understood as adhering to the following three high-level goals:
• Accessibility Support the development of an integrated and connected multi-modal transportation system that focuses on improvements that prioritize people walking, biking, using transit, and people with disabilities, providing everyone the opportunity to reach destinations for employment, leisure, and essential services.
• Placemaking and Public Realm Design transportation projects and site design that preserves community identity and provides welcoming spaces for civic, social, and commercial activity.
• Safety Provide safe and comfortable streets to support healthy and vibrant communities while improving residents' quality of life and the overall walkability of the commercial core and neighborhoods.
The recommendations detailed in this section were shaped by community feedback and build on efforts undertaken by the CRA in previous plans, the City of Pensacola, and the Eastside community. Specifically, these recommendations are aligned with the Active Transportation Plan (ATP) adopted by the City in August 2023 and the 2000 Urban Infill and Redevelopment Plan, including its later amendments.
In the Eastside, transportation strategies are focused on establishing a neighborhood identity and strengthening connectivity to Magee Field and Hollice T. Williams Park through improvements to aesthetics and safety.
Recommendations contained in this section are intended to improve safety, connectivity, accessibility, and navigability for all users and are focused on improvements that support and further the special demonstration projects and that are focused on selective corridors for improvements. These corridors are generally identified as primary streets but may also include other key streets and intersections that provide important connectivity within the district.
ACTIVE TRANSPORTATION PLAN (ATP) – 2023
The goal of the ATP is to accommodate all community members and encourage alternative transportation modes outside of car travel. The plan is focused on filling gaps in the transportation network and linking key destinations such as schools, parks, and commercial areas. Three categories of pedestrian- and bicycle-focused infrastructure are established by a Future Network framework in the ATP:
• Neighborhood Greenways
• Bike Routes
• Trails
The Future Network design recommendations include using context-sensitive designs to make streets safer and more accessible based on their location (urban, suburban, etc.), using countermeasures to calm traffic, improve crossings, and/or expanding the bicycle network.
2000 URBAN INFILL AND REDEVELOPMENT AREA PLAN
Categorized by corridor enhancements, neighborhood aesthetics, and neighborhood infrastructure, the 2000 Urban Infill and Redevelopment Area Plan for the Eastside identified solutions for a variety of concerns that are still relevant today. Recognizing neighborhood boundaries, establishing neighborhood identity, and prioritizing pedestrian safety are primary goals that carry through in the following recommendations.
Primary
Primary
Secondary

Blount St Lee St
Hatton St Scott St
The goal of creating more safe, accessible, and aesthetically vibrant communities will take advocacy and partnerships across multiple agencies and city departments for transportation improvements that go above the baseline standards. Such improvements may not be routinely implemented currently but as part of a plan that has a 20- year horizon to improve inadequate infrastructure, these simple upgrades could have bigger placemaking impacts and address community needs while also setting the stage for economic and neighborhood development within the Eastside. Baars St Leonard
Not all recommendations listed are able to be directly undertaken by the CRA, there are various roles for the CRA to play in the implementation of these projects. Some of these roles are further defined in the implementation section of this plan. Recommendations which require the CRA to play more of an advocate role are provided separately as these may be broader and more general and scope or simply not within the CRA’s purview yet were identified as a need from community members throughout the engagement process of this plan update.
RECOMMENDATIONS
1. Curb Management Study
Fund a curb management study and create a plan to maximize opportunities for landscaping, dedicated bicycle lanes, and on-street parking along key corridors.
2. Low-Impact Design Standards
Promote low-impact design standards for use in corridor improvement projects and parking design standards to increase landscaping opportunities and provide stormwater mitigation where necessary.
3. Undergrounding Utilities
For all CRA-funded projects, advocate for the undergrounding of utilities as an investment that adds placemaking and resilience value.
4. Partnerships
Continue and strengthen partnerships with the Florida-Alabama Transportation Planning Organization (FL-AL TPO), the Florida Department of Transportation (FDOT), the Emerald Coast Regional Council (ECRC), and Escambia County Area Transit (ECAT) to integrate CRA projects into the transportation planning process.
5. Two-Way Conversions
Advocate for the two-way conversion of one-way streets to improve safety for drivers, bicyclists, and pedestrians.
6. Intersection and Sidewalk Improvements
The CRA should advocate for and consider funding further analysis for safety improvements that prioritize key intersections along Dr. Martin Luther King, Jr. Drive at E Maxwell St, E Jordan St, Blount Street, Lee Street, Avery St and E Cervantes St to prioritize pedestrian and cyclist connectivity. Additional funding towards countermeasures that go above the standard and are proven to increase safety and prioritize resident quality of life can provide improvements that are cost effective and timely. There are a variety of countermeasures to choose from such as installing leading pedestrian intervals at key intersections and other countermeasures identified in the ECRC Safety Action Plan (December 2024). Additional countermeasures could be explored.
7. Bus Shelter Improvements
Coordinate with ECAT to support bus shelter improvements along main transit lines.
8. Downtown Circulator
• Fund a feasibility study to explore the feasibility of establishing and operating a free downtown circulator.
• Project start-up and long-term operations costs.
• Quantify the economic impact.

THE CHALLENGE
The Eastside can feel like a pass through for getting in and out of the city. One-way streets like Dr. MLK Jr. Drive and N Davis Highway and access to Interstate 110 give priority to the movement of traffic rather than pedestrians and cyclists. There are several other challenges in the Eastside was voiced by community residents. These challenges are also a common occurrence in other districts. These include:
• Intersections that are unsafe for bike/ ped crossing
• Speeding vehicles
• Lack of maintenance on existing pedestrian flashing crosswalk lights
• Lack of pedestrian crosswalks
• Lack of maintenance on existing sidewalks
• Lack of protected space or roadways that accommodate pedestrians and bicycles and connect them across all districts and neighborhoods
• Vehicle dominated streets that make pedestrians and bicyclist feel unsafe
• Roadways that are the most unsafe or are barriers in districts are State roads
Planters and benches help manage curb use
Roberto Machado Noa

REDUCE SPEED LIMITS

WAYFINDING MEASURES
COUNTERMEASURES

REMOVE OBSTRUCTIONS

GATEWAY ENHANCEMENTS
A countermeasure is a safety improvement that is designed to prevent or offset an issue. While the CRA is not responsible for operation and maintenance of roadways, the CRA can be great partners and advocates for the implementation of such improvements that support and further the CRA’s mission and goals. In addition to advocacy for certain improvements, safety improvements should link to Emerald Coast Regional Council (ECRC) Safe Streets and Road for All (SS4A) Safety Action Plan (adopted Dec 2024). Countermeasures that could provide district-wide benefits may include:
REDUCE SPEED LIMITS
Setting speed limits that are appropriate for the surrounding environment helps enhance safety and further street design concepts that prioritize pedestrians and cyclists.

CROSSWALK DENSITY

IMPROVED BICYCLE LANES
REMOVE OBSTRUCTIONS
Eliminating obstructions that could block sightlines increases safety. Improvements could include measures such as painting curbs red at intersection entrances to prevent on-street parking, trimming overgrown plants, or relocating large signage at eye level.
CROSSWALK DENSITY
Increasing the number and frequency of crosswalks to the network maximizes connectivity for pedestrians and improves safety by providing multiple designated, marked crossing locations.
IMPROVED/RAISED CROSSWALKS
Increasing driver awareness of pedestrians is an important safety measure. Improvements can include installing high-visibility crosswalks, which could incorporate local artwork. Raised crosswalks are elevated a few inches above the road, typically at, or close to, the level of the sidewalk. This treatment not only improves safety but can also act to further define areas of interest through the use of pavers or other special materials.

IMPROVED OR RAISED CROSSWALKS

CURB RADIUS REDUCTION
WAYFINDING MEASURES
A network of signs highlighting nearby pedestrian and bicycle facilities helps guide users to crossing locations as well as cultural amenities.
GATEWAY ENHANCEMENTS
Gateway treatments and enhancements denote a change in context and can include signage, changes in scale or type of landscaping, structures, etc.
IMPROVED BICYCLE LANES
Separating bicycle lanes from other traffic (both cars and pedestrians) with physical barriers, pavement markings, and signage reduces points of conflict, which decreases crashes.
CURB RADIUS REDUCTION
Reducing the radii of curb corners forces drivers to make tighter turns, which typically translates into lower speeds. This also has the added benefit of reducing intersection crossing distances and increasing the visibility of pedestrians.

LEARNING FROM BEST PARKING PRACTICES
Parking plays a major role in an area's mobility. It can be an asset if thoughtfully located – supporting local businesses or meeting the needs of residents who may rely on on-street parking due to narrow residential parcels without driveways. But parking can be a liability when ineffective policies place a premium on parking demands; as a result, the pedestrian fabric of a community is eroded.
Requiring minimum parking standards and locating surface parking lots along street frontages lead to environments that are hostile to pedestrians. The heat island effects that are caused by large areas of asphalt without tree cover, underutilized
parcels, and a lack of street definition make a huge impact on the environment and to the quality of life for residents.
Across the three CRA districts, there are approximately 333 acres of paved surface parking areas. In the Eastside, there are 57 "Major Paved" areas for a total of 15 acres of paving.
PARKING GOALS
The goals of parking recommendations are to:
• Facilitate easy access to downtown while promoting transit and other modes of transportation while prioritizing a more walkable and bikeable environment.
• Coordinate parking locations – surface lots or structured – with transit, micro-transit, and micromobility hubs.
• Develop parking facilities that meet parking needs through a shared parking methodology.
• Minimize impact from parking on the public realm.
• Ensure that parking is safe and accessible to all.
• Retain residential on-street parking in a manner that allows for other community needs to be considered.
9. Parking Projects and Requirements
• Curb management plans can provide efficient allocation of space within the edge of the street to make sure parking, as well as other uses, such as bike lanes or loading areas, can also be accommodated.
• Quick-build pilot projects that either remove or add on-street parking can provide short-term improvements that allow residents and visitors to experience impacts before committing to large financial investments.
• Convert strategically located on-street parking spots (such as at corners or midblock) into landscape zones, parklets, pop-ups, etc.
• Residential garages should be placed in a manner that preserves building presence on the street and provide uninterrupted pedestrian facilities.
• All non-residential buildings and multi-family residential buildings should provide both short-term and long-term bicycle or other micromobility storage space.
• Develop revised parking requirements for infill projects that uses parking requirements from Urban Core CRA District commercial uses and further provides flexibility that are responsive to Eastside’s unique redevelopment challenges and consider such conditions as distance to transit stops and whether or not development is a rehabilitation of an existing structure.


LEARNING FROM LEADING PEDESTRIAN INTERVALS
Leading pedestrian intervals are traffic signal adjustments that give pedestrians a head start to cross the street. Typically, the walk signal for pedestrians is displayed three to seven seconds before vehicles are given a green light to proceed. This helps to bring drivers' awareness to the presence of pedestrians, reducing conflicts with turning vehicles and improving safety.
Crosswalks and other decorations on the street can improve streets' look and feel
Caleb Oquendo
OPEN SPACE AND COMMUNITY AMENITIES
The Open Space and Community Amenities policy category includes recommendations that enhance the quality of life within the district by increasing access to parks, trails, recreation, community centers, and other community destinations. Examples of recommendations in the Open Space and Community Amenities category include:
• Recommendations about specific parks or open spaces;
• Recommendations for new or improved community amenities;
• Qualities that the CRA should prioritize in proposed designs, such as natural habitats or tree canopy and shade;
• Participation in the City's upcoming Parks Master Plan;
• Celebration of places with historic and cultural significance in neighborhoods and special districts through public art;
• Requirements for developers to incorporate public art into their developments;
• Walking and bicycling connections to existing or future parks and destinations;
• Recommendations for community garden, improvements to cemeteries, and other neighborhood opens space.
The policy recommendations emerged as important through the CRA Plan Update process, through a combination of community input and suggestions, conversations with CRA and City staff about challenges of the current development review and approvals process, and relevant recommendations from the previous plans. Some recommendations are location-based, while others are global and applicable to the whole district.
The Open Space and Community Amenities policy recommendations, like the Special Demonstration Projects, are intended to provide examples of appropriate CRA projects. However, policies are not limited to those listed. The policies included are not listed in order or priority. The CRA will use the evaluation tools in the Implementation chapter to prioritize projects and match projects to available funding.


Nikodash
Sasiistock
RECOMMENDATIONS
1. Parks Master Plan
• Participate in the 2025 Parks Master Plan being conducted by the City Parks and Recreation Department.
• The plan should assess the existing conditions and amenities and make recommendations for enhancing existing amenities, increasing the usability of the existing open spaces and cemeteries, and transforming vacant lots into new neighborhood parks where needed.
• The planning process should engage residents, relying on community input to guide the amenities, designs, and programming of parks.
• Park designs should prioritize amenities and programming that match the desires and needs of surrounding demographics.
• All interventions in parks and public spaces should prioritize increasing shade, comfort, and usability.
• Neighborhood parks or publicly-accessible open space should be located within 1/4-mile of all neighborhood blocks.
• The CRA may explore the option to fund future specific park enhancements that relate to placemaking.
2. Art Requirement for New Development
• Require new development receiving CRA funding to meet a requirement to incorporate public art that celebrates the history, culture, or place.
• Projects would be identified, funded, and installed by private developers; also explore "in-lieu" options.
• The CRA and City should identify and help initiate a regional arts organization that would eventually facilitate the program.
3. Natural Habitats and Tree Canopies
Require the use of native plant species, the creation of natural habitats, and tree canopies to provide shade in CRA-funded projects.


LEARNING FROM THE PAST: CELEBRATE CULTURE AND HISTORY OF THE EASTSIDE
Follow the recommendations as outlined in the Equitable Development Framework Plan: Principle 6.
SUPPORT HISTORICAL RESEARCH
Invest in a dedicated historic preservation and documentation project to understand the various histories of the Lost Neighborhood at the neighborhoods surrounding Hollice T. Williams Park; incorporate and formalize the research that members of the Pensacola community have begun; include both formal histories as well as personal ones; allow for opportunities for residents to share photographs and oral histories.
CREATE THEMES


Develop a well-designed, interactive theme that weaves history and stories throughout the park that not only informs users about the history, but encourages them to interact with it (for example, 3D structures they can walk in and through, music-based exhibits, etc.)
ENCOURAGE DEVELOPER PARTICIPATION
Developers working within a 1/2-mile of the park should incorporate public art that honors the history of the neighborhood into their buildings and exterior spaces.
4. Community Facilities
Fund and build improvements to community facilities and programs, such as healthcare services, education, telehealth, community gathering space, a new senior center, a career learning lab, and cyber lounge.
Potential new locations for community facilities that should be studied include sites near Magee Field and/or infill sites along Dr. Martin Luther King, Jr. Drive and N Davis Highway.
5. Public Restrooms
Partner with the City to identify locations, establish standards for design and maintenance, and support the construction and maintenance of public restrooms in or near public parks and highly-trafficked areas. Some potential locations may include Hollice T. Williams Park, Magee Field, or near the Crystal Ice House Market.

Public restrooms can be added to parks, along streets, or in other public areas
1. Katharine A. Goldsmith R.N.
2. A.S. Magee Field
3. The Lost Neighborhood
4. Historic Crystal Ice House
5. Spencer Bibbs Academy
6. Hollice T. Williams Park
7. General Daniel "Chappie" James, Jr. Home and Memorial Gardens
8. E.S. Cobb Center
9. H&O Café
10. John Lee Pickens' Medical Office
11. John Sunday

Baars
Leonard
Fisher St Cross St Hatton St Scott St Yonge St Maxwell St Jordan St Hernandez St Lakeview Ave
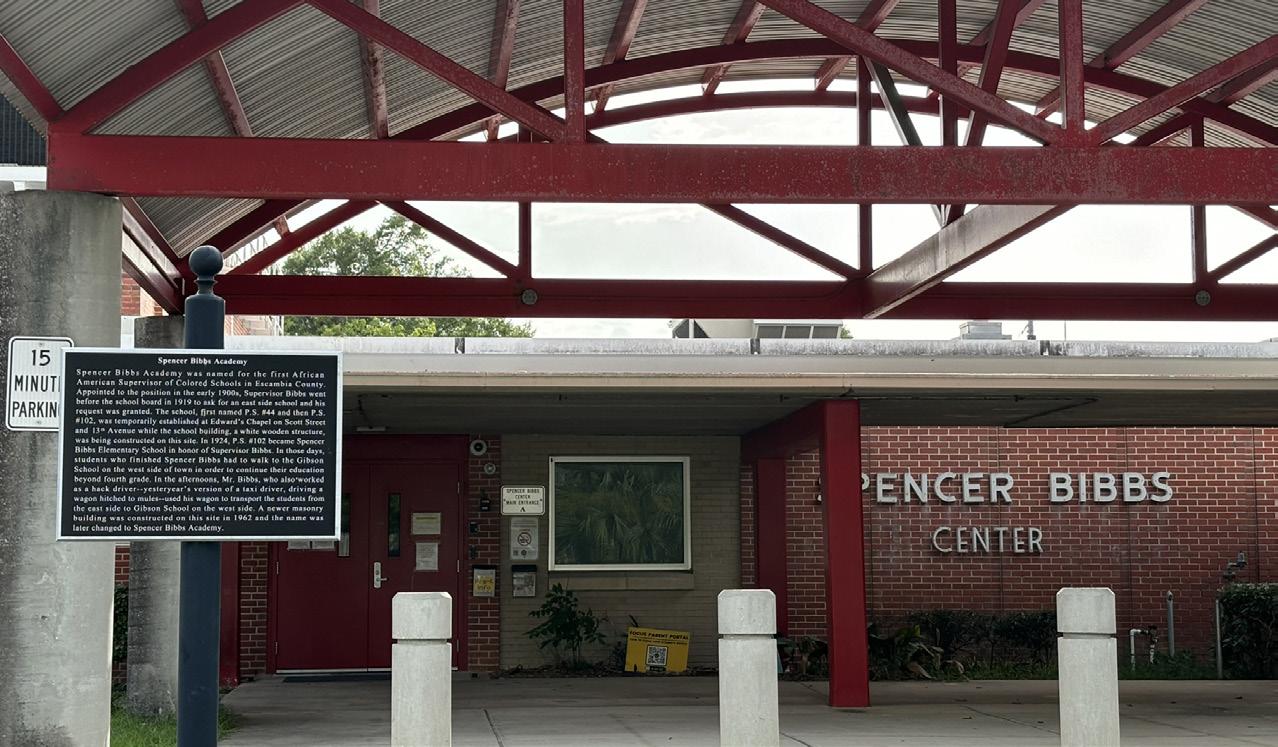
6. Community Gardens
• Assess the need for and interest in community gardens in public parks as part of the 2025 Parks Master Plan.
• Build relationships with potential garden operators.
7. Stormwater and Drainage Infrastructure Maintenance
Recommend that the City address stormwater and drainage issues along E Mallory Street between Hayne Street and 9th Avenue, along E Gonzalez Street, and Avery Street.
8. Eastside African American Heritage Trail
Continue to celebrate and support the African American Heritage Trail that connects the historical markers that tell the history of cultural landmarks in the Eastside.
9. Connections to Hollice T. Williams Park
Study the east-west pedestrian and bicycling connections to and from Hollice T. Williams and identify priority paths for streetscape improvements.

Community gardens can be a great way to build community participation
The Spencer Bibbs Center is a stop along the African American Heritage Trail in the Eastside
IMPACTS AND PROJECTIONS

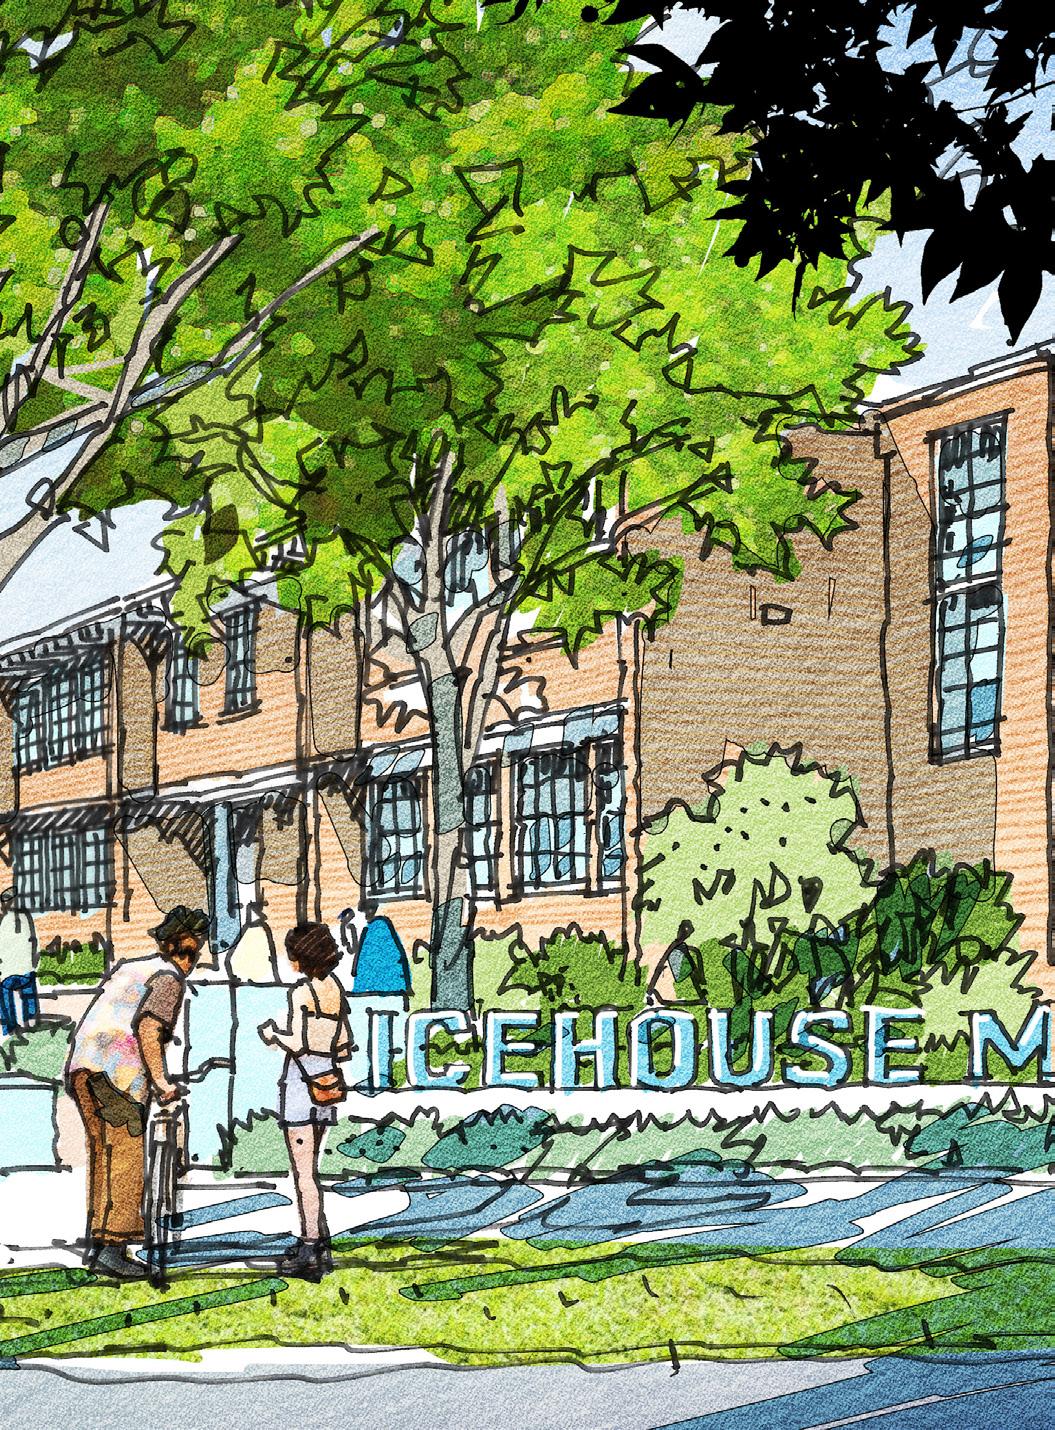
NEIGHBORHOOD IMPACT ELEMENT
This plan makes provisions for affordable housing through rehabilitation and new construction. Shortages in affordable housing will be addressed through existing and new affordable housing development strategies, with an emphasis on developing ways in which affordable housing can be integrated within market rate housing projects.
Implementing this plan will improve the quality of life for residents within the Eastside CRA District and surrounding areas. While all impacts cannot be determined without site-specific proposals that evaluate impacts, this section provides a summary of potential impacts that may occur in each category required by statute. The specific categories that must be addressed are as follows: relocation, traffic circulation, environmental quality, availability of community facilities and services, effect on school population, and other matters affecting the physical and social quality of the neighborhood.
Relocation
This plan supports the preservation of the existing low- and moderate-income housing facilities in the residential areas. It does not require the relocation of any of the residents of the redevelopment area. The Eastside Infill Housing Special Demonstration Project will add new units to the area housing stock and may incorporate some levels of affordability. Recommendations included in the Housing section support the creation of programs and incentives that will help support the preservation and addition of affordable and attainable housing.
Should there be a need for relocation of residents, minimizing the impact to any residents subject to relocation will be of the utmost importance. Supportive services and equitable financial treatment will be provided to any individual and all families subject to relocation. When feasible, the relocation impact will be mitigated by relocating within the immediate neighborhood and seeking alternative housing options.
Traffic Circulation
The implementation of this plan related to streetscape improvements and traffic circulation are anticipated to positively impact the Eastside CRA District. All recommendations support the enhancement of pedestrian and bicycle safety, multi-modal connectivity, and traffic calming.
Additional traffic may be a result of increasing district-wide housing stock and community resources; however, this plan provides mitigation through the incorporation of on-site parking and improved multi-modal and pedestrian connectivity to alleviate impacts to congestion.
Environmental Quality
The City of Pensacola land use regulations require that stormwater management be addressed as a condition of permitting any development project. When redeveloped, the Hollice T. Williams Park Equitable Development Framework Plan, Dr. MLK Jr. Drive and N Davis Highway Streetscapes, and Gonzalez Street Shareway Special Demonstration Projects will incorporate stormwater retention and/or detention areas. Recommendations for stormwater and drainage infrastructure maintenance and corridor improvement projects also support the incorporation of stormwater mitigation and low-impact design.
Community Facilities and Services
This plan supports increasing the number of and improving the variety and quality of community facilities and services in the Eastside CRA District, which are detailed in the Open Space and Community Amenities section.
This plan recognizes the importance of community facilities and supports planned improvements of these facilities. Existing open space and recreational facilities in the area include Magee Field and Hollice T. Williams Park. This plan recommends the addition of open space and recreational facilities, which are intended to expand access to shared open spaces within the neighborhoods. The continued support of the African American Heritage Trail and pedestrian and bicycling connection to and from Hollice T. Williams Park are also anticipated to improve connections between destinations in and around the Eastside CRA District.
Effect on School Population
This plan anticipates positively impacting the area's school population by recommending the continued building of relationships with the Escambia County School District in order to support the prioritization of projects that will directly improve the safety and experience of students. Streetscape and community facilities improvements proposed as part of the Crystal Ice House Market, Hollice T. Williams Equitable Development Framework Plan, Hayne Street Improvements, Dr. MLK Jr. Drive and N Davis Highway Streetscapes, and Gonzalez Street Shareway Special Demonstration Projects and throughout the district along priority corridors are intended to enhance the safety, accessibility, and experience of students and other residents.
Physical and Social Quality
This plan's recommendations to improve the appearance and safety of highly-trafficked corridors, enhance the pedestrian experience, focus on placemaking and infill development, and increase opportunities for housing and economic development will have a positive impact on the Eastside CRA District's physical and visual character. The implementation of this plan's recommendations will help to create housing, employment, and social opportunities.
PRIORITY PROJECTS
Using the CRA Prioritization Criteria and the agreed-upon scoring matrix, the CRA and consultant team has embarked upon a collaborative process to evaluate the projects and recommendations in the plan. Considerations have be made for implementability, availability of funding, alignment of timelines with other public and private investments, and more. The Priority Projects Matrix is meant to act as a living document that will be updated as project feasibility, funding, and priorities evolve, and as projects on the list are funded or completed. All projections, including timeframes and costing, are estimates intended for high-level budgeting purposes only.
The City and/or CRA’s ability to undertake the proposed increment expenditures, create new redevelopment areas, or expand existing redevelopment areas as identified herein may be limited in the future by changes in law or circumstances. The City and CRA should consider utilizing debt financing and bond issuance where feasible and allowed by then-current law to finance capital improvements and thereby expedite achievement of desired redevelopment objectives.
Priority Projects for Eastside CRA
Hollice T. Williams Park Equitable Development Framework Plan
In order to accomplish the objectives laid out in the Phase 1 Framework Plan, a detailed study should be completed to identify specific policies that the City should adopt. The variety of potential funding sources and broad scope of this transformational project must be confirmed before projecting costs.
CRA Boundary Expansion
An Analysis and Necessity of Finding study should be conducted as a way to project the potential benefits and scope of expansion. The broad potential scope of this transformational project must be confirmed before projecting costs. The City and CRA should utilize Debt Financing and Bond issues where feasible and allowed by law to finance capital improvements.
Crystal Ice House Market
This projection included renovation of the Ice House building, conversion of the parking lot, the addition of shipping containers and small food/ vendor trailers, the construction of a market hall/ pavilion and various furnishings that may be required.
Dr. MLK Jr. Drive & N Davis Highway
Curb
Management Study and Streetscape Enhancements
Enhanced streetscape, bump outs, lighting, intersection improvements, etc. from Cervantes St. to Baars St. were studied for this projection. 0-5 years
Gonzalez Street Shareway
Re-signing stop signs and selective miniroundabouts from 9th Avenue to Pace Boulevard (~2.5 miles) were studied for this projection. 0-5 years
Commercial Property Improvement Program (CPIP)
These projections were based on the size of the Eastside CRA District and the existing costs of the Westside CRA District's program, which is assumed to be of similar nature. Total projection is made up of 10 annual increments.
0-10 years
and/ or Municipal General Fund; Federal Grant; Philanthropy
(bond for capital; payas-you-go for program); NMTC; CDBG; FL DEO; Private & Institutional Investments; Nonprofit Grants/Corporate Sponsorships
TIF (bond for capital; payas-you-go for program); Federal grant (DOT Safe Streets); FL DOT; Local Options Sales Tax (L.O.S.T); Sales Taxes
138,000 TIF and/or Municipal GO Bond; Federal grant (DOT Safe Streets); FL DOT
750,000
pay-as-you-go; Florida West Economic Development Alliance
Priority Projects for Eastside
Intersection and Sidewalk Improvements
These projections were based on identified priority intersections and represents the estimated cost of raised crosswalks and bulbouts along Dr. MLK Jr. Drive at Maxwell, Jordan, Blount, Lee, Avery, and Cervantes streets.
Dr. MLK Jr. Drive & N Davis Highway Two-Way Conversion
To estimate this project's cost, the ECRC report was referenced. Assumed conversion would be implemented by the City and milling and resurfacing would be implemented by the State.
Update the CRA Urban Design Overlay District (CRAUDOD)
This projection assumes a 4-6 month study involving community engagement plus a 4-month adoption process, that could be run by a consultant or by CRA staff. The projected cost assumes a consultant fee, not the cost of staff.
Incorporate Neighborhood-Serving Retail
This projection assumes the addition of one (1) retail node in the neighborhood, using regional parametric costs per approximate area.
Community Benefits Guideline
Projections accounted for the size of the CRA District and resultant revenue in comparison to the other CRA Districts.
Develop Neighborhood-Specific Plans
This projection assumes that the Eastside CRA District remains as one neighborhood with a 4-6 month engagement process. It is also assumed that the City/CRA implements the findings.
Neighborhood Identity & Wayfinding
This projection assumes that this project would be completed as a single branding and design package for the entire CRA District due to its size, as well as a variety of street furnishings, signage, and other elements that may be recommended.
Municipal GO Bond; Federal grant (DOT Safe Streets); FL DOT
Municipal GO Bond; Federal grant (DOT Safe Streets); FL DOT
Bond; Municipal GO Bond; Florida West Economic Development Alliance; FL DEO; Private & Institutional Investments
Pay as you go; Municipal General Fund; Nonprofit Grants
Pay as you go; Municipal General Fund; FL DEO; Private & Institutional Investments; Nonprofit Grants
TIF (pay-as-you-go for study; bond for capital); FL DEO; Private & Institutional Investments; Nonprofit Grants/ Corporate Sponsorships; Escambia County's Tourist Development Tax (TDT)
Priority Projects for Eastside CRA
Revitalize Cultural Landmarks and Historic Buildings
This projection was based on the advertised renovation costs for the H&O Cafe and the E.S. Cobb Center, with other contingencies included.
Partnership with Community Land Trusts for Infill Development
This projection assumes the acquisition of twenty (20) lots and estimates costs for the new construction of ~1,200 square foot houses on each lot, with very little to no sitework or design costs.
Eastside African American Heritage Trail
The enhancement and/or addition of new trail markers is assumed.
0-10 years
$ 2,842,000
0-10 years
$ 6,085,000
TIF Bond; Historic Rehabilitation Tax Credit (HRTC); Federal Grant (HUD); FL Division of Historical Resources; Private & Institutional Investments; Nonprofit Grants
TIF Bond; County Housing Finance Authority funding; LIHTC; Federal Grant (CDBG); FL DEO; Private & Institutional Investments
0-10 years
$ 200,000
TIF Bond; Municipal GO Bond; Historic Rehabilitation Tax Credit (HRTC); Federal grant (HUD, DOT); FL Division of Historical Resources; Private & Institutional Investments; Nonprofit Grants/Corporate Sponsorships; Local Options Sales Tax (LOST)
Connections to Hollice T. Williams Park
This projection assumes street improvements (widened sidewalks, raised crosswalks, etc.) on three priority intersections along N Hayne Street, at Moreno, Lakeview, and DeSoto.
Residential Property Improvement Program (RPIP)
This projection assumes that services would not drastically change from those provided recently; therefore, the cost estimate is similar to the 2024 spending. Total projection is made up of 15 annual increments.
0-5 years
$ 2,496,000
0-15 years
TIF Bond; Municipal GO Bond; Federal grant (DOT, HUD); FL DEO; Nonprofit Grants; Local Options Sales Tax (LOST)
$ 7,500,000 TIF pay-as-you-go; Federal grant (CDBG); Philanthropy
TIF REVENUE PROJECTION
Methodology for Modeling Potential Future Revenue
The TIF Calculations evaluates the potential revenue impacts of proposed projects and developments using a Tax Increment Financing (TIF) formula. This analysis examines historic property values (parcel data) and supplementary information from CoStar and City-provided documentation to quantify the additional value from new developments and proximity premium uplift for real estate within a 2,000-foot buffer zone of park projects.
The formula integrates multiple components to project total revenue uplift: a Park Premium + Inflation multiplier is applied to parcels near proposed parks; Public Redevelopment Premium + Inflation accounts for valuation increases driven by CRA Plan initiatives; and Private Redevelopment Premium + Inflation incorporates value increases from developer-proposed projects. These premium valuations are then added to the Future TIF Dollar Base, a forecast of parcel-level values spanning 2025–2035, derived from historic valuations between 2020–2024.
Park Premium Methodology
Parks increase the value of surrounding real estate. The park premium buffer methodology utilizes insights from the Florida Recreation and Parks Association (FRPA)’s property value resources calculator to quantify the added value of proximity to park projects. A multiplier is applied to property values within a defined buffer zone, capturing the economic benefits of access to green spaces. This multiplier is calibrated using national and regional trends in property value appreciation associated with park proximity, with adjustments for local market conditions where appropriate.
TIF Calculations Formula
WHAT IS TAX-INCREMENT FINANCING (TIF)?
Tax Increment Financing (TIF) is a method of paying for redevelopment through projections of increased tax revenue on real estate values. The CRA offers TIF rebates to developers as an incentive to redevelop; these rebates are calculated as a percentage of tax increment generated by the project's construction, paid out over a set period of time.
TIF is a method that cities across the country have been using for decades as a tool for local governments to pay for infrastructure improvements and redevelopment of blighted areas. In the State of Florida, city's CRAs are responsible for monitoring/disbursing the TIF revenue.
The TIF formula used City-provided historic property values and parcel data, supplemented by CoStar and proposed City documents, as inputs. A multiplier was applied to simulate the proximity premium value uplift for real estate within a 2,000-foot radius of each recommended park project. Additional valuation uplifts from proposed private and public parcels were added to the base CRA forecast data to calculate the total potential revenue from investing in park development.
Future TIF Dollar Base
premium multiplier added to the parcels located within specified buffer zones
of value from baseline due to redevelopment CRA plan projects
baseline due to redevelopment projects already proposed by developers
Premium valuations added to the forecasted total parcel valuations for each CRA (years 2025-2035, based on historic valuations from 2020-2024)
The buffer boundary logic adheres to industry-standard practices, defining zones of influence based on factors such as walkability, accessibility, and line-of-sight. Properties within a 0.25-mile radius typically receive the highest premiums, with diminishing effects extending up to 0.5 miles or further, depending on the park's size and amenities. These boundaries ensure a consistent and equitable evaluation of the impact of proposed park projects on surrounding property values. The multiplier table is available below:
Identifying Parks For Premium Calculation
The parks selected for the Parks Premium calculation include a series of identified potential park projects outlined in UDA’s November 2024 Post-Workshop Survey Summary. This summary captured the perspectives of 174 participants, who were asked for their opinions on specific park initiatives, with one initiative proposed for each CRA. In addition to the three identified parks, the analysis also incorporated the Hollice Park buffer, as this project has been a key component of the contracted JLP+D work.
Park Proximity Premiums
Improvement Value Park Proximity
20%
10%
For parcels adjacent to the park
For parcels 1 block away (500 feet)
5% For parcels 2 blocks away (1,000 feet)
Improvement Value Park Typology
10% For active parks
33% For active and passive recreation areas within the park
70% For passive recreation within the park
Public Proposed Project Valuation Methodology
Proposed public investment project sites were identified in the UDA November 2024 Post-Workshop Survey Summary, with additional project square footage details provided by UDA. The square footage for each project was multiplied by the market price per square foot, as determined by CoStar. These values were then forecast using a unified appreciation rate to estimate future valuations. The difference between the forecast CRA parcel value and the projected public project valuation is applied to the TIF revenue projection.
Private Proposed Project Valuation Methodology
Proposed private investment project sites were identified using a Q4 2024 CoStar data pull of proposed and under-construction projects, which was subsequently reviewed and validated by city staff. The square footage of each project was multiplied by the market price per square foot, as provided by CoStar. These valuations were then forecast using a unified appreciation rate to estimate future property values. The difference between the forecast CRA parcel value and the projected private project valuation was incorporated into the TIF revenue projection.
Baseline Property Value
Baseline projections for property values were developed by integrating the City of Pensacola's geospatial parcel data with historical numeric tax assessor data provided by the client. This was achieved by aligning the Parcel ID from the geospatial parcel dataset with the corresponding Parcel ID in the numeric tax assessor data, ensuring precise mapping of spatial attributes to their historical valuation trends.
Forecast annual appreciation rates are aligned with Florida’s historical real estate inflation rates.
Historic TIF Millage Rates
TIF millage rates were sourced from the client's historical TIF revenue data. The provided data includes the following details:
Eastside CRA TIF Revenue Performance Summary of Revenue Estimation

Historically, TIF payments (dark blue) began in the mid-2000s and showed a steady but moderate increase over time. A slight dip between 2010 and 2013 suggests a temporary stagnation in property values tied to broader economic conditions. However, after 2013, a gradual upward trend emerged, aligning with economic recovery and new development initiatives.
The future baseline TIF payment with inflation (brown) represents projected revenue growth in the absence of additional development. This steady increase reflects expected property appreciation and rising assessment values over time.
A notable shift begins around 2030, when additional TIF payments from the CRA Plan’s proposed development (purple) start contributing to overall revenue growth. This marks a turning point where planned public-sector initiatives begin to generate financial returns.
Another critical factor in revenue expansion is the “park premium” (green), which emerges around 2035. This delayed but significant increase indicates the impact of public space enhancements, most noticeably the Hollice T. Williams Park, on nearby property values. Historically, properties near improved public spaces experience appreciation, leading to increased tax increment contributions.
In the Eastside District, there is no other private redevelopment in addition to what is captured in the CRA Plan.


STATUTORY COMPLIANCE
COMPLIANCE WITH FLORIDA STATUTES
Sections 163.360 through 163.362, Florida Statutes, specify certain elements which must be addressed and content which must be included in community redevelopment plans and modifications to such plans. This Appendix identifies how this Plan Update complies with the statutory requirements.
Florida Statute Requirement
§ 163.360(2)(a) The community redevelopment plan shall . . . [c]onform to the comprehensive plan for the county or municipality as prepared by the local planning agency under the Community Planning Act.
How the Requirement is Met
PriortoitsapprovalbytheCity Council,thePlanUpdatewas submittedtotheCityofPensacola PlanningBoardforreviewand recommendations,asrequiredbys. 163.360(4),FloridaStatutes.The PlanningAgencydeterminedthatthe PlanUpdateisinconformitywiththe comprehensiveplanforthe developmentoftheCityasawhole.
§ 163.360(2)(b) The community redevelopment plan shall . . . [b]e sufficiently complete to indicate such land acquisition, demolition and removal of structures, redevelopment, improvements, and rehabilitation as may be proposed to be carried out in the community redevelopment area; zoning and planning changes, if any; land uses; maximum densities; and building requirements.
§ 163.360(2)(c) The community redevelopment plan shall . . . [p]rovide for the development of affordable housing in the area, or state the reasons for not addressing in the plan the development of affordable housing in the area.
§ 163.362(1) Every community redevelopment plan shall . . . [c]ontain a legal description of the boundaries of the community redevelopment area and the reasons for establishing such boundaries shown in the plan.
Seethesections hereinentitled“Land Use,Zoning,andSpecialDistricts” and“Activities.”
Withrespecttodemolitionand/or removalofstructures,seethesection hereinentitled“Recommendations” andthediscussionthereinunderthe heading“Demolitionand ReconstructionFundingProgram.” Seealsotheheading“PrepareSites forRedevelopment”underthe sectionentitled“Activities.”
Seethesectionhereinentitled “Housing.”
Seethesectionhereinentitled “OverviewoftheCRA”fora descriptionoftheboundariesofthe redevelopmentarea. Seealsothe sectionhereinentitled “PhysicalPatterns”whichincludes variousdiagramsincludinguseand zoningmapsoftheredevelopment areaanditsboundaries. The boundariesoftheareaarefurther describedintheFindingofNecessity ResolutionadoptedbytheCity Councilfortheredevelopmentarea
§ 163.362(2)(a) Every community redevelopment plan shall . . . [s]how by diagram and in general terms . . . [t]he approximate amount of open space to be provided and the street layout.
§ 163.362(2)(b) Every community redevelopment plan shall . . . [s]how by diagram and in general terms . . . [l]imitations on the type, size, height, number, and proposed use of buildings.
whichincludeslegislativefindingthat theconditionsintheareameetthe criteriaforredevelopmentandthat therehabilitation,conservation,or redevelopment,oracombination thereof,ofsuchareaisnecessaryin theinterestofthepublichealth, safety,morals,orwelfareofthe residentsoftheCity.
Seethesectionhereinentitled“Open SpaceandCommunityAmenities . ” Seealsothesectionshereinentitled “SpecialDemonstrationProjects” whichdescribeandillustratespecific planandprojectproposalsthat indicateopenspacesandstreet layouts.
Seethesectionhereinentitled“Land Use,Zoning,andSpecialDistricts” whichincludesdiagrams , general referencestothetype,size,height, number,andproposeduseof buildings.Limitationsareestablished throughtheCity’sbroader development,landuseandzoning regulations.
§ 163.362(2)(c) Every community redevelopment plan shall . . . [s]how by diagram and in general terms . . . [t]he approximate number of dwelling units.
§ 163.362(2)(d) Every community redevelopment plan shall . . . [s]how by diagram and in general terms . . . [s]uch property as is intended for use as public parks, recreation areas, streets, public utilities, and public improvements of any nature.
§ 163.362(3) Every community redevelopment plan shall . . . [i]f the redevelopment area contains low or moderate
Seethesectionhereinentitled“Real EstateMarket”andthehousing marketstatistics,includingnumberof dwellingunits,summarizedtherein. Seealsothediagramssetforthunder thesectionentitled“Physical Patterns.”
Seethesectionshereinentitled “OpenSpaceandCommunity Amenities”and“Transportation , Streets,andParking” Seealsothe sectionentitled“PhysicalPatterns” andthediagramthereinentitled “Parks,OpenSpace , andAmenities.”
Seethesectionhereinentitled “NeighborhoodImpactElement.”
income housing, contain a neighborhood impact element which describes in detail the impact of the redevelopment upon the residents of the redevelopment area and the surrounding areas in terms of relocation, traffic circulation, environmental quality, availability of community facilities and services, effect on school population, and other matters affecting the physical and social quality of the neighborhood.
§ 163.362(4) Every community redevelopment plan shall . . . [i]dentify specifically any publicly funded capital projects to be undertaken within the community redevelopment area.
§ 163.362(5) Every community redevelopment plan shall . . . [c]ontain adequate safeguards that the work of redevelopment will be carried out pursuant to the plan.
§ 163.362(6) Every community redevelopment plan shall . . . [p]rovide for the retention of controls and the establishment of any restrictions or covenants running with land sold or leased for private use for such periods of time and under such conditions as the governing body deems necessary to effectuate the purposes of this part.
§ 163.362(7) Every community redevelopment plan shall . . . [p]rovide assurances that there will be replacement housing for the relocation of persons temporarily or permanently displaced from housing facilities within the community redevelopment area.
Seethesectionhereinentitled “PriorityProjects.”
Seethesectionhereinentitled “Activities”andinparticularthe discussionundertheheading “PropertyDisposition.”
Seethesectionhereinentitled “Activities”andinparticularthe discussionundertheheading “PropertyDisposition.”
Seethesectionhereinentitled “DemographicandMarketAnalysis” andthediscussionthereinregarding preventingdisplacementofresidents andbusinesses.Seealsothesection hereinentitled“Neighborhood ImpactElement.”
§ 163.362(8) Every community redevelopment plan shall . . . [p]rovide an element of residential use in the redevelopment area if such use exists in the area prior to the adoption of the plan or if the plan is intended to remedy a shortage of housing affordable to residents of low or moderate income, including the elderly, or if the plan is not intended to remedy such shortage, the reasons therefor.
§ 163.362(9) Every community redevelopment plan shall . . . [c]ontain a detailed statement of the projected costs of the redevelopment, including the amount to be expended on publicly funded capital projects in the community redevelopment area and any indebtedness of the community redevelopment agency, the county, or the municipality proposed to be incurred for such redevelopment if such indebtedness is to be repaid with increment revenues.
§ 163.362(10) Every community redevelopment plan shall . . . [p]rovide a time certain for completing all redevelopment financed by increment revenues.
Seethesectionhereinentitled “Housing.”
Seethesectionhereinentitled “PriorityProjects.”
Seethesectionhereinentitled “OverviewoftheCRA,”which specifiesthedatecertainas September30,2045
SUMMARY OF STEP 1 ENGAGEMENT
LIST OF ENGAGEMENT EVENTS
During Step 1 of the planning process, several different types of community engagement were utilized:
Listening Workshop — May 30th, 6:30-8:00 PM
• To explain the CRA planning process and to hear from residents about the key issues to address in the plan
• 32 attendees
Interactive Online Map* (detailed on following pages) — May 28th-August 23rd
• 765 contributions from 213 contributors
Eastside Associations Leadership Meeting — May 28th-31st
• To understand the history of planning in the Eastside neighborhood, and current neighborhood priorities
Stakeholder Meetings* — May 28th-31st
• Topic-based meetings
– Workforce & Economic Development
– Housing – Community Support Organizations
– Historic Preservation
– Arts & Culture
• 51 organizations attended over three days
Virtual Workshop #1* — June 11th
– Neighborhood Associations
– Environment & Waterways
– Parks & Amenities
– Transportation
• To explain the CRA planning process and to hear from residents about the key issues to address in the plan
• Provided for those that could not attend in-person workshops in May
Community Conversations* — August
• Three additional CRA staff-led workshops
• 138 total attendees
Stakeholder Meetings* — August
• Smaller meeting to discuss specific tops in the three CRA districts
– Neighborhood Associations Stakeholder Meeting (11 attendees)
– Environmental & Waterways, Parks & Amenities, and Transportation Stakeholder Meeting (7 attendees)
Pop-up Summer kids camps & Senior Bingo** — August
• Four CRA staff-led events
• 70 total attendees


* This engagement included attendees from all 3 districts
** This engagement was conducted with the Westside and Eastside
Stakeholder meeting
Listening workshop
Listening workshop
THIS PAGE INTENTIONALLY LEFT BLANK
ABOUT THE INTERACTIVE MAP
A vital part of Step 1 engagement included an online interactive map. The online interactive map served as a digital tool for place-based feedback about the planning process. Pensacola residents and stakeholder were encouraged to provide comments in at least one of four categories:
• Your Favorite Places
• Problem Areas
• Ideas for the Future
• General Comments
Respondents were able to drag one of these comment categories and pin it to a specific place on the map of Pensacola. Comments were not limited to a specific CRA District. After the interaction map closed, tabulation and organization of the comments were completed. There were 765 contributions from 213 contributors to the interactive map.


STEP 1 ENGAGEMENT SUMMARY RESULTS
The following pages show the summarized results of the online interactive map contributions to the Eastside CRA District with the other Step 1 engagement processes, including in-person and virtual community meetings, stakeholder groups, neighborhood workshops, and youth events. Along with identifying and summarizing Eastside-specific strengths, weaknesses, and opportunities, six themes addressed specific concerns and comments about the Eastside:
• Arts, Cultures, Activities, and Destinations
• Streets and Connections
• Housing and Opportunity Sites
• Community-Centered Planning
• Resilient Infrastructure
• Parks and Open Space
On the maps, community and stakeholder feedback is indicated by green (strengths), blue (opportunities), and red (weaknesses).
In-Person & Virtual Community Meetings
Youth Events Ways People have Engaged in the Plan Update Process
Online Interactive Map
Stakeholder Groups
Neighborhood Workshops
Over 900 comments from more than 270 participants at the community meetings
Over 750 comments from 213 contributors on the interactive map
Engagement from 9 stakeholder groups
Over 200 comments from neighborhood workshops
Over 2,000
Total Comments
Over 200 comments from youth groups
Strength
Magee Field is a great park for kids to play
the Eastside district has great existing amenities and institutions that can be better connected to the neighborhood

Weakness
Vacant lots, dangerous crossings, and flooding issues
Strength
Chappie James Museum
Weakness
Dangerous crossings and flooding issues create a poor and inaccessible pedestrian experience
Weakness
Cervantes St is not pedestrian-friendly and creates a barrier between neighborhoods
opportunity
Create safe pedestrian/bike paths and crosswalks
opportunity
Reopen and honor the historical significance of H&o Cafe
Along with pedestrian and bicycle connectivity, community visions for the Eastside included enhancing areas around significant cultural and amenity sites

opportunity
Add more amenities to Mcgee
Field and implement traffic calming measures
opportunity
Create safe pedestrian/ bike paths and crosswalks across Cervantes St
Strengths
• The vibrant downtown area
• Palafox Street - active and walkable
• Historical buildings with unique character
• Shops and restaurants
• Parks and open space, including the Blake Doyle skate park, Ferdinand Plaza, and Veterans Memorial Park
• The waterfront, with areas like Bruce Beach for families and activities at the Blue Wahoo Stadium
• Paved streets and street trees
• Festivals and events that promote the local arts & culture
Weaknesses
• Lack of affordable, accessible grocery store
• Lack of retail carrying everyday goods
• Existing parks are not well-maintained
• I-110 causes noise and air pollution for the neighboring residential neighborhood and park
• Vacant/rundown buildings and lots make the area feel unsafe and detract from the existing character
• Poor bike and pedestrian connections to neighborhood amenities and downtown
• Lack of public amenities (i.e.. bathrooms)
• Existing infrastructure does not address drainage & flooding issues and are poorly maintained
• Speeding traffic
• Littering
Opportunities
• Add amenities and programming to existing community centers in the neighborhood
• Create a safe community (better lighting, neighborhood watch)
• Celebrate the history of the area through public art, signage, building preservation, and education
• Create safe pedestrian and bike connections to neighborhood amenities
• Add amenities to existing parks
• Create a wide variety of parks with different uses and programming
• Create affordable housing
• Make sure existing residents have a say in the future of their neighborhood
Arts, Culture, Activities, and Destinations
• Celebrate the history of the neighborhood through art, signage, building preservation, and education and partner with existing organizations and non-profits
• Create more indoor spaces for community needs (community center, library, indoor gyms)
• Create more retail & restaurants
• Create/support affordable and accessible programs and activities for families, children, and seniors
Community-Centered Planning
• Align zoning and planning policies with community needs
• Create a safe community for all (appropriate lighting, safety education for kids, set up a neighborhood watch)
• Create job and entrepreneurship opportunities for residents and support existing small businesses
• Create more accessible systems for sharing information and resources
• Provide everyday services and retail
• Expand the CRA boundary to provide funding for adjacent neighborhoods
Streets and Connections
• Improve pedestrian connections & access to public amenities
• Repair the issues caused by the I-110 (torn community fabric and lost history, noise, poor connections)
• Improve pedestrian crossings
• Limit excessive parking and create shared parking strategies
• Slow traffic and improve safety on streets
Resilient Infrastructure
• Mitigate flooding impacts (“Old Stinky”, parks with lots of pavement, A St, Garden St, Clubbs St & Government St, Clubbs St & Zarragossa, Bruce Beach, Gonzales & Tarragona)
• Underground utilities and cut trees back from existing utilities
• Protect the shoreline/minimize damage from future natural disasters
• Create affordable and accessible housing for all stages of life and help homeowners maintain existing homes (seniors, families, rental, homeownership)
• Make sure future development focuses on inclusion, community participation & keeping existing residents
• Rehab or demolish existing damaged properties
Housing & Opportunity Sites Parks and Open Space
• Provide more parks and open space
• Incorporate lighting, seating, landscaping, and stormwater features in park
• Preserve old-growth trees
• Improve the maintenance of existing parks and update existing amenities to be accessible for all ages and abilities
SUMMARY OF STEP 2 ENGAGEMENT
LIST OF ENGAGEMENT EVENTS
Step 2 of the planning process included a week-long workshop that culminated in a presentation and open house. Following the presentation, surveys and additional meetings were conducted to gain valuable feedback from those unable to attend the workshop events.
1:1 Meeting with the Mayor* — September 30th, 3:00-4:00 PM
• To review opportunity sites and priorities rights-of-ways
• To receive input on developmental projects
Meetings with Councilmembers & CRA Board* — September 30th-October 1st
• To review recommendations, input on development projects, priority rights-of-way & workshop insights, and listen to input
Meetings with City Department Heads* — October 1st
• To present ideas in progress
• To discuss any alternatives or sensitive information
Testing Workshop Public Open House* — October 1st, 6:00-7:30pm
• To share ideas for potential projects in the Eastside and get feedback from residents about potential CRA investments
• Spanish translation provided
Stakeholder Meetings with Developers* — October 2nd, 9:30-11:00 AM
• To discuss decision factors around investments

Testing Workshop Public Open House* — October 2nd, 12:00-1:30pm
• To share ideas for potential projects in the Eastside and get feedback from residents about potential CRA investments
• Spanish translation provided Testing Workshop Community Presentation* — October 3rd, 6:00-7:30pm
• To share ideas for potential projects in the Eastside and get feedback from residents about potential CRA investments
• Open House followed
Post-workshop Survey* — October 14thNovember 4th (detailed on following pages)
• To gather feedback on the concepts presented at the public meeting on October 3rd
Debrief with Keith Leonard, the Escambia County School Superintendent
• To gather input specifically on the Eastside plan and the Spencer Bibbs/Ice House plan
Debrief with the Area Housing Commission* — December 12th
• To debrief on the concepts that were developed during the Testing Workshop in October
* This engagement was conducted with all three CRA districts at once


ABOUT THE SURVEY
Because workshop attendance and feedback was limited to those who could physically be there, the post-workshop survey was crucial in gaining additional feedback. To widen the engagement reach, the survey was offered both digitally and in print, with English and Spanish versions, and distributed to hundreds of Pensacola residents, the goal was to reach as many residents as possible to obtain accurate and comprehensive feedback of the ideas presented at the workshop.
The survey was made available to the public from October 14th, 2024 through November 4th, 2024 and garnered 174 responses. Over 90% of participants live in Pensacola year-round, while over 50% of participants live in the CRA District boundary. About 55% of participants had not attended any previous engagement, showing that much of the feedback and ideas given were new for the project.
The following pages show the summarized results of each survey question. Along with the overall results of the survey, the data was further examined to organize the responses from residents who live in the Eastside. Some of the open text responses have been recorded in this document (at the bottom of the respective page); the comments that appear here have been selected for their relevancy and representativeness of the remainder of the comments.
Top Comments in the Eastside
Of the 11 responses received from Eastside residents, top overall comments included:
• Improve safety on North Davis Highway and Dr. MLK Jr Drive.
• Provide mixed-income housing and house ownership opportunities.
• Create a small business incubator and food park around the Crystal Ice House site.
• Prioritize Cervantes Street, North Davis Highway, and Blount Street for pedestrian and bicyclist safety and comfort.


1. Did you attend any of the following workshops?
2. What is your home zip code? If you don’t live in the United States, what is your county of residence?
All respondents
3. What is your relationship with Pensacola?
Eastside residents
4. What CRA District
5. How long have you lived in Pensacola?
154 answered, 20 skipped 11 answered, 0 skipped
All respondents
6. What CRA District of Pensacola do you work in?
Eastside residents
7. What
8. How do you identify your gender?
All respondents Eastside residents
What is your age?
Age Demographics
All respondents
10. What is your race/ethnicity?
154
Eastside residents
All respondents
12. How many working adults live in your household?
135 answered, 39 skipped
Eastside residents
11 answered, 0 skipped
13. Do you think that these concepts would improve safety on N Davis Highway?

North Davis Highway
This proposal corresponds with question


Dr. MLK Jr. Drive
15. Do you feel it’s a top priority to improve the pedestrian and bicycling experience in the Eastside?
(please specify)
16. Which streets are your top priority for improvements to pedestrian and bicycle safety and comfort?
17.
18.
19. Do you think the Crystal Ice House is an important cultural landmark in the Eastside that should be preserved and reused?
(please specify)

Crystal Ice House This proposal corresponds with questions 19-21
20. Do you think that creating a small business incubator and food park around the Crystal Ice House would benefit the Eastside CRA?
*Not sure (please specify)
21. What are your thoughts about this concept?
PENSACOLA
Post-Workshop Survey | October-November 2024
22. What other projects would you recommend in the Eastside CRA?
40 answered, 134 skipped
Overall clean up of the neighborhoods.
Create a multi-use trail throughout the district.
Mixed-use at the corners.
Empty lots and abandoned buildings need to be redeveloped. The change to twoway would slow down or move traffic giving those neighborhoods a chance to thrive.
Farmers Market under I-110.
More connection between East Hill and Downtown.
PENSACOLA CRA PLANS UPDATE / PENSACOLA, FLORIDA
Would like to see more third spaces for young children, teens and young adults to connect and hang out that isn’t school, work, or home.
Need increased housing density.
49. Do you have any other comments or suggestions not covered elsewhere in this survey?
20 answered, 154 skipped CRA has done a great job of including public input in this project. The City’s team is outstanding.
• Thank you for the opportunity to provide feedback of our lovely area.
• West Side development. There is so much potential in the historic portions of the west side. Gardening. Pensacola is almost devoid of gardening. Need flowers, shrubs, live oaks, magnolias, veg gardens, community gardens, honey bees, chickens. Get citizens outside, investing in and bonding with neighbors, homes.
• Thanks for this opportunity to be engaged.
• A city newsletter mailed out would be nice.
• Please reevaluate the W Government St as an improved collector street from Eastside to Downtown to Westside. The roadway has so much potential and needs immediate attention to traffic flows, stormwater issues and streetscaping. Thank you for this opportunity to comment.
• The West Main Master Plan x CMP, the Bluffline project, ACW, redevelopment of the Baptist Hospital site, and HTW should serve as the economic, place making, health, and environmental organizing principles for this current CRA plan revision. Start with that and make sure there’s synergy then go from there.
Propose to put Bayfront Parkway on road diet freeing up space for walkway from bridge to cedar street. Connect to Government Street at ninth ave. Upgrade Government Street to Palafox.
• Build more skate parks.
• No. This took more than an hour to complete.
• Escambia Co. has been floating around an idea for a Sportsplex up north at 10 Mile Rd. I think the land at the old Baptist Hospital would be great for that Sportsplex. Has anyone discussed this? They’re talking about a 90Million dollar expenditure.
PENSACOLA CRA PLANS UPDATE / PENSACOLA, FLORIDA
Restaurants would help make retail more successful and the neighborhood be more attractive for a healthy mix of incomes to live in.
Roundabouts wherever possible.
Post-Workshop Survey | October-November 2024
• Hey this was a fun survey I found on Reddit! I live here and figured I’d give my two cents! I really liked the ideas proposed and am rooting for you to get them done! Good luck!
• Should be working to maintain and preserve the history and heritage of the downtown area, not flooding it with high density housing that will only strain the resources and jam up traffic. Use the underutilized terminal area for industrial and business spaces.
• Lakes and more trees are much needed where possible. Moving above ground utility lines to below ground and removing the utility poles with street lamps. First start with the 300 block of W. Govt St and move west. Thank you for this opportunity to comment.
• For years I have thought that we should amp up the landscaping for the median on Garden Street. Like Fairhope, I think we could really do a phenomenal job with landscaping this and really play into the “Garden” street name and put rotating seasonal florals that are tasteful and impressive to tourists and locals alike. Garden Street is the first impression for most who travel into the heart of Pensacola and it has always looked so tired, weak and not prioritized but it could be so delightful and do wonders for the first impression for Pensacola tourists.
• Who will provide upkeep of proposed tree installs and other proposed projects — roads, lighting, parks, etc.
• Shut down the polluting paper mill, it makes Pensacola stink and drives away people, business’s and jobs, while lowering our quality of life Too much “affordable” housing is mentioned. How about mentioning buried utilities? Mentioning round-a-bouts instead of all these four way stops?
• Is there anyway to make parking on Gregory Street between A Street and Rues? Donelson Street between Gregory and Chase street?
• Yes when you have a diverse economic shopping store front need always consider a Dollar General.
THIS PAGE INTENTIONALLY LEFT BLANK
DEMOGRAPHIC AND MARKET ANALYSIS
OVERVIEW
This analysis of existing demographics & market conditions was conducted across all three CRA Districts simultaneously, but also narrowed in on each district to identify specific conditions per district. The analysis was conducted primarily using data collected in 2023 and was published in September 2024.
The intent of this analysis was to:
• Analyze demographics of each CRA District;
• Identify primary community stressors;
• Identify opportunities in the market;
• Determine the potential impacts of development in each district in order to prevent the displacement of residents and businesses;
• Provide priorities for designers and policymakers to make positive impacts and avoid negative impacts on the community.


1.1 POPULATION CHARACTERISTICS
Population Growth


Military Presence
Naval Air Space Pensacola
The United States Department of Defense exerts a significant economic influence on Northwest Florida, particularly in the Greater Pensacola region, where it contributes over $7.8 billion annually to the local economy.
DoD activity generates over 80,000 jobs in the Pensacola Metropolitan Statistical Area (MSA) region, with an average wage of $82,890 for military and defense -related positions. Moreover, the area hosts more than 35,000 military retirees, representing the second -largest concentration in the nation providing a skilled workforce that may seek opportunities to transition into civilian careers.
Additionally, the region benefits from substantial defense procurement spending, totaling $340.7 million annually, which further stimulates economic activity. Military installations such as Naval Air Station (NAS) Pensacola play a crucial role in training personnel in advanced fields such as aviation, aerospace, informatics, and cybersecurity, contributing to the development of a highly skilled alumni network across various sectors.
The nearby military base brings jobs, military families, and some economic stability in the area. The military is a key economic driver for Pensacola.

PENSACOLA CRA PLAN UPDATE / PENSACOLA, FLORIDA / JLP+D 7
Income and Poverty
Poverty rates are elevated in the CRA districts, a consistent trend since 2000
Though income in Pensacola is slightly lower than the US average based on dollar amounts, incomes in Pensacola have risen over the last 20 years, following national trends. This is a good sign that Pensacola’s economy is active, and wages slightly lower than the national average may simply indicate lower cost of living.
More notably, variations are visible in the lowest income households within the three CRA districts. Both the Westside and Eastside CRAs exhibit wealth indices of 30, while the Urban Core has a wealth index of 75, and the broader Citywide population has a wealth index of 67. This index serves as a gauge of an area's economic prosperity relative to the national standard. Any index above 100 is above the national average.
These indices are reinforced by median household incomes, which depict a significant contrast:
● Citywide: $52,884
● Urban Core CRA: $59,901
● Eastside CRA: $35,124
● Westside CRA: $23,551
US Median Household Income: $74,580 (US Census)
Disparities are further highlighted by poverty rates; both the Westside and Eastside CRAs have higher proportions of households living below the poverty line at 39.5% and 27.5%, respectively. In contrast, the Urban Core CRA and the Citywide population have lower percentages of impoverished households, standing at 17% and 15%, respectively. Over the last 20 years,

There is a disproportionately high share of households below the poverty line within the Eastside CRA, and even more so in the Westside CRA. The districts may benefit from wider economic development efforts beyond CRA investments focused on workforce development, housing affordability, or social services.
Image Source: Greg Disch Photography
Pensacola Naval Air Station and Surrounding Area
KEY TAKEAWAYS
Race and Ethnicity
Diversity
However, despite these distinctions, all three CRAs fall short of the citywide diversity performance index; Pensacola has a diversity index of 62.9 in 2023 and is projected to reach 64.4 by 2028. Pensacola's citywide diversity has seen a notable uptick, rising from 55.3 in 2010 to 62.9 in 2023.
Similarly, the Westside and Eastside CRAs have experienced significant improvements in diversity performance from 2010 to 2023 , with the Eastside CRA's diversity index soaring from 34.4 to 60.5, and the Westside CRA's increasing from 51.9 to 59.4 The Urban Core has witnessed a decline in diversity , with its index dropping from 53.9 in 2010 to 51.8 in 2023

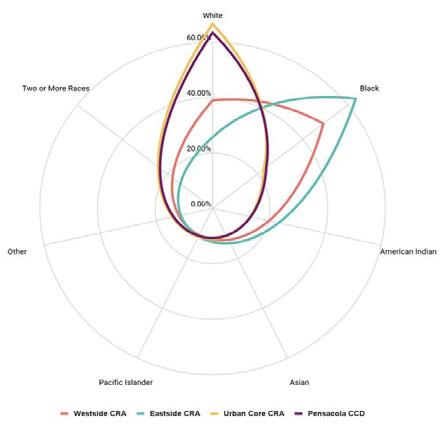
Employment Concentration

Industry Drivers
Though it has a higher population, the Westside population similarly has nearly 7,000 employees commuting into the area, while less than 100 live and work there.
In the Eastside, the reverse is true. While the Eastside has the fewest residents of all three districts, there are fewer employees commuting into the Eastside than workers who reside in the Eastside and commute to work outside of the area.
● The Urban Core CRA is a clear job center for commuters, but has relatively few residents who work within the area.
● In general, Pensacolians commute out of their neighborhood for work.
Industry Drivers
For
●


Industry Drivers
Some
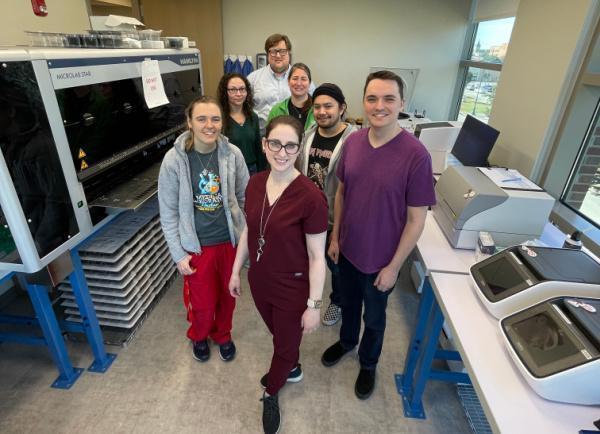
Declining Industries
Educational services have been in decline since 2003
Education workers have been leaving the CRA districts steadily over the past two decades. After 2003, workforce data shows a 40% decline in Education workers that live in the district. Since that same year, Education jobs in the district have also experienced a steady decline, with a 20% decline in the number of Educational Service workers and the vast majority of those losses occurring in the Urban Core.
These findings suggest that Educational services are no longer located in these three districts. These declines mirror a string of public school closures within the study area since 2003.

Schools in Pensacola by Employee Size


New Business Growth
Large employers remain steady while small businesses are growing in Escambia County
in Escambia
of


Housing Statistics
●
Q2 2024 Multi-Family Residential Market
Q2 2024 Office Market

Office Market Community Typologies


Q2 2024 Industrial Market

Industrial Market Community Typologies


Q2 2024 Retail Market


Retail Market Community Typologies


Q2 2024 Hotel Market Analysis


Use Diversity
A


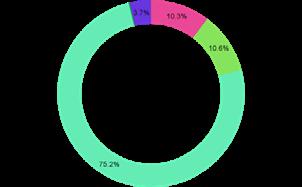

Land Use Diversity
Several land uses contribute to the overall property value of CRA districts. The combination of total land area in each distr ict, and the total value of the land area, shows wide variations. Some land uses thus have greater potential to impact the overall revenue recei ved by the Community Redevelopment Agency.
Land Value Compared to Land Use
Projects
AND SERVICES
● Hollice T. Williams Greenway & Skatepark Improvements
● General Daniel “Chappieˮ James Jr. Museum and Flight Academy - Phase II
HOUSING
● Affordable Housing Initiatives
● Residential Property Improvement Program
● Residential Resiliency Program
REVITALIZATION
● CRA Urban Design Standards
URBAN CORE
● Redevelopment Plan Update WESTSIDE
COMMUNITY WELLBEING AND SERVICES
● Bruce Beach Park Improvements
● Community Maritime Park Day Marina
● Hollice T. Williams Greenway & Skatepark Improvements
● Community Policing
HOUSING
● Affordable Housing Initiatives
● Residential Property Improvement Program
● Residential Resiliency Program
COMMERCIAL
● Commercial Facade Improvement Program
REVITALIZATION
● CRA Urban Design Standards
● Downtown Improvement District Initiatives
● Redevelopment Plan Update
HOUSING
● Affordable Housing Initiatives
● Residential Property Improvement Program
● Residential Resiliency Program
COMMERCIAL
● Commercial Facade Improvement Program
REVITALIZATION
● CRA Urban Design Standards
● Redevelopment Plan Update

Property Value over Time


Eastside TIF Revenue


Eastside CRA


Westside CRA
Outstanding Questions
Identifying Potential Causality

Could potential changes in appraisal policy play a role in increasing TIF revenue?
Could a change in real estate typology or volume be impacting the annual CRA revenue?
Could demographic, industry, or workforce changes be impacting the TIF revenue?
The process of change in an neighborhood or community that is seen by increased prices for basic needs, increased economic in vestments, and demographic or cultural shifts, typically resulting in displacement of residents.
● Methodology: Definitions were compared against each other through the lenses of: Definitions
A force that relocates people from where they are living or running a business. This can be either physical or economic, and it is often experiences as a slow accumulation of pressure or acute actions that change stay-or-go tradeoffs for individuals.
● Methodology: Definitions were compared against each other through the lenses of:
Discussion
● Displacement and Gentrification are related but not the same.
● Displacement is defined by the movement of residents and businesses. It is measurable and consistent. It is often witnessed in gentrifying areas.
● Gentrification is a process that often creates the set of factors that lead residents and businesses to move, and can also cause other changes. It is multi-faceted, and more complex to measure.
When is it gentrification vs. economic growth?
➔ Economic growth is positive for any community, and especially for low-income communities. However, when that growth is not inclu sive or accessible to certain groups, it is not equitable.
➔ The negative impacts of economic growth are often associated with gentrification, such as increasing rents reducing affordability for residents
➔ Equitable economic development aims to minimize the negative impacts of economic growth
Pensacola shows a mix of factors that indicate vulnerability to future gentrification and displacement, as well as some factors that limit gentrification and displacement
Gentrification & Displacement: Overall Trends Risk
Incomes
● Median incomes, when lower than the
income of surrounding areas, can be a predictor of gentrification and displacement.
●
Housing
● The affordability index is low, meaning that incomes are too
● The rental percentage is higher than County and national averages, suggesting homeownership is consistently out of reach
● Change in rental vacancy rates indicates changes in affordability for renters
Population Flows
● Fast growth can incite displacement of existing communities. Within Escambia county, migration has been net neutral over the
Diversity
● Diverse communities are less likely to experience displacement than areas with high concentrations of communities of color.
Incomes
● Extremely fast income growth is often a sign of gentrification for communities
Signals to watch for
Incomes & Earning Power
● Stakeholders should be
●
Rents & Evictions
●
Housing Supply
● Observing
Gentrification & Displacement: Risk Factors
Housing and Incomes create challenges for residents
Gentrification & Displacement: Possible Factors
A few factors indicate a complex set of trends for and against active displacement
There are several factors that may not demonstrate direct gentrification and displacement for Pensacolians. First, within Escambia county, migration has been net neutral - while some movement has occurred, the movers out have roughly equalled movers in. There is no visible evidence of rapid population growth contributing to displacement.
next, the CRA districts all have fairly high diversity, which can be a strength against swift displacement for communities of color. That said, the Eastside CRA district has a higher concentration of black households than the other areas, while the urban core CRA has a higher concentration of while residents.
Income growth, though low for many households, has increased at a steady rate, mirroring the national averages for that last 20 years. Sharp increases in income are often caused by higher earners moving to an area and lower income earners leaving.
Additionally, density of housing units has increased in all CRA districts, supported by some new construction and lot splitting and conversions or additions of accessory dwelling units.

Gentrification & Displacement: Signals to Watch in the Future
Changes to the population and rental prices are indicators of potentially fast shifts

given its small population overall.
Lastly, the CRA is familiar with planned housing projects, and the total units of housing added to the Pensacola market wll have the least impact if they are not outpaced by population growth. Thus, greater population growth, if it becomes a steady trend is also a sign to monitor changes to the number of housing units in the area.

Price Range
The price range for all bedrooms and all property types is $600 to $5,500.
PENSACOLA
What Else Impacts Gentrification Trends?


CRA FUNDING RESOURCES
FEDERAL FUNDING
USDOT
Rebuilding American Infrastructure with Sustainability and Equity (RAISE)
Infrastructure for Rebuilding America Discretionary Grant Program (INFRA)
Reconnecting Communities Pilot Program (RCP)
Safe Streets and Roads for All (SS4A)
Federal Transit Administration Capital Funds (FTA)
USDOT
Areas of Persistent Poverty Program (AoPP)
Carbon Reduction Program (CRP)
Congestion Mitigation and Air Quality Improvement Program (CMAQ)
Highway Safety Improvement Program (HSIP)
USDOT
USDOT
Federal Transit
https://www.transportation. gov/RAISEgrants/raise-nofo
https://www.transportation. gov/grants/infra-grants- program
https://www.transportation. gov/grants/reconnectingcommunities
Surface transportation projects that have significant local or regional impact; could include projects with a safety component.
Primarily freight related.
https://www.transportation.gov/sites/dot.gov/ files/2022-09/RAISE%20 2022%20Award%20Fact%20 Sheets_1.pdf
For projects that improve safety, generate economic benefits, reduce congestion, enhance resiliency, and hold the greatest promise to eliminate freight bottlenecks and improve critical freight movements.
Highway removal projects, through disadvantaged communities. Would fund replacement infrastructure and includes safety components.
https://www.transportation. gov/grants/SS4A Transportation safety projects.
https://www.transit.dot.gov/ funding/grants/urbanized- area-formula-grants-5307
Federal Transit https://www.transit.dot.gov/ grant-programs/areas- persistent-poverty-program
FHWA https://www.fhwa.dot.gov/ environment/sustainability/ energy/
Funds safe access to transit projects
Projects must be identified in a comprehensive safety action plan to receive implementation funding.
See Bicycles and Transit, Flex Funding for Transit Access, the FTA Final Policy Statement on the Eligibility of Pedestrian and Bicycle Improvements Under Federal Transit Law, and FTA Program & Bicycle Related Funding Opportunities
Funds projects that provide access to transit in disadvantaged communities, including safety improvements.
Planning, bicycle and pedestrian facilities, bike share programs, road diets, etc.
FHWA https://www.fhwa.dot.gov/ environment/air_quality/ cmaq/ Projects, including bicycle and pedestrian facilities, that reduce emissions.
Project must be part of the state TIP and consistent with LRSTP and Metropolitan Transportation Plan; does not fund recreational trails
Project for planning, feasibility analyses, and revenue forecasting associated with the development of a project that would subsequently be eligible to apply for assistance under the BIP
FHWA https://highways.dot.gov/ safety/hsip/shsp Safety projects on the highway system.
Projects must be consistent with a state's Strategic Highway Safety Plan, funding is only for Highway projects, public transportation, and port facilities, Small local agencies also eligible
Railway-Highway Crossings(Section 130) Program (RHCP)
National Highway Performance Program (NHPP)
Promoting Resilient Operations for Transformative, Efficient, and Cost Saving Transportation (PRO TECT)
FHWA https://highways.dot.gov/ safety/hsip/xings/railwayhighway-crossing-programoverview
FHWA Implementation Guidance for the National Highway Performance Program (NHPP) as Revised by the Bipartisan Infrastructure Law (dot.gov)
Railroad crossing improvements.
Could include safety improvements as part of other improvements.
FHWA https://www.fhwa.dot.gov/ environment/sustainability/ resilience/ Protecting transportation facilities from flooding.
Set aside from HSIP, Small local agencies also eligible
Only for Highway projects; Administered by the State
Funds can only be used for activities that are primarily for the purpose of resilience or inherently resilience related. With certain exceptions, the focus must be on supporting the incremental cost of making assets more resilient.
Surface Transportation Block Grant Program (STBG)
FHWA https://www.fhwa.dot.gov/ specialfunding/stp/ Planning, bicycle and pedestrian facilities, bike share programs, road diets, etc.
If called a bicycle facility, it must be primarily for transportation instead of recreation, but recreational trails are also permitted, Small local agencies also eligible
Transportation Alternatives (TA) Set-Aside
Recreational Trails Program (RTP)
Safe Routes to School Program (SRTS)
FHWA https://www.fhwa.dot.gov/ environment/transportation_alternatives/
Planning, bicycle and pedestrian facilities, bike share programs, road diets, etc.
FHWA https://www.fhwa.dot.gov/ environment/recreational_ trails/ Recreational trails
FHWA ttps://www.fhwa.dot.gov/ environment/safe_routes_to_ school/
Projects that improve safety for students going to school
Part of STBG; Administered by the State, Local agencies also eligible
Part of STBG; Administered by the State
Part of STBG; Administered by the State
FDOT FUNDING
FDOT
Transportation Alternatives Program (TAP)
https://www.fdot.gov/planning/ systems/tap/default. shtm
Bicycle/pedestrian facilities recreational trails, SRTS projects
Part of the Federal TA set aside of the STBG https:// fdotwww.blob.core. windows.net/sitefinity/docs/ default-source/planning/systems/systems- management/ document-repository/tap/ta_ set-aside-program_fl_ overview-highlights_2015-2021. pdf?sfvrsn=7c0d8522_2
Shared use trails
FDOT
Shared-Use Nonmotorized (Sun) Trail Program
https://www.fdot.gov/planning/ systems/suntrail/guidance.shtm
Highway Safety Improvement Program
FDOT Reports and Plans (fdot.gov) Transportation safety projects
Safe Routes to School FDOT
https://www.fdot.gov/Safety/ programs/safe-routes.shtm Transportation safety projects that improve safety for student going to/from school
Project must be within the SUN Trail network, a priority of the applicable jurisdiction, and consistent with applicable plans. Local agency must commit to operation and maintenance of trail. Separate Request for Funding, but must be included in FDOT Work Plan https://fdotwww. blob. core.windows.net/sitefinity/ docs/default-source/planning/ systems/ suntrail/guidance/ suntrail_guidanceforsubmittaloffundingrequest_ppt. pdf?sfvrsn=3ac9b7ba_2
Must show how project improves safety; part of FHWA HSIP funding
Funded through HSIP
SIDEWALK PRIORITIZATION
RANKING CRITERIA
Step 1
Separate candidate projects into two tiers:
Tier 1: Projects with no existing sidewalks
Tier 2: Projects with existing sidewalks on one side of the street
Step 2
Rank Projects based upon the following criteria:
2 School Proximity (Using EscCo Bus Eligible criteria)
6 Existing
If the totals for the subcategories exceed the maximum for the category, only the maximum value shall be assigned.
Data used will be from either City data (roadway classification, building footprints, pavement width, bike lanes, parks/community center locations, school locations), US Census data (worker transportation, DUs), and ECAT data (transit stops).
MICROMOBILITY AREA MAP
Shared Micromobility Devices
WFAIRFIELDDR

COST AND IMPACT COUNTERMEASURES
COUNTERMEASURE IMPACT AND COST DEFINED
High Impact
• Expected Crash Reduction ≥ 61%
Medium Impact
• 31% ≤ Expected Crash Reduction ≤ 60%
Low Impact
• Expected Crash Reduction ≤ 30%
Low Cost
• Typically $10,000 or less
Medium Cost
• Typically, $10,000 to $100,000
High Cost
• Typically, $100,000 +
Unknown Impact = No quantitative date is available
COUNTERMEASURE SELECTION GUIDE
Low Cost/High Impact
• Prohibit left turn
• All-way stop control
Medium Cost/High Impact
• Rectangular rapid flashing beacon*
• Variable speed limits*
• See guide for full list
High Cost/High Impact
• Traffic signal
Impact
Low Cost/Medium Impact
• Upgrade signal head
• LED-enhanced sign
• Bicycle crossing (solid green paint)
• Green Conflict striping
• Remove obstructions for sightlines
Low Cost/Low Impact
• Extend yellow & all red time*
• LPI and ped recall*
• Retroreflective backplates*
• Protected left turns
• See guide for full list
Medium Cost/Medium Impact
• Raised median*
• Raised crosswalk
• Directional median openings
• Curb-return radius reduction
• See guide for full list
Medium Cost/Low Impact
• Flashing yellow turn phase
• Pedestrian countdown timer
• Red light camera
• Lane re-purposing*
• See guide for full list
High Cost/Medium Impact
• Roundabout*
• Bicycle signal/exclusive bike phase
• Pedestrian hybrid beacon*
• On-street parking
• Separated bikeway*
• Pedestrian hybrid beacon*
High Cost/Low Impact
• Reduced left-turn conflict intersection*
Cost
N o t e :
Countermeasures may not apply to all modes, roadways, or crash severities. Countermeasures may apply to more crash types.
* FHWA Proven Safety Countermeasure
COUNTERMEASURE SELECTION GUIDE (CONT.)
Low Cost/ Unknown Impact
• Extend green time for bikes
• Extend time pushbutton
• Prohibit right-turn-on-red
• Prohibit turns during pedestrian phase
• Time-based turn restriction
• Upgrade intersection pavement markings
• Bicycles may use full lane sign
• Mixing zone
• High-visibility crosswalk
• Restripe crosswalk
• Centerline hardening
• Enhanced daylighting/slow turn wedge
• Paint and plastic median
Medium Cost/ Unknown Impact
• Bike detection
• Pedestrian detection
• Supplemental signal heads
• Flashing beacon as advance warning
• Curb extensions
• Paint and plastic mini circle/ mini roundabout
High Cost/ Unknown Impact
• Separate right-turn phasing
• Close slip lane
• Intersection reconstruction and tightening
• Protected intersection
• Raised intersection
Cost
N o t e :
Countermeasures may not apply to all modes, roadways, or crash severities. Countermeasures may apply to more crash types.
* FHWA Proven Safety Countermeasure
Low Cost/
Unknown Impact
• Audible push button upgrade extend time pushbutton
• Prohibit right-turn-on-red
• Prohibit turns during pedestrian phase
• Shorten cycle length
• Advance stop bar
• Advance yield markings
• Pavement speed legends
• Time-based turn restriction
• Upgrade intersection pavement markings
• Wayfinding
• Co-locate bus stops and pedestrian crossings
• High-visibility crosswalk
• Restripe crosswalk
• Centerline hardening
• Enhanced daylighting/slow turn wedge
• Gateway treatments
• Paint and plastic median
• Partial closure/diverter
• Straighten crosswalk
• Lane narrowing
• Far-side bus stop
• Extend green time for bikes
• Bicycles may use full lane sign
• Mixing zone
• Parking buffer
• Two-stage turn queue bike box
• Bike box
COUNTERMEASURE SELECTION GUIDE (PEDESTRIAN AND BIKE FOCUSED) Cost
Medium Cost/ Unknown Impact
• Pedestrian detection
• Signal interconnectivity and coordination/green wave
• Signal preemption
• Flashing beacon as advance warning
• Floating transit island
• Curb extensions
• Widen sidewalk
• Crosswalk density
• Chicane
• Landscape buffer
• Speed sensitive rest on red
• Upgrade lighting to LED
• Bike detection
t e : Countermeasures may not apply to all modes, roadways, or crash severities. Countermeasures may apply to more crash types.
* FHWA Proven Safety Countermeasure
High Cost/ Unknown Impact
• Separate right-turn phasing
• Shared use path
• Close slip lane
• Intersection reconstruction and tightening
• Protected intersection
• Raised intersection
TRANSPORTATION ANALYSIS
OVERVIEW
Existing transportation conditions were documented throughout Pensacola and provided a foundation for understanding the needs and possible improvements for the CRA planning process.
Documenting the existing transportation conditions included three main categories:
• Roadway Characteristics (e.g., street type, character, and dimensions);
• Mobility Characteristics (e.g., pedestrian/bicycle facilities, and safety);
• Equity and Transportation (e.g., communities overburdened by lack of transportation investment).


(this page left intentionally blank)
List of Figures
1 Introduction and Project Purpose
The Pensacola Community Redevelopment Agency (CRA) is updating all three CRA district plans after more than 15 years The CRA districts are comprised of the Westside, the Eastside, and the Urban Core. Each of the districts have distinct characteristics pertaining to transportation. The existing conditions highlighted in this report are based on city data, previous studies, current programs, site and desktop observations, and community input. Understanding the existing conditions provides the basis to develop near-, medium-, and long-term recommendations to improve mobility and accessibility of all the residents within the area
Documenting the existing transportation conditions includes three main categories:
• Roadway Characteristics (e.g., street type, character, and dimensions)
• Mobility Characteristics (e.g., pedestrian/bicycle facilities, and safety)
• Equity and Transportation (e.g., communities overburdened by lack of transportation investment)
The CRA Districts, along with the United States Department of Transportation (USDOT) Disadvantaged Community boundaries, 1 and major roadways 2 are shown in Figure 1.
1 The USDOT Disadvantage Communities are defined as those communities that have a higher burden of underinvestment in transportation, in the following five components: Transportation Insecurity, Climate and Disaster Risk Burden, Environmental Burden, Health Vulnerability, and Social Vulnerability.
2 Major roadways are defined as those that have interstate, arterial, or collector functional classification by the Florida Department of Transportation (FDOT).

2 Roadway Characteristics
Roadway Characteristics include all the ways in which one understands a street or road. These characteristics include looking at the type or function of the road, the physical attributes of the road (speed, width, how many lanes, type of connectivity or network) and neighborhood character surrounding the road.
2.1 Street Types and Networks
There are three major roadway types that make up the street network within the CRA districts. These major roadways are defined by FDOT and further qualified in the City of Pensacola 2023
Active Transportation Plan (ATP) as shown in Figure 2:
Figure 2 Roadway Functional Classification
Arterials
•Have the most traffic volume
•Typically are 4 lanes or more
•Provide regional connections
•Primarily run East/West except for North/South in Eastside
•Arterials include Principal Arterial Interstate, Principal Arterial Other, and Minor Arterials
Collectors
•Have moderate traffic volume
•Typically between 2 and 4 lanes
•Provide inter-city connections
•Run primarily north south and are primarily in the urban core
•Collectors include Major Collectors and Minor Collectors
Local Streets
•Serve neighborhood and residential uses
•Provide neighborhood connections
Total roadway miles within the three CRA districts is 112 miles. Of the 112 miles of roadway, there are a total of 37.8 roadway miles having a functional classification of arterial or collector. While the roadway miles within the CRA districts represent 5% of the total City of Pensacola roadways yet the CRA districts are comprised of 33% and 28% of the total arterial and collector roadway miles respectively in the City. Figure 3 shows the block structure which results from these major roadways

Figure 3 FDOT Roadway Functional Classification Location
WESTSIDE
Arterials
The location of the arterial roadways split the Westside district into five pockets which lack connectivity and are spaces where vehicles are given priority over pedestrians. As regional connectors, these high traffic volume roadways are very wide and support development patterns that do not foster a sense of place; rather it is a place to simply move through as quickly as possible. Such conditions make it extremely difficult for the neighborhood residents of Sanders Beach, Tanyard, and Westside Garden District to have easy access to amenities within and outside of the district.
Westside district has five roadways identified as arterial:
• W Cervantes Street
• N Pace Boulevard
• W Garden Street
• W Main Street
• Barrancas Avenue
Figure 4 Westside – Arterial Road
W. Garden Street – Looking East
Source: HDR


Figure 5 Westside – Arterial Road
Figure 6 Westside – Arterial Road
Barrancas Avenue – Looking North
Source: HDR
W. Cervantes Street – Looking East
Source: HDR
Collectors
These roadways usually provide more connections via cross streets, may have on-street parking, typically have more continuous building frontage, and if not designed well can still present challenges for non-vehicular modes of transportation (pedestrian and cyclist). These challenges may be a relatively high traffic volume, excessive curb cuts, or lack of separated pedestrian and bike infrastructure.
Westside district has five roadways identified as collector:
• W Government Street
• W Jackson Street
• N T Street
• N E Street
• N A Street
Figure 7 Westside – Collector Road
W. Jackson Street – Looking East Source: Google
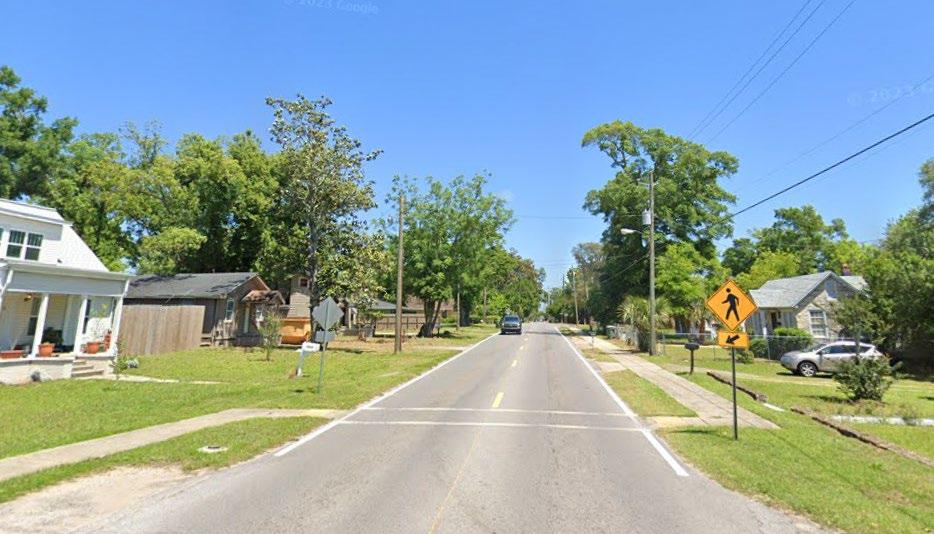

Figure 8 Westside – Collector Road
Local Roads
These roadways usually provide the most connections via cross streets, will have on-street parking (marked or unmarked), and typically will have numerous driveways given the prevalence of residential uses. FDOT’s functional classification specifically identifies seven local roadways in the Westside District:
• W Gregory Street
• W Wright Street
• N L Street
• W Government Street
N E Street – Looking South Source: Google
• W Zarragossa Street 3
• S E Street and N E Street
• S A Street

3 This street has different spellings in different locations including Zarragossa, and Zaragoza
Figure 9 Westside - Local Road

N E Street – Looking South
Source: Google
N E Street – Looking South
Source: Google

Figure 10 Westside - Local Road
Figure 11 Westside - Local Road
URBAN CORE
Arterials
The location of these roadways create a core that is fragmented and become major barriers to the connectivity of the district with the eastern neighborhoods of Old East Hill and East Hill, as well as the Eastside district
Urban Core district has eight roadways identified as arterial (some are shared with other districts):
• E and W Cervantes Street
• N 9th Ave
• E Gregory Street
• E Chase Street
Figure 12 Urban Core – Arterial Road
W Main Street – Looking East
Source: HDR
• Bayfront Parkway
• E and W Garden Street
• N Palafox Street
• E and W Main Street


Figure 13 Urban Core – Arterial Road
Figure 14 Urban Core – Arterial Road
E Chase Street – Looking East
Source: Google
N Palafox Street – Looking South Source: Google
Collectors
These roadways are primarily north/south in direction and are generally in very close proximity to arterials and to each other. This condition creates an environment that prioritizes vehicles and places a high level of discomfort for all other modes of transportation. However, there are other areas throughout the district where collectors have been well designed and are providing environments for pedestrians to enjoy and feel comfortable walking, such as N Palafox Street seen in Figure 15
Urban Core district has twelve roadways identified as collector (the most of any district):
• W Chase Street
• W Gregory Street
• N 14th Avenue
• N A Street
• W and E Government Street
• S and N Spring Street
• S and N Baylen Street
• Palafox Place
• S Tarragona Street
• N Palafox Street
• S Barracks Street
• S and N 9th Avenue

Figure 15 Urban Core – Collector Road N Palafox Street – Looking North Source: Google


Figure 16 Urban Core – Collector Road
Figure 17 Urban Core – Collector Road
W Chase Street – Looking East Source: Google
W Gregory Street (East of N Spring Street – Looking East Source: Google
Local Roads
These roadways usually provide the most connections, will have on-street parking (marked or unmarked), and will typically have numerous driveways given the prevalence of residential uses. These roadways provide for neighborhood trips and become the prevalent roadway type that defines walkability by way of block spacing. FDOT’s functional classification specifically identifies four local roadways in the Urban Core district:
• S Palafox Street
• W Gregory Street (west of N Spring Street)
Figure 18 Urban Core – Local Road
W Gregory Street (West of N Spring Street – Looking East
Source: Google
• S and N Baylen Street
• Palafox Place

EASTSIDE
Arterials
The location of these roadways along with the area and shape of the Eastside district creates an environment that is dominated by a high volume of traffic that is entering or leaving downtown, or connecting to the Interstate Thus, the narrow sliver is divided into small blocks that are more like islands in a sea of traffic most likely going above the posted speed limit. Additionally, Dr. MLK, Jr. Drive and N Davis Highway are one-way couplets further amplifying a car-centered community and I-110 is an elevated highway that further separates and isolates the Eastside from the neighborhoods to the west and south. As an arterial along I-110, Dr. MLK, Jr. Drive is double the width of most other arterials to accommodate two single-direction southbound lanes and parking on both sides of the street. The lack of transition into areas that are primarily residential neighborhoods is very abrupt and reinforces the hierarchy of vehicles vs. pedestrians.
The Eastside district has five roadways identified as arterials:
• N. 9th Avenue
• N Davis Highway
• Dr. MLK, Jr. Drive
• I-110
• E Cervantes Street
Figure 19 Eastside – Arterial Road
Dr. MLK, Jr. Drive – Looking South
Source: Google


N Davis Hwy. – Looking North
Source: HDR
21 Eastside – Arterial Road
E Cervantes Street – Looking West Source: Google

Figure 20 Eastside – Arterial Road
Figure
Collectors
These roadways are primarily east/west direction and are in very close proximity to arterials and to each other. These are also one-way couplets.
Eastside district has only two roadways identified as collector (the least of any district):
• E Jordan Street
• E Maxwell Street
Figure 22 Eastside – Collector Road
E Jordan Street – Looking East
Source: Google

E Maxwell Street – Looking West
Source: Google

Figure 23 Eastside – Collector Road
Local Roads
These roadways in the Eastside district run east/west and do not offer on-street parking due to the width of the road. Residential land uses dominate the frontage along the road. FDOT’s functional classification specifically identifies five local roadways in the Eastside district:
• E Gonzalez Street
• E Lee Street
• E Blount Street
• N Hayne Street
• E Cross Street
Figure 24 Eastside – Local Road
E Cross Street – Looking West Source: Google

2.2 Land Use
Arterials, as regional connectors, are the primary frontage for commercial uses within the CRA districts. Arterials in the Eastside are, however, primarily fronted by residential and the interstate. These commercial corridors also have the highest level of traffic stress and highest number of crashes compared to other corridors. If commercial corridors are not pedestrian friendly, it is difficult for residents to have full access to these destinations without a car. During public workshops, many residents especially in the Westside voiced concerns over the inability to get to stores or other amenities as the development patterns are also car centered with drive-thrus and parking along street
Figure 25 Commercial Corridors

2.3 Street Widths and Medians
Roadway widths range between 50 - 180 feet throughout the districts, excluding the interstate, with most of the right-of-way dimension being between 50 and 60 feet The roadways that are the least safe for pedestrians as well as cars typically have the widest dimensions. The common travel lane width throughout the study area is 12 feet.
26 Public Rights-of-Way

Additionally, a desktop review identified seven roadway segments with medians in the CRA districts These street medians vary in width and as such have a varying impact on the character of the street:
• West Garden Street (US 98 from A Street to Alcaniz Street)
• West Main Street from S Clubbs Street to S Spring Street
• East Main Street from S Tarragona Street/Bayfront Parkway
• North Palafox Street from East Wright Street to West Garden Street
• North Palafox Street from W Gadsen Street to West Jackson Street
• East Wright Street from North Palafox Street to North 6th Avenue
• Bayfront Parkway
Figure


Figure 27 West Garden Street at A Street
Figure 28 Bayfront Parkway
Source: Google
Source: Google


Figure 29 N Palafox Street
Figure 30 W Main Street
Source: Google
Source: Google
2.4 Intersections
Intersections serve as the space that brings together all the various modes of transportation. Intersections need to be designed effectively and safely for the system to function properly The Active Transportation Plan describes various intersections that need critical attention. The ATP identifies 10 high crash intersections in need of improvements to address unsafe conditions. Five of these intersections fall within the CRA districts.
Westside
• Barrancas Avenue and W Main Street
• Barrancas Avenue and W Garden Street
Figure 31 High Crash Intersections
Eastside
• MLK Drive and E Blount Street Urban Core
• N Palafox Street and W Wright Street
• N 9th Avenue and E Gregory Street


High Crash Intersections

Source:
Source:

Source: Google

Figure 34 Dr MLK, Jr. Drive and E Blount Street
Figure 33 Barrancas Avenue and W Garden Street
Figure 32 Barrancas Avenue and W Main Street
Google
Google


Figure 36 N 9th Avenue and E Gregory Street
Figure 35 N Palafox Street and W Wright Street
Source: Google
Source: Google
2.5 Posted Speed Limits
Speed plays an instrumental role in crashes including cause and severity of injuries Speed influences a driver’s cone of vision, stopping distance, and crash risk. The higher the speed, the smaller the driver’s cone of vision is, stopping distance is increased, and the risk of a crash is increased. The posted speed limits within the CRA districts vary from 25 miles per hour (mph) to 40 mph on urban streets and between 45 mph and 60 mph when I-110 is included along with its ramps
Figure 37 Posted Speed Limits

2.6 Roadway Maintenance
The entity responsible for road maintenance is a key stakeholder when it comes to supporting and implementing improvements. Figure 38 illustrates the maintenance of the roads within the CRA district.

The summary of miles of roadways and the agency responsible for maintenance is as follows:
• 1.1 miles of roadways are identified as maintained by county of which are all in the Westside district. This represents 33% of all county roads in the city.
• 21 miles of roadways are identified as maintained by the state. This represents 39% of all state roads in the city.
• 90 miles are considered local roads and are maintained by the City of Pensacola. This represents 27% of all city roads.
Figure 38 Roadway Maintenance
3 Mobility Characteristics
While walkability considers several factors such as intersection density, proximity to transit stops, employment mix, and employment and household mix, 4 it has to include the infrastructure as well. A walkable city means providing a robust network of pedestrian and bicycle facilities that are designed to provide comfort and safety for all. There are many challenges with walkability across the three CRA districts. While the network of streets is predominately smaller to medium blocks, which makes walking easier, the lack of a sidewalk network, bike facility network, lack of crosswalks, and roadway dimensions makes mobility a top priority for residents
3.1 Pedestrian and Bicycle Facilities
The three CRA districts have a total of 111.9 miles of sidewalks. 5 Based on the Environmental Protection Agency’s (EPA) National Walkability Index, 6 the CRA districts have a score between 15.26 – 20 resulting in being in the most walkable category as shown in Figure 39 While the EPA’s index tells one part of the story that measures the areas of probability of people walking as a mode of transportation based on three main factors: street intersection density, proximity to transit stops, and diversity of land-uses; the other part of the story is whether or not there are pedestrian facilities (sidewalks etc.)
4 EPA National Walkability Index
5 City of Pensacola Public Sidewalks layer.
6 National Walkability Index (arcgis.com)


Figure 39 City of Pensacola EPA Walkability Index Source:
SIDEWALKS
Based on the City of Pensacola’s data from 2018, the Urban Core has the most sidewalks at 64.1 miles; Eastside has 15.5 miles; Westside has the most miles at 32.3 but the least complete network of the three districts. The Active Transportation Plan (ATP) for the city identifies new sidewalk and intersection crossing needs as shown in Figure 40 ATP identified over 15 miles of sidewalk needs across the CRA districts representing 13.4% of the current network. This does not include sidewalks that are in need of repair. The Westside district has the most need for sidewalks, representing 83% of all sidewalk gaps
Figure 40 ATP New Sidewalk and Intersection Crossing Improvements

The city has established a sidewalk prioritization model which scores new sidewalk needs based on six criteria: safety, school proximity, new access, latent demand, connectivity, and existing demand. This is an important tool for making sure residents have mobility and access. High
priority improvement locations total approximately 16 miles. The Westside district accounts for 11.5 of those miles 7
Figure 41 Pedestrian and Bike Facilities

The city has also specifically assessed sidewalks under the requirements of Americans with Disabilities Act (ADA) which include curb ramps, obstacles, and hazards. The ADA of 1990 is a civil rights statute to provide persons with disabilities protections against discrimination in all areas of public life, including jobs, schools, transportation, and all public and private places as well as accessibility to those spaces that are open to the general public including the public rights-of-way
The ADA sidewalk assessment data from 2020 shows that only a fraction of the existing sidewalks are fully ADA compliant with most being moderately non-compliant. The assessment includes sidewalk repairs, ADA ramps, and “fill in the gaps” or small new segments of sidewalk that are missing causing an ADA concern. The city allocates $200K annually and the CRA allocates $300k annually in the Urban Core district as part of the complete streets efforts that go towards mitigating
7 Based on City of Pensacola data from 2018.
these

Figure 42 ADA Sidewalk Assessment - Compliance
BIKE LANES
Bike lanes, where they exist may be confusing as at the intersection of N Palafox and Wright where the bike lane disappears across this major intersection and becomes a sharrow on the other side. The data received from the city is incomplete, showing only a few streets with bike lanes.


Figure 43 N Palafox Bike Lane
Figure 44 N Palafox Bike Sharrow
Source: Google
Source: Google
3.2 Level of Traffic Stress
A level of traffic stress (LTS) analysis was conducted as part of the Active Transportation Plan. The LTS assesses the overall comfort level that pedestrians and cyclists have on streets. The LTS looks at the number of vehicles driving on a street per day, the posted speed, and whether bicycle infrastructure is available on major roadways.
The CRA districts have a significant amount of high and moderate stress roads While the Urban Core shows the highest concentration of these roads, the Westside district is more impacted by them from a disadvantaged community perspective.
Figure 45 Level of Stress (ATP)


3.3 Parking
Bike Pensacola, a local bike advocacy group has published a few safe riding routes. 8 Routes are established as a way to draw attention to the need for safe, connected and reliable bike infrastructure.
These makeshift routes avoid the roadways that have a high to moderate stress/comfort level.
Parking plays a major role in an area’s mobility. It can be an asset if thoughtfully located as part of supporting local businesses or as part of meeting the needs of residents. But parking can be a liability when ineffective policies place a premium on parking demands and as a result the pedestrian fabric of a community is eroded. Parking minimums and location along street frontages creates areas that are hostile to pedestrians due to heat island effects due to large areas of asphalt and lack of trees, underutilized parcels, lack of street definition.
8 Routes | Bike Pensacola
Figure 46 Bike Pensacola Bike Routes

The Urban Core has 208 acres of surface parking within its district in addition to four garages. In the city’s 2016 Parking study, it was calculated that the Urban Core had a total of 20,853 spaces of which 4,413 spaces (21%) are on-street parking-both marked and unmarked spaces.
Figure 47 Major Paved Areas and Garages

Figure 48 Major Paved Areas and Garages – Urban Core
3.4 Crashes
Crash data analyzed from 2019 - 2023 was provided by Signal 4 Analytics. The highest crash densities occur along the East/West corridors of W Cervantes St, portions of E Cervantes St, W Garden St, E Gregory St, and E Chase St. The highest numbers of fatalities and serious injuries occurring in disadvantaged communities.
Figure 49 Crash Density and Pedestrian/Bicycle Severity Map

4 Equity
The United States Department of Transportation, as part of the Justice40 initiative, defines Disadvantaged Communities as those that experience a cumulative burden or are underserved across eight categories: climate change, energy, health, housing, legacy pollution, transportation, water and wastewater, and workforce development. The Climate and Environmental Justice Screening Tool (CEJST) shows the composite scoring under these eight categories as shown on Figure 50.
Figure 50 Justice40 Disadvantaged Communities 2022

The USDOT Equitable Transportation Community (ETC) tool then filters out five of the eight categories for a more detailed understanding of the data as seen on Figure 51 and listed below:
• Transportation Insecurity
• Health Vulnerability
• Environmental Burden
• Social Vulnerability
• Climate & Disaster Risk Burden
In this section, the disadvantage communities will be discussed in more specificity and will focus on the ETC data. It is worth noting, that for the purposes of applying for any USDOT Justice40 program the CEJST should be used as the primary tool to identify disadvantaged communities The maps shown throughout the existing conditions analysis, where appropriate, are shown with the CEJST data as a layer.
Figure 51 ETC Disadvantaged Communities

The City of Pensacola’s composite score ETC results based on State average shows the following breakdown across the five components:
Figure 52 City of Pensacola ETC Composite Scores State Percentile

Source: USDOT ETC
The City of Pensacola has 54% of census tracts considered to be disadvantaged communities based on composite scores across the five components.
4.1 Transportation Insecurity
Under transportation insecurity there are three measures that determine a composite score for each indicator: Transportation Cost Burden, Transportation Access and Transportation Safety. USDOT states that “Transportation insecurity occurs when people are unable to get to where they need to go to meet the needs of their daily life regularly, reliably, and safely. Nationally, there are well-established policies and programs that aim to address food insecurity and housing insecurity, but not transportation insecurity. A growing body of research indicates that transportation insecurity is a significant factor in persistent poverty.” 9
9 Three Major Components of DOT’s Justice40 Initiative | US Department of Transportation

Source:
For Transportation Insecurity while the city under this category does not reach the level of being disadvantaged, there are pockets of census tracts with high percentile rank indicators of transportation cost burden followed by traffic safety. Further breakdown shows tracks that include the Eastside District rank in the 99th percentile for transportation cost burden as compared to the 63% city percentile rank Some of the Urban Core census tracts under overall disadvantage show 79th percentile rank for transportation cost burden and 75th percentile rank for traffic safety as compared to the 46% city percentile rank Census tracts in some of the Westside district show the highest percentile of 99th and 96th percentile rank for transportation cost burden and traffic safety respectively as compared to the 54% city percentile rank
4.2 Environmental Characteristics
Flood prone areas are a major concern and problem for residents across the CRA districts. Flooding has significant impact on daily life and economic prosperity. Stormwater flood-prone areas are primarily along major roadways in Westside and Urban Core while on the Eastside, flooding occurs primarily under I-110 as shown in Figure 54 Section 4.3 further discusses the impact of impervious areas on equity. A map showing the overlap that exists between major paved areas (surface parking) and the location of these flood-prone areas is shown in Figure 55
Typical flooding issues in the CRA districts are caused by a variety of factors such as:
• Lack of storm drain infrastructure
• Undersized storm drain infrastructure
• Infrastructure which is damaged or has exceeded service life
• Quantity of impervious surfaces which were mostly constructed before formal state stormwater rules were in effect
• Tailwater elevation in areas within a few blocks of the waterfront
• Recent flooding/natural disasters and more intense rainfall events over the last two decades.
Figure 53 City of Pensacola ETC Transportation Insecurity Percentile Rank
USDOT ETC
Since most of the CRA districts are highly developed with areas downstream highly developed, the cost of implementing strategies that would address these issues are extremely high and take many years to fund. In many cases, government must weigh cost feasible alternatives to major infrastructure projects such as the construction of regional stormwater ponds, construction of floodable public space, and acquisition of property with repetitive flooding issues.

Pensacola
Figure 54 Flood-Prone Areas
4.3 Impervious Areas
One of the five components measured to understand equity in communities is Climate & Disaster Risk Burden. Under this component there are three indicators, one of which is impervious surfaces (from land cover). Per USDOT’s technical documentation for the Equitable Transportation Community (ETC), “impervious surfaces, such as roads and parking lots, can have a variety of negative consequences, especially in communities that are already disproportionately exposed to environmental burdens. These surfaces generate and amplify heat islands, resulting in poor air quality and an increased risk of heat-related illnesses and death ”
Based on the USDOT ETC data, census tracts that includes the Westside District show in the 77th percentile rank for impervious surfaces, Urban Core census tracts show it is in the 61st percentile rank, and Eastside census tracts show it is in 92nd percentile rank.
Parking being a major contributor to impervious areas, the breakdown of major paved areas (surface parking) is as follows:
Across the three CRA districts, there are approximately 333 acres of major paved (surface parking) areas equivalent to approximately 711 areas, with an average size of .40 acres. Location of these areas are primarily along major commercial corridors and where flood-prone areas exist as seen in Figure 55.
Table 1. CRA District Major Paved Areas

4.4 Transit
Escambia County runs the only transit service in the area. There are a total of six routes, most of which cover the urban core but provide less coverage in the Westside and Eastside. Figure 56 USDOT Transportation Disadvantaged Communities and Transit

5 Community Input
Below is a high-level summary of the input received from various public workshops. The community’s experience regarding mobility and accessibility further supports the data analyzed and described in previous sections of this document.
Challenges
• Intersections are unsafe for bike/ ped crossing
• Speeding vehicles
• Lack of maintenance on existing pedestrian flashing crosswalk lights
• Lack of pedestrian crosswalks
• Lack of maintenance on existing sidewalks
• Lack of sidewalks
• Lack of protected space or roadways that accommodate pedestrians and bicycles and connect them across all districts and neighborhoods
Strengths
• New streetscape in South DeVillers
• Streetscape on Government Street
• Beach Trolley Opportunities
• Pedestrian separated walkways/bridges to cross dangerous arterials
• Optimize the use of what has already been built
• Take inventory of unused or underutilized properties
• Lack of places to walk to i.e., restaurants or stores (Westside)
• Flooding issues are a big challenge
• Many underutilized parking lots
• Vehicle dominated streets make pedestrians and bicyclist feel unsafe
• Roadways that are the most unsafe or are barriers in districts are State roads
• Expand Longhollow stormwater pond with under-utilized properties around it
• Create a Mobility Hub that better connects bus, micro transit, ferry, Historic District, Palafox, and commercial areas
6 Planned Transportation Improvements
Several roadways within the CRA districts were found to have improvements planned for the coming years or are currently undergoing improvements The following section summarizes key documents listed in the Reference section.
6.1 City of Pensacola Capital Improvement Program
A capital improvement program (CIP) is the funding of construction, major repair, or purchase of capital items such as roadways, bridges, and buildings. This program is typically a five-year horizon of which the first year is the entity’s capital budget. The capital budget is adopted and implemented. The CIP considers community needs, financial capability, and future needs in determining which projects are placed in the program. It is the most influential tool by which to shape the quality and types of projects a city undertakes. Figure 57 is a map illustrating these improvements, as obtained from the city data at the time of this report The projects shown are categorized by the current phase of the project. CRA projects are shown with an outline.

CRA Bruce Beach Park
CRA
CRA
CRA
Figure 57
City
CRA DeVilliers Streetscape Revitalization - Phase 2
CRA Bruce Beach Park Improvements - Phase 2
Complete Summer 2021
Construction Fall 2024
CRA West Garden Street Landscape Beautification Project: A to C Design TBD
CRA Alice Williams Rehabilitation Project Planning TBD
CRA East Garden District Streetscape
CRA Reus St Revitalization Project Phase 1
Complete Summer 2022
Complete Summer 2021
CRA East Garden Street Landscape Beautification Project: Alcaniz to A Complete Summer 2022
6.2 Florida/Alabama Transportation Planning Organization Long Range Transportation Plan
The 2045 Long Range Transportation Plan (LRTP) for the Florida-Alabama Transportation Planning Organization (FL-AL TPO) outlines the 25-year vision for transportation in the region, which includes Escambia and Santa Rosa Counties in Florida, and Baldwin County in Alabama. The LRTP establishes goals and allocated projected revenues to transportation programs and projects. The plan addresses both the region’s current and future transportation needs.
The transportation projects in the plan are grouped into five key categories:
• Capacity Projects: Adding lanes and improving road capacity.
• Complete Streets/ Corridor Projects: Enhancing streets for all users
• Intersection Projects: Improving intersections for better traffic flow and safety.
• Transit Projects: Enhancing bus services and expanding transit infrastructure.
• Bicycle/Pedestrian Projects: Expanding bike lanes, sidewalks, and multi-use paths.

Palafox St
Fairfield, Cervantes, SB Hayne St, Maxwell, Guillemard St
Yonge, Maxwell, Blunt, Wright St
6.3 Active Transportation Plan
The ATP was adopted by the City of Pensacola August 2023. The ATP prioritizes reducing trafficrelated fatalities and injuries, endorsing a Vision Zero approach, which aims for zero fatalities.
The plan also emphasizes filling gaps in the transportation network, linking key destinations such as schools, parks, and commercial areas. The goal is to accommodate all community members, and encourage alternative transportation modes to car travel.
The ATP creates a Future Network framework that includes three categories of pedestrian and bicycle focused infrastructure:
• Neighborhood Greenways
• Bike Routes
• Trails
The future network design recommendations include using context-sensitive designs to make streets safer and more accessible based on their location (urban, suburban, etc.), using countermeasures to calm traffic and improve crossings and expand the bicycle network.

Figure 59 ATP Future Network
Luther
W Gregory St N A St N Palafox St
Core, Westside E Cross St E Cross St N 14th St
E Government St S A St S 9th Ave
Greenway
Table 4. ATP Future Network – CRA Districts
6.4 Escambia County Area Transit -Transit Development Plan (TDP), 2022 - 2031
The TDP is a 10-year planning document required by the Florida Department of Transportation (FDOT) to guide the development of transit systems. It covers the period from 2022 to 2031 and includes short-term and long-term strategies and goals for transit in Escambia County. ECAT serves an area of approximately 189 square miles, primarily within Escambia County, and includes connections to Santa Rosa County. The system operates over 1,000 stops with 285 miles of routes and serves more than 1.5 million annual passenger trips.
As part of the TDP, the Comprehensive Operations Analysis (COA) concluded that major changes to the system was needed to improve overall performance given that the population is expected to grow by 9.7% by 2030, with significant transit needs in urban areas. Major improvements include:
• Extended weekend services and extended hours
• Increased frequency on high demand routes, among them within the CRA boundaries are Routes 52 and 55 as shown in Figure 60
• Late night service
• Bus stop upgrades in high need areas
• Service to new areas with improved connectivity through enhanced first and last mile services or mobility on demand services which are nimbler and more flexible and provide greater coverage within districts

6.5 MLK and Davis Conversion Feasibility Study
The feasibility study analyzed the ability to convert MLK Drive/Alcaniz Street and Davis Highway from their current one-way pair configuration to two-way traffic. The purpose is to improve general safety and restore the neighborhood roadway network grid in the Eastside Community Redevelopment Area. Currently, SR 291 (Davis Highway northbound, MLK Drive/Alcaniz Street southbound) is configured as two one-way pairs over a 2.2-mile stretch between Fairfield Drive and E. Wright Street. Recommendations are summarized as follows:
• Southern Tie-in at Wright Street: Intersection improvements, including potential signalization and pedestrian enhancements, are recommended to address safety concerns.
• Cervantes Street and Texar Drive: Additional turn lanes and traffic management measures are proposed to improve traffic flow.
Figure 60 ECAT Proposed Improved Routes in CRA Districts
• Magee Field: Several pedestrian safety improvements, including raised crosswalks and speed advisories, are recommended around Magee Field.
• Speed Limit: A 30 mph speed limit is recommended throughout the corridor.
• Lighting and Sidewalks: Enhanced LED lighting and the completion of sidewalk gaps are suggested to improve safety, especially for pedestrians.
• Signal Modifications: Adjustments to traffic signals to accommodate two-way traffic are necessary, along with additional signage to discourage wrong-way travel if the conversion is not implemented.
The study concluded that converting the corridors to two-way traffic with the proposed improvements would enhance safety and restore the neighborhood’s roadway network.
6.6 Pensacola Waterfront Framework Plan
The framework plan focuses on creating Pensacola’s downtown waterfront as a more inclusive, connected, and resilient space. The Plan identifies two key catalytic projects, Bruce Beach and the Hashtag Connector (Figure 61): The Hashtag Connector is focused linking four major streets Palafox, Jefferson, Main, and Cedar. The goal is to focus on mobility and connectivity that will enhance the downtown and waterfront area by supporting a complete bike and pedestrian network and streetscape improvements It is projected to be a three phase process with:
• Initial phase (0-3 years): Immediate projects focus on creating pop-up parks, minor streetscape improvements, and temporary installations that activate public spaces and draw people to the waterfront
• Intermediate Phase (3-8 years): More permanent infrastructure upgrades will be implemented, such as protected bike lanes, shared streets, and expanded public spaces
• Long-Term (8+ years): Major infrastructure and development projects

Figure 61 Waterfront Framework Plan - Hashtag Connector
Source: SCAPE
References
A review was completed to map any planned or programmed roadway improvements in the three districts Sources consulted, but not an exhaustive list, includes the following:
• FL-AL Transportation Planning Organization (FL-AL TPO) 2045 Long-Range Transportation Plan 2045 LRTP
o Fl-AL TPO Priorities DRAFT Transportation Project Priorities. TPO Transportation Priorities FY2026-2030
o FL-AL TPO Bike Ped Plan FL-AL TPO Bike/Ped Plan
• FDOT Work Program FDOT OWPB - WP Reports; 5 Year Work Program (state.fl.us); Work Program - Current (arcgis.com)
• Cervantes Street Traffic Feasibility Study West_Cervantes_Street_Lane_Reduction_Traffic Feasibility Study_20190913.pdf (ecrc.org)
• Davis / MLK / Alcaniz Two-Way Conversion Traffic Feasibility Study MLK-Davis_final report_06 19 20.pdf (ecrc.org)
• W. Cervantes Corridor Plan West_Cervantes_CMP_FINAL.indd (ecrc.org)
• E. Cervantes Corridor Plan East_Cervantes_Corridor_Management_Plan_Final.pdf (ecrc.org)
• Main Street Corridor Plan Main St Report_portrait_07172014.indd (ecrc.org)
• N. Palafox Street Corridor Plan North_Palafox_Street_Corridor_Management_Plan_Final_Adopted.pdf (ecrc.org)
• ECAT Transit Development Plan Escambia County Area Transit (ecrc.org)
• City of Pensacola Active Transportation Plan Active Transportation Plan | City of Pensacola Active Transportation Plan | City of Pensacola, Florida Official Website
o Gonzalez Street Shareway (as referenced in city’s Active Transportation Plan)
• Reimagine Jackson Reimagine Jackson Street | City of Pensacola Reimagine Jackson Street | City of Pensacola, Florida Official Website
• CRA projects| City of Pensacola CRA Projects | City of Pensacola, Florida Official Website
• Transportation Alternative (TA) Projects:
o E. Maxwell Street sidewalks Pensacola - E Maxwell St Sidewalk TA Application.pdf (ecrc.org)
o N. J Street sidewalks Pensacola - North J St Sidewalk TA Application.pdf (ecrc.org)
o Hollice T Williams Multi Use Path Pensacola - TA Hollice T Williams MUP Phase 2 Application.pdf (ecrc.org)