W
W
W
W
W
Suggested Citation: United Planning Organization. 2024. 2024 Uniting people with opportunities report: a DC needs assessment
W
W
W
W
W
Suggested Citation: United Planning Organization. 2024. 2024 Uniting people with opportunities report: a DC needs assessment

UPO’s 2024 Uniting People with Opportunities Report: a DC Needs Assessment will be the guiding force that will lead UPO to its vision of Washington, DC: “a city of thriving communities and self-sufficient residents.” The community needs assessment will serve as a tool that UPO uses to achieve that vision, through the assessment of current needs, programs, and issues impacting low-income residents.
UPO is grateful for the input from the communities we serve along with our community partners, which includes government agencies, businesses, and other stakeholders. UPO has and will continue to collaborate with our partners across the city to ensure a better understanding of community needs, while also diagnosing the systemic barriers that prevent low-income residents from achieving economic security. Input that reflects the diversity of District residents is incorporated into this needs assessment to capture the varying experiences and opinions of District residents.
Like the community needs assessments that have come before, the 2024 community needs assessment provides background research, innovative qualitative and quantitative analysis, as well as the identification of trends. The assessment also includes recommendations to improve low-income residents’ access to resources needed to attain economic security. The assessment offers insights into how UPO targets its resources appropriately and where necessary. As new problems emerge, UPO will be on the forefront of innovative program development and resource distribution.
The UPO Board of Directors is proud to serve residents of the District of Columbia. Made up of a diverse group of District residents who are mayoral appointees, elected members, and private sector representatives, the Board uses its collective and individual knowledge and experience to govern an agency that has become an institution in the District of Columbia. We will continue to prioritize the inclusion and maximum feasible participation of residents with low incomes in agency decisions through our board leadership. Accountability to the community and our constituency have allowed us to stand the test of time in this great city.
On behalf of the UPO Board, I am grateful to serve an organization like UPO in our city, and I look forward to seeing a thriving community of economically secure residents.

Since the release of our 2021 Community Assessment, the District of Columbia has entered a pivotal transitory period where residents, community organizations and leaders are rethinking the future of our city since the height of the COVID-19 pandemic. For this reason, we are excited to deliver our tri-annual, 2024 Uniting People with Opportunities Report: A DC Needs Assessment, which highlights the struggles and triumphs of low-income residents in the District. UPO conversed with stakeholders throughout the city through surveys, interviews and focus groups to gain understanding. The qualitative and quantitative data collected will serve as the cornerstone of UPO’s advocacy pursuits and program development. Public feedback is an essential process for the organization, as residents and former customers play an integral role in defining UPO’s work.
Surveys, interviews and focus groups were conducted both virtually and in-person, providing unique insights into the needs of struggling communities across the District. Throughout this report, UPO provides high quality research on the barriers surrounding poverty, the needs forming as a result of those barriers, and potential solutions to help residents with low-income to achieve economic security in overcoming their personal barriers. Over the past three years, UPO has continued to aid individuals seeking a better life through life changing programs and community support. With the insight provided by the 2024 community assessment, UPO will use the community feedback and guidance to assess our programs’ effectiveness at removing systemic barriers preventing low-income residents from achieving economic growth and security.
UPO has grown into one of the District’s largest poverty fighting organizations through our established connections with low-income communities, community partners, and local leaders. Our dedication to community-based advocacy and grassroots mobilization has helped policy makers and community organizations identify key issues facing low-income residents. We hope to use our extensive and inclusive collaborations to advocate for policies that directly eliminate the systemic barriers facing our customers.
I hope that this needs assessment highlights both the struggles and triumphs experienced by the communities we serve. We will continue to serve our customers with high quality programming and wrap around services that are proven to make an impact.
UPO would like to acknowledge the contributions to this report made by UPO staff including UPO’s Social Science Research Analyst, Connor Zielinski, under the direction of the Office of Resource Development and Research, Kevin Bryant. Additional support was provided by UPO staff and direction of the Office of the Executive Vice President and Chief Impact Officer; the Community Impact Division; the Office of Performance Management; and the Division of Advocacy and Volunteerism, among other staff persons of UPO offices and divisions.
UPO would also like to acknowledge the many DC residents who participated in focus groups and completed surveys for this needs assessment. For a complete list of contributing staff, volunteers and partners, see the Appendix.
The District of Columbia has had two years to recover from the COVID-19 pandemic. Despite the pandemic waning in the public’s mind, COVID-19 has left a lasting impact on the District. Those who are experiencing poverty are now struggling more than ever, as the city currently gripes with a weaker economic forecast in the upcoming years. However, even with a potential economic downturn looming, the District continues to get richer. Over the past three years, the median income of a DC household of four has increased and now sits above $100,000 a year. For reference, the average household of four across the country is $70,000. Yet, that economic growth is not distributed equally across the District.
Poverty in the District is a direct result of systemic forces limiting the potential economic security of Black and Brown residents. At every turn, the District has barriers preventing socioeconomic equality between residents. Behind poverty are historical forces such as discrimination, systemic racism, social inequality, vulnerability due to health status, adverse experiences and economic changes. Despite poverty rates generally declining within the District, poverty is still an existential challenge that has only become harder to overcome, especially for Black and Brown residents. For example, the unemployment rate for white residents has never increased over four percent. The unemployment rate for Black and Brown residents has never fallen below 8%. The disparity between economic outcomes between white and Black and Brown residents has been well documented and the problem continues to persist after the pandemic. Research presented in this community assessment highlights trends that reveal the state of poverty in the District, the essential needs of District residents that are not currently being met,
and the ways UPO is working with families and communities to help them achieve economic security.
As the District of Columbia’s sole Community Action Agency, UPO is responsible for helping all residents with no or low incomes meet their needs and work towards economic security. UPO is also accountable to the federal government through the requirements of the Community Services Block Grant (CSGB).
Results-Oriented Management and Accountability (ROMA) was introduced as the community action network’s response to the Government Performance and Results Act (GPRA) and comprises practices that are now a part of the 1994 amendment to the Community Services Block Grant Act. The amendment specifically requires that CSBG-eligible organizations like UPO provide “A description of outcome measures to be used to monitor success in promoting individual and family economic security, and community revitalization.” These three areas are articulated in the three overarching goals of Community Action, as described by the National Community Action Network Theory of Change:
Goal1: Individuals and families with low incomes are stable and achieve economic security.
Goal2: Community where people with low incomes live are healthy and offer economic opportunity
Goal3: People with low incomes are engaged and active in building opportunities in communities.
As part of the ROMA framework, Community Action Agencies identify and address all needs by three levels at which they belong, namely:
Family level need
Community-level need
Agency-level need
Every three years, the United Planning Organization must complete a Community Assessment (CA). The CA will shape the future direction of the organization by informing staff, managers and executives about key trends that are developing across communities that are facing poverty. Moreover, the CA will inform UPO of the necessary programs and activities that are essential for aiding struggling communities. The assessment’s focus on identifying both the needs and
resources that communities experiencing poverty require will help determine the appropriate resource allocation necessary for future supports.
In conducting the assessment, community needs and resources are examined. The 2024 Community Assessment will:
AlignUPO’sprogramswithidentifiedneedsofDCresidents;
AdvanceUPO’sgoalofassistingDCresidentstobecomeeconomicallysecure;
ImprovecommunicationbetweenthecommunityandUPO;and
AchieveUPO’srequirementofatri-annualassessment
To accomplish these goals, UPO conducted surveys, held focus groups, and interviewed residents living in high poverty areas across the District. Additionally, UPO internally surveyed frontline staff, managers, directors and executive staff. The structed process ensured community and customer input in identifying critical needs. The 2024 Community Needs Assessment includes, data, literature reviews, focus group analysis and interviews to determine the necessary services to assist residents, specifically residents with low incomes. The Community Assessment will be updated annually and repeated every three years.
This assessment meets the requirements for section 676 (b) (11) of the CSBG Act and the goals set forth by Information Memorandum 49 from the Office of Community Services in the United States Department of Health and Human Services. For CSBG, the community assessment offers a focus on local conditions and causes of poverty and enables UPO to analyze the economic opportunities and barriers for all residents of the District of Columbia.
Community Action agencies are private non-profit or public organizations that were established under President Lyndon B. Johnson in 1964 to combat poverty. Status as a Community Action Agency (CAA) is the result of an explicit designation by the local or state government. The program was created to provide low-income people with the opportunity to access various resources in order to achieve their goals, become economically secure, and support their community by helping other people. Community Action Agencies have provided direct support for more than 34 million people in need per year for several decades.
A CAA involves the low-income population it serves in the planning, administration, and evaluation of its programs. A CAA carries out its mission through a variety of means including:
1. Community-wide assessment of needs and strengths
2. Comprehensive anti-poverty plans and strategies
3. A broad range of direct services
4. Mobilization of financial and non-financial resources
5. Advocacy on behalf of low-income people
6. Partnerships with other community-based organizations to eliminate poverty or address specific needs of the community.
For over 60 years, the United Planning Organization (UPO) has stood at the forefront of the community action movement in the District of Columbia – uniting people with opportunities to help support themselves and each other.
This Community Needs Assessment, conducted by the United Planning Organization (UPO) for 2024, provides an in-depth look at the systemic barriers, socioeconomic trends, and critical needs of low-income residents across Washington, D.C. The study's findings span across governance, safety, education, systemic barriers, housing, environment, and employment sectors. Key findings and recommendations are summarized below.
On average, 2024 Community Assessment Survey respondents were predominantly single, Black, female-identifying individuals between the ages of 35-44, living alone. The average respondent had obtained their high school diploma or GED. Respondents, typically, made less than $10,000 a year, paying less than $800 a month in rent, and were unemployed.
The number one barrier preventing individuals from seeking help was a lack of information about where to go for help. Moreover, inadequate transportation was a major hurdle for some residents to overcome.
Concerns about crime and affordable housing throughout the District were reported throughout all focus groups.
The District is still a city divided by systemic inequities, disproportionately impacting Black and Brown residents. For example, white households hold 81 times more wealth than Black and Brown residents.
Disparities exist between Wards as well. Ward 3 residents were more likely to report higher levels of income compared to residents in Wards 5, 6, 7 and 8.
Rent continues to burden many low-income families across the District. As of 2024, minimum wage workers would have to work 79 hours a week to afford a studio apartment to not be considered rent burdened.
Juvenile criminal activity was a considerable issue for many residents, particularly those above the age of 45. Ultimately, the rise of juvenile violence in the District during 2023 can be contributed to the retreat of progressive programs supporting families, such as ERAP or TANF.
Need for Policy Advocacy: Persistent disparities exist, especially for Black and Brown residents, highlighting the need for targeted advocacy and policy reform.
Community Engagement: Residents expressed a desire for more inclusive decision-making processes within governance structures.
Increased Crime Concerns: Community feedback points to significant safety concerns, particularly around juvenile crime, linked to economic instability and reduced social support programs.
Police Interaction: Experiences with law enforcement are mixed, with some communities noting a lack of respect and responsiveness.
Resource Disparities: Schools in lower-income Wards face significant resource shortages, affecting educational quality and outcomes.
Barriers to Access: Limited access to affordable and high-quality early childhood programs impacts many families, particularly those in Wards 7 and 8.
Racial Wealth Gap: The wealth disparity is stark, with white households holding 81 times more wealth than Black and Brown households. This economic
divide affects access to resources and opportunities for many low-income families.
Information and Access Gaps: Many residents lack awareness of available services, and inadequate transportation further limits access to support.
Affordable Housing Crisis: Rent burden is severe, especially for those on minimum wage. A worker earning minimum wage must work 79 hours per week to afford a studio apartment.
Community Impact Zones: Designated areas such as Brentwood and Buzzard Point face chronic housing affordability issues, requiring focused intervention.
Job Placement Needs: Workforce development is critical, with a high demand for training programs in in-demand fields.
Barriers to Job Retention: High levels of underemployment persist, partially due to inadequate childcare and transportation challenges.
Governance: Strengthen community representation in local governance and promote transparency to address community concerns effectively.
Safety: Expand community-based programs to reduce juvenile crime and improve relationships between law enforcement and communities.
Education: Increase funding and resources to schools in underserved neighborhoods, particularly targeting early childhood education initiatives.
Address Systemic Barriers: Develop outreach programs to improve residents' awareness of available services and create more accessible transportation options. To alleviate the systemic and personal issues facing residents, UPO, its partners, and government entities should invest considerable energy in
grassroots campaigning and advocating for policies that benefit low-income residents, while providing wraparound services to those who need them.
Housing: Expand affordable housing initiatives and advocate for rent control measures in high-demand areas.
Employment: Invest in job training programs, particularly those that address the digital divide and provide support services such as childcare.
The United Planning Organization (UPO) was founded as a 501(c)(3) non-profit organization in 1962 and became the designated community action agency (CAA) for the District of Columbia in 1965. As one of our nation’s more than 1,000 CAAs, UPO is dedicated to helping Washington, DC residents with low incomes along their journeys to becoming economically secure. For nearly 60 years, UPO has been at the forefront of the war on poverty. As the catalyst for economic security and growth for all Washington, DC residents, UPO has laid the groundwork for innovative social service programs such as Early Head Start, workforce development training, and youth development, amongst many other programs.
Every day, UPO works tirelessly to embody its vision, mission, and promise for the people of the District of Columbia.
VISION: UPO’s Washington, DC: A city of thriving communities and self-sufficient residents
MISSION: Uniting People with Opportunities
UPO’s PROMISE: Community Action changes people’s lives, embodies the spirit of hope, improves communities, and makes America a better place to live. We care about the entire community, and we are dedicated to helping people help themselves and each other.
Ruthven Phillip, Esq (Chair)
Salim K. Adofo
Lafayette Barnes (Vice Chair) Shakira Hemphill
Michael Austin, Esq (Secretary) Josiane Yepmo
Barbara Bovbjerg (Treasurer) Reginald Black
Executive Team
Andrea Thomas, President and Chief Executive Officer
Nkosi Bradley, Esq
Christian Clanksy
Tonya Crawford
Loren Cox, Ph.D.
Rhonda N. Hamilton
Jennifer Park, Ph.D.
Christopher Sennett
Dorjan Short
Aron Szapiro
Robert Thorne
Dr. Christine M. Warnke
Daniel Ofori-Addo, Executive Vice President and Chief Impact Officer
Dianna Guinyard, Vice President of Operations and Chief Operating Officer
Rosalind Pinkey, Vice President of Human Resources
Theresa Lewis, Vice President of Legal Affairs and General Counsel
Andrew Harris, Vice President Finance & Chief Financial Officer
Hyvron Jean, Vice President, Technology & Information Systems
Syrita Robinson, Vice President Office Early Learning
Kevin Bryant, Director of Business Development and Asset Management
Disclaimer
The United Planning Organization (UPO) believes reasonable efforts have been made to ensure the accuracy of the information contained in this document. To ensure continued accuracy, the documents may be changed or updated without notice. Information contained in this document is intended for discussion and educational purposes only and is provided as is without warranty of any kind. Presentation or reference to information provided is at the user’s own risk.
UPO and its contributors hereby disclaim all warranties and conditions regarding this information and all related graphics. Photographic images contained herein are strictly for educational purposes and not for profit. Organizations and individuals contributing to this document may have been mistakenly omitted. The listing of organizations or references does not imply any endorsement or partnership with UPO.
Tables and figures were prepared using U.S. census data, other secondary sources, and UPO primary sources to make projections and draw inferences. These tables and figures are provided for use as the official numbers on population and selected demographics. Other figures tracked by credible independent sources are provided in the narrative and may also be accurate, though not official. Any opinions and views-actual or perceived- expressed from those sources do not necessarily reflect the views and opinions of the United Planning Organization.
For the 2024 Community Needs Assessment, UPO collected demographic information from a statistically representative sample size in the District. This was accomplished by using statistically proven survey collection methods as well as qualitative data collection efforts from several focus groups and targeted interviews across the District. Through the methods listed above, UPO collected information that best reflects a representative sample of residents and stakeholders in the District including residents with low-incomes.
To collect a statistically representative sample, UPO utilized cluster sampling and randomization in distributing the Community Assessment survey. First, UPO identified lowincome neighborhoods in the District through both census data and UPO’s own experience within communities. Census tracts that had a poverty rate of 20% or higher for over ten years was targeted to receive the survey. Once the census tracts were identified, UPO used the publicly available Master Address Repository (MAR) to identify households and apartments located within the selected census tracts. Upon confirmation with the Office of Zoning that develops the MAR that the data was up-to-date, UPO began the data cleaning process, removing unoccupied housing units or units currently being developed. Once the data set had been cleaned, UPO randomly selected 2,500 single family or multifamily homes and 2,500 apartments within the selected communities. Apartment information is also publicly available online through the MAR, which lists the unit numbers within the apartments. Five thousand housing units were selected as part of UPO’s mail survey campaign, earmarking a 20% response rate, with an attached $10 incentive for completing the survey. Data was collected through the Question Pro software and was cleaned for accuracy. After the closing of the survey, the response rate was 7%.
UPO recognized that it was also important to focus collecting information from its designated Community Impact Zones (CIZs). The neighborhoods of Brentwood, Marshall Heights,
Washington Highlands and Buzzard Point have been designated by UPO as CIZ zones due to their high rates of crime, poverty and unemployment. By focusing survey efforts on CIZs, UPO collected information about residents that UPO works with directly, while simultaneously identifying issues with poverty city wide through the mail-in survey.
In tandem, residents who typically do not request UPO services (Wards 1, 2, 3 and 4) were subject to “boots on the ground” survey distribution. The process of collecting surveys through face-to-face interaction ensured that residents living in wards with low poverty rates were accounted for in the city-wide assessment.
In addition to collecting quantitative information about DC residents, UPO, in line with CSGB eligibility, held focus groups in all eight wards located in the District. UPO held focus groups for residents in the aforementioned CIZs, and more broadly, focus groups for Wards 1, 2, 3 and 4, where UPO does not have significant numbers of customers. In the ward groups, residents were asked about the political, social and economic developments ongoing in the District. The questions residents were asked can be found in the appendix of this report. Furthermore, other focus groups were conducted in line with CSGB eligibility, including religious leaders, educators, small business, individuals with disabilities, elderly, and non-profits.
In total, 18 focus groups were conducted between February 2024 and August 2024 in order to obtain residents’ perspectives about the District and to articulate their needs. One focus group was conducted for each Ward, for a total of eight. Additionally, focus groups were conducted with seniors, unhoused individuals, parents of children with behavioral issues, youth practitioners, faith-based leaders, educators, and small business owners. To understand the work-related needs of staff, managers, and executives, UPO held three internal focus groups.
Structured interviews were conducted to supplement the shortage of participating individuals in Wards 3, Wards 4, and for small business owners and faith-based leaders.
Focus groups were analyzed using the nVIVO qualitative analysis. Some focus group analyses may not include nVIVO data visualization.
A total of 1,012 residents responded to the survey. Residents filled out both the “boots on the ground” survey, email survey, and mail-in survey. To complete the boots on the ground survey, UPO worked with external organizations and internal staff persons to distribute the survey to customers and other members of the community. Some of the physical surveys were missing data points. These surveys were still completed in the final analysis.
Ward 1 66
Ward 2 47
Ward 3 23
Ward 4 51
Ward 5 103
Ward 6 92
Ward 7 248
Ward 8 311
Didn’t know/Unhoused 71
Because the mail-in surveys were sent city-wide but did not directly target individuals who have received UPO services before, the customer service portion of the survey received 322 responses.
UPO has very little presence in Wards 1, 2, 3 and 4. Moreover, these areas of the city are known for their wealth. An individual living in Ward 3 has a significantly higher chance than making more money than an individual living in Wards 5, 6, 7, and 8. Therefore, there are fewer communities in Wards 1, 2, 3, and 4 experiencing poverty or generational poverty.
The mail-in survey reflects a representative sample of the total population in one area. Even though the survey was sent in areas that had a 20% poverty level or higher, this did not mean that all individuals living in the area were experiencing poverty. As a result, the survey may account for higher levels of socio-economic diversity.
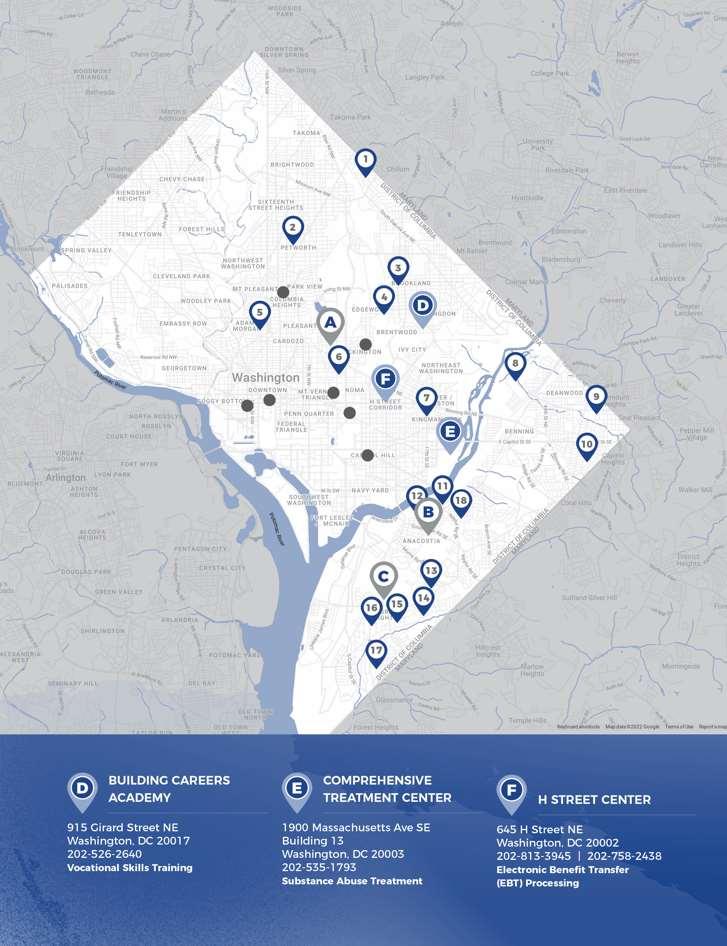
In developing the 2024 Community Assessment, UPO sought to produce a community focused, comprehensive document from which readers can extract free-standing sections.
The comprehensive report begins with the current Overview section, which introduces UPO, its staff, board and programs. Additionally, this section highlights changes since the last needs assessments and services provided to residents by UPO.
The Review of Literature details studies and city-wide analysis by third parties that focus on developments ongoing within the District. The topics range from city-wide issues to niche local issues.
A special section on Juvenile Crime seeks to explain the increase in juvenile crime, the political developments that have occurred around the increase in juvenile crime, and potential solutions to the issue.
A special section on Affordable Housing examines the need for greater affordable housing in the District, along with the reasons for why the District is experiencing a housing crisis in the first place.
A special section on Economic Mobility detailing the likelihood of an individual raised in DC chances to escape poverty if they were born into poverty themselves.
A special section on Digital Literacy and the Digital Divide highlights the struggles for some residents, particularly in poorer parts of the District, to obtain high speed internet broadband.
A special section on The Benefits Cliff focuses on the incentives for individuals who are on public support programs to avoid programs and initiatives that help them achieve economic mobility.
The survey results analyzing the results from the UPO Community Assessment Survey Results contains quantitative data collected from the survey from predominately low-income residents but does include responses from middle-income and high-income earners across the District. The section also details the results from UPO Focus Groups with varying individuals across the District.
Recommendations for Addressing City-Wide Needs covers educational, civic, social, physical and economic needs of residents for organizations such as UPO, government agencies and service providers to improve the quality of life for all residents in the District.
Agency Level Needs identifies key organizational needs for UPO.
The data collected from the Community Assessment Survey is organized on a ward-by-ward basis, detailing the specific needs of residents with each ward. Stakeholders may examine the data analysis and use it to formulate decisions that affect residents within a specific ward. This section will also detail recommendations for a specific ward.
Lastly, the data from the Community Assessment Survey is filtered by a resident’s location in a Community Impact Zone (CIZ), emphasizing the needs of residents in areas experiencing generational poverty.
Programs
The programs and services that UPO offers are listed below. In recent years, UPO has sought to increase the number of programs offered to residents in DC and beyond.
Advocacy
Affordable Housing Development
Child and Adult Care Food Program
Comprehensive Treatment Center (CTC)
CREATE After School Program
Culinary Arts Training
Early Head Start and Home Visiting Program
Electronic Benefits Transfer (EBT) Service Centers
Emergency Rental Assistance Program
Employment Placement Services
Foster Grandparent Program
Household Food Distribution
Housing Counseling
Joseph A. Beavers Scholarship Fund
Mental Health Counseling
Permanent Supportive Housing (PHS) Services
Providing Opportunities with Education Readiness (POWER)
Quality Improvement Network (QIN) Technical Assistance to Childcare Providers
Shelter Hotline
Shelter-Plus CARE (SPC)
Strengths-Based Family Worker Training
Summer Youth After-School Program
Volunteer Income Tax Assistance (VITA) Program
Volunteer Services
Workforce Institute: Training in 10 Credentialed, In-Demand Job Sectors
Youth Services
UPO serves all customers seeking assistance with a variety of appropriate and available services ranging from long-term case management to one-time referrals. The data outlined in this section reveals the number of services provided, by program, in the fiscal year of 2023. Each program is meant to satisfy two objectives: eliminating poverty and empowering residents to achieve economic security. The snapshot below is meant to illustrate the wide breadth of services that UPO provides.


161individualscametoUPOforSocial EmotionalLearningprogramming


123individualsparticipatedinUPO academicenrichmentclasses

Housing

136individualscametoUPOfor emergencyrentalassistance

80individualscametoUPOfordirect rentpayments


57individualscametoUPOforhousing supplies

37individualssignedupforUPOGED programs

579individualscametoUPOfor housingcasemanagementservices


82individualssignedupforUPO’s homemanagementclasses
87individualsparticipatedinsocialemotionallearningworkshops


340individualsenrolledinmental healthservicesandcounselling
388individualscalledUPOforcrisis intervention


251individualssignedupforUPO medicationandmonitoringprogram
147individualsenrolledinUPO’s groceryfooddistributionsystem

54individualsreceivedpreparedmeals

120individualscametoUPOforfree meals


21individualsenrolledinUPO’shealthy cookingclass
808individualscametoUPOfortax preparationprograms


289individualsenrolledinUPO’spostcoachingemploymentprogram
327individualsusedUPO’s transportationstipend


1,386individualscompletedUPO’s intakeprocess
The 2024 Community Assessment provides a representative sample size of resident demographics within the District and UPO locations. For this reason, UPO opted to emphasize statistically proven methods to collect data upon District residents. This involved the previously mentioned mail-in survey, including weighting the results of the survey more heavily than the “boots on the ground” survey distribution method and the email survey method. In 2021 due to the COVID-19 pandemic, UPO conducted an online survey. Despite reaching more people, UPO researchers found that the data had been breached by malicious actors attempting to spam the survey in order to receive incentives extended to respondents. As a result, much of the data had to be thoroughly cleaned. Moreover, because the survey was conducted online, the survey had self-selected residents who were of higher income.

The survey data collected in the 2024 Community Assessment Survey was more in line with UPO’s customer demographics, as UPO predominately focused on areas of the District which were experiencing generational poverty. Poverty disproportionately impacts Black and Brown residents, meaning a vast majority of the responses came from Black and Brown households. This is reflected by the ward data response rate as well. In 2024, UPO acquired more responses from Wards 7 and 8.
UPO is likely to have surveyed more individuals who had only completed their high school diploma, as residents who have not obtained a bachelor’s struggle to achieve employment and thus a living wage, to reside in high income areas. These areas are predominately in Wards 7 and 8.
Table 3: Survey Response: Health Coverage Comparison
Health insurance is also a predominant issue for low-income residents in the District. Nearly 77% of low-income DC residents rely on government health insurance programs to obtain basic medical care.
The income collected in 2024 was more representative of UPO’s customer base, than compared to 2021. UPO had received more survey responses from residents of lower-income, reflected by the table below. This report does not indicate that poverty has in fact increased in the District, rather, that UPO was able to obtain a more representative sample.
Table 4: Survey Response: Income Comparison
$0-$24,999
$25,000-$34,999
$35,000-$44,999
$50,000-$74,999
$75,000-$99,999
$100,000+
The high response rate of low-income residents from across the District drastically impacts other demographic information. For example, low-income residents across the District are less likely to own a home or pay a mortgage. This is also reflected in the responses of the 2024 Community Assessment.
Table 5: Survey Response: Household Situation Comparison
There is a significant gap in responses between homeowners and renters in the 2024 Community Assessment. Moreover, individuals who do not pay a mortgage constituted only 1% of total respondents, indicating that renters in the District have a higher chance of being lowincome.
Like many cities across the country, the District of Columbia saw a decline in total population during the COVID-19 pandemic. An estimated 20,000 individuals left the District from 2020 to 2022 according to the American Community Survey (total population decreased from 689,545 residents to 671,803 residents).1 Though publicly available data about those who left the District during this period, trends across the country indicate that small, wealthy families fled the District towards the perceived safety of the suburbs.
The largest segment of the population continues to be 25- to 34-year-olds, with 145,253 individuals.2 Though, this segment of the population also saw one of the largest decreases since 2020. The median age is 34.9 years old.3 Seniors (65+) only make 13% of the total population.4 Children under the age of 18 make up 18% of the total population.5 The percentage of seniors and children within the District has been stable since the pandemic. The male to female ratio expanded slightly in 2022. Currently, the population stands at 46.9% male and 53.1% female.6
The District of Columbia is the 6th largest Metropolitan Statistical Area (MSA) in the country. The city is divided into eight wards and further divided into 46 Advisory Neighborhood Commissions (ANCs), as of the 2022 redistricting.7 Additionally, the District has over 200 census tracts, which are small geographic areas defined for collecting and reporting census data from the U.S. census. These census tracts can be aggregated by several other geographic boundaries such as wards or police service areas (PSA). Data reported in this Community Assessment reflects the needs of Washington, DC residents and may include city-wide, wardlevel, or census tract data.
1 U.S. Census Bureau. (2023). American community survey 1-year estimates. Table DP05.
2 U.S. Census Bureau. (2023). American community survey 1-year estimates. Table DP05.
3 U.S. Census Bureau. (2023). American community survey 1-year estimates. Table DP05.
4 U.S. Census Bureau. (2023). American community survey 1-year estimates. Table DP05.
5 U.S. Census Bureau. (2023). American community survey 1-year estimates. Table DP05.
6 U.S. Census Bureau. (2023). American community survey 1-year estimates. Table DP05.
7 DC.gov. 2023. Advisory Neighborhood Commissions. Retrieved on September 14, 2023 from https://anc.dc.gov/page/about-ancs
Wards are purposely designed to house an evenly distributed number of households. Currently, each ward has a population between 80,000 and 90,000 people. The new boundaries for DC Wards took effect in January of 2022.
The racial composition in the District has changed drastically over the past twenty years. The population percentage gap between Black and white population has been decreasing rapidly as a result of gentrification and limited affordable housing. In 2020, Black residents made up 41.4% of the population while white residents made up 39.6%. In 2022, the gap between the two populations grew slightly, with Black residents composing 42.1% of the population and whites composing 38.4%.8 The changes in racial distribution in the District can be attributed to the shrinking population as the District becomes more unaffordable as well as the COVID-19 pandemic.
The Hispanic population of the District has remained stable throughout the pandemic, sitting at 11.7%.9 The number of individuals who identify as having two or more races has increased to 10.2% of the total population.10
Like many cities across the country, the District of Columbia saw a decline in total population during the COVID-19 pandemic. An estimated 20,000 individuals left the District from 2020 to 2022 according to the American Community Survey (total population decreased from 689,545 residents to 671,803 residents).11 Though publicly available data about those who left the District during this period, trends across the country indicate that small, wealthy families fled the District towards the perceived safety of the suburbs.
The largest segment of the population continues to be 25- to 34-year-olds, with 145,253 individuals.12 Though, this segment of the population also saw one of the largest decreases since 2020. The median age is 34.9 years old.13 Seniors (65+) only make up a small percentage of the District of 13%.14 Children under the age of 18 make up 18% of the total population.15 The percentage of seniors and children within the District has been stable since the pandemic. The
8 U.S. Census Bureau. 2023. American community survey 1-year estimates. Table DP05.
9 U.S. Census Bureau. 2023. American community survey 1-year estimates. Table DP05.
10 U.S. Census Bureau. 2023. American community survey 1-year estimates. Table DP05.
11 U.S. Census Bureau. (2023). American community survey 1-year estimates. Table DP05.
12 U.S. Census Bureau. 2023. American community survey 1-year estimates. Table DP05.
13 U.S. Census Bureau. 2023. American community survey 1-year estimates. Table DP05.
14 U.S. Census Bureau. 2023. American community survey 1-year estimates. Table DP05.
15 U.S. Census Bureau. 2023. American community survey 1-year estimates. Table DP05.
male to female ratio expanded slightly in 2022. Currently, the population stands at 46.9% male and 53.1% female.
Though the District has seen record economic growth in the past decade, the city experiences high levels of inequality and unemployment. Barriers to economic security are not based upon individual effort, rather, systemic barriers prevent communities or individuals from seeing potential economic gains. Economic mobility and economic inequality have a strong correlation. To ensure all communities have access to equal opportunities, the District must address problems in communities that are struggling in obtaining economic security. Typically, struggling communities are inhabited by people of color who have been systematically discriminated against through segregation policies, redlining and urban renewal.
In the DMV region, the District exhibited the largest negative racial disparities in employment, income and poverty.16 White residents have a median household income of $141,650, nearly three times as high as the median household income for Black residents of $45,072.17 Debt is also not evenly distributed across the District. Poorer, historically Black communities east of the Anacostia River are twice as likely to have delinquent debt.18 Nearly 50% of the residents in Wards 7 and 8 have delinquent debt. With higher levels of debt and lower levels of income, poorer residents are also more likely to have difficulty recovering from economic shocks or an unplanned expense. The Urban Institute estimates that only 42% of households east of the Anacostia River have at least $2,000 in savings, compared to 70-89% of the rest of the city.19
Because of the systemic financial economic constraints placed upon poorer communities, Black and Brown residents are more likely to face generational poverty. Black households are more likely to have higher levels of debt and lower levels of income, meaning there is less opportunity
16 Busette & Elizondo. 2022. Economic disparities in the Washington, D.C. metro region provide opportunities for policy action. Brookings. Retrieved on September 1, 2023 from https://www.brookings.edu/articles/economic-disparities-in-the-washington-d-cmetro-region-provide-opportunities-for-policy-action/.
17 Busette & Elizondo. 2022. Economic disparities in the Washington, D.C. metro region provide opportunities for policy action. Brookings. Retrieved on September 1, 2023 from https://www.brookings.edu/articles/economic-disparities-in-the-washington-d-cmetro-region-provide-opportunities-for-policy-action/.
18 Santillo et al. 2022. Washington, DC, has glaring financial health inequities. So do most American cities. The Urban Institute. Retrieved on September 1, 2023 from https://www.urban.org/urban-wire/washington-dc-has-glaring-financial-health-inequitiesso-do-most-american-cities
19 Santillo et al. 2022. Washington, DC, has glaring financial health inequities. So do most American cities. The Urban Institute. Retrieved on September 1, 2023 from https://www.urban.org/urban-wire/washington-dc-has-glaring-financial-health-inequitiesso-do-most-american-cities
to invest and transfer wealth generationally. White households in Wards 2, 3 and 4 have a net worth 65 times higher than Black households residing in Wards 7 and 8.20
The scale of the District’s income inequality can also be measured using the Gini coefficient. A score of 0.0 on the Gini index would indicate perfect equality in income distribution, whereas a score of 1.0 would indicate total inequality. The District has the second highest level of inequality in the country, behind Puerto Rico, with a score of .53.21 Though this statistic may be alarming, it is difficult to compare the District, a diverse city, to large states across the country. When compared to other cities across the country, like New York City, D.C. is only slightly more unequal.22
Income inequality within the District is quite pronounced, and disproportionately affects residents of color. To lower economic inequality, the District must promote opportunities to residents to escape poverty and achieve economic security, while redistributing resources to low-income communities.
High levels of income inequality and poor economic mobility can be explained by employment and unemployment. Over the past three years, the District has seen an increase in overall employment. As of May of 2023, the District has gained 3,400 jobs.23 The unemployment rate has fallen back to pre-pandemic levels of 4.6%.24 Despite the strong overall economy, unemployment is still high for minority groups.
The white unemployment rate has remained very low at 1.4% in 2023.25 However, Black unemployment remains stubbornly high, with an unemployment rate of 9.6%.26 Nearly half of
20 Santillo et al. 2022. Washington, DC, has glaring financial health inequities. So do most American cities. The Urban Institute. Retrieved on September 1, 2023 from https://www.urban.org/urban-wire/washington-dc-has-glaring-financial-health-inequitiesso-do-most-american-cities
21 Statista. 2023. Gini coefficient as a measure for household income distribution inequality in the United States 2021, by state. Retrieved from September 1, 2023 from https://www.statista.com/statistics/227249/greatest-gap-between-rich-and-poor-by-usstate/
22 Austermuhle, Martin. 2014. D.C: Even more unequal than you may have thought. WAMU. Retrieved on September 1, 2023 from https://wamu.org/story/14/10/31/dc_even_more_unequal_than_you_thought/
23 Department of Employment Services. 2023. District of Columbia looks forward, unemployment rate at 5.1 percent in May. Retrieved on September 1, 2023 from https://does.dc.gov/release/district-columbia-looks-forward-unemployment-rate-51-percentmay#:~:text=The%20number%20of%20employed%20District,to%20391%2C900%20in%20May%202023.
24 Schnur & Williams. 2023. DC’s extreme black-white unemployment gap is worst in the nation. DC Fiscal Policy Institute. Retrieved on September 1, 2023 from https://www.dcfpi.org/all/dcs-extreme-black-white-unemployment-gap-is-worst-in-thenation/#:~:text=Black%20unemployment%20in%20DC%20is,the%20worst%20in%20the%20nation.
25 Schnur & Williams. 2023. DC’s extreme black-white unemployment gap is worst in the nation. DC Fiscal Policy Institute. Retrieved on September 1, 2023 from https://www.dcfpi.org/all/dcs-extreme-black-white-unemployment-gap-is-worst-in-thenation/#:~:text=Black%20unemployment%20in%20DC%20is,the%20worst%20in%20the%20nation.
26 Schnur & Williams. 2023. DC’s extreme black-white unemployment gap is worst in the nation. DC Fiscal Policy Institute. Retrieved on September 1, 2023 from https://www.dcfpi.org/all/dcs-extreme-black-white-unemployment-gap-is-worst-in-thenation/#:~:text=Black%20unemployment%20in%20DC%20is,the%20worst%20in%20the%20nation.
all unemployed Black workers in 2022 were out of work for six months or more.27 Black workers were five times as likely to be underemployed than white workers.28 The trend of high Black unemployment and low white unemployment has been consistent since 2000. Between 2000 and 2022, Black unemployment never fell below 8.3% while white unemployment never rose above 4.1%.29 Employment in the District often caters towards highly educated individuals meaning many communities that may not have access to quality education may struggle finding employment.
The District of Columbia has a higher-than-average poverty rate compared to the rest of the United States. Nearly 17% of residents in the District currently fall under the federal poverty line (FPL) compared to 13% of the citizens across the United States.30 Like income, poverty is also not equally distributed across the District. Wards 3 and 4 have historically been wealthier areas, while Wards 5, 6, 7 and 8 have been poorer. The difference between these wards is quite stark. For example, Ward 8 has a recorded poverty rate of 30% with a median household income of $38,000, while Ward 3 has a poverty rate of 7.9% and a median household income of $133,750.31
Poverty is also not equally distributed by race. For example, Ward 1 has a poverty rate of 11.2%. However, only 2.9% of white individuals live under the FPL, compared to 30.8% of Black individuals.32 The racial disparity between white and Black individuals extends even to wealthier wards. In Ward 3 for instance, only 5% of white individuals fall below the FPL compared to 28% of Black individuals.33 Individuals who did not obtain a high school diploma or GED struggled regardless of ward residence.
27 Schnur & Williams. 2023. DC’s extreme black-white unemployment gap is worst in the nation. DC Fiscal Policy Institute. Retrieved on September 1, 2023 from https://www.dcfpi.org/all/dcs-extreme-black-white-unemployment-gap-is-worst-in-thenation/#:~:text=Black%20unemployment%20in%20DC%20is,the%20worst%20in%20the%20nation.
28 Schnur & Williams. 2023. DC’s extreme black-white unemployment gap is worst in the nation. DC Fiscal Policy Institute. Retrieved on September 1, 2023 from https://www.dcfpi.org/all/dcs-extreme-black-white-unemployment-gap-is-worst-in-thenation/#:~:text=Black%20unemployment%20in%20DC%20is,the%20worst%20in%20the%20nation.
29 Schnur & Williams. 2023. DC’s extreme black-white unemployment gap is worst in the nation. DC Fiscal Policy Institute. Retrieved on September 1, 2023 from https://www.dcfpi.org/all/dcs-extreme-black-white-unemployment-gap-is-worst-in-thenation/#:~:text=Black%20unemployment%20in%20DC%20is,the%20worst%20in%20the%20nation.
30 Census Bureau. 2021. 2021 American community survey 1-year estimates. Retrieved on August 30, 2023 from https://data.census.gov/profile/District_of_Columbia?g=040XX00US11
31 Census Bureau. 2021. 2021 American community survey 5-year estimates. Retrieved on August 30, 2023 from https://data.census.gov/profile/District_of_Columbia?g=040XX00US11
32 Census Bureau. 2021. 2021 American community survey 1-year estimates. Retrieved on August 30, 2023 from https://data.census.gov/table?q=poverty&g=610XX00US11001,11002,11003,11004,11005,11006,11007,11008
33 Census Bureau. 2021. 2021 American community survey 1-year estimates. Retrieved on August 30, 2023 from https://data.census.gov/table?q=poverty&g=610XX00US11001,11002,11003,11004,11005,11006,11007,11008
Child poverty persists despite increasing family incomes. Wealthier wards such as Ward 3 have low child poverty rates, with only 1.5% of children under 18 falling below the FPL. Every other ward in the District has a child poverty rate of above 10%.34
Barriers to employment exist for residents who have not graduated high school and returning residents. While there is an extensive network of nonprofit organizations as well as state institutions to assists struggling residents with employment, the barriers to employment are often structural in nature. For example, many struggling workers may need education in literacy and numeracy.35 Other factors include transportation access, housing stability and family stability. Often, inability to secure employment stems for societal factors such as where an individual was raised, their access to education and other various support networks. Therefore, connecting individuals with employers means addressing structural issues facing the community, rather than simply training an individual in a skill and sending out a resume.36
Education is the largest barrier of entry for District residents. While the District has done an excellent job recruiting talent from elsewhere in the country, it has often avoided supporting careers of individuals who grew up in the city. Of the top ten most requested jobs in the District, all jobs require a bachelor’s degree or higher to be considered for employment.37 There is not a single career on the list that at minimum, needs less than a high school diploma or GED. Many of the most requested careers pay more than $100,000 dollars a year. The Department of Employment services also provide information about in-demand careers for individuals who lack a high school diploma. Of the top 50 jobs listed, only 20 careers make more than $40,000 dollars a year and none (baring athletes and artists) make more than $70,000 dollars.38 Providing quality education and ensuring that students can graduate with basic literacy and numeracy skills is integral for career development after graduation.
34 Census Bureau. 2021. 2021 American community survey 1-year estimates. Retrieved on August 30, 2023 from https://data.census.gov/table?q=poverty&g=610XX00US11001,11002,11003,11004,11005,11006,11007,11008
35 Grant, Bruce. 2018. Reducing barriers for job-seekers. D.C. Policy Center. Retrieved on August 30, 2023 from https://www.dcpolicycenter.org/publications/reducing-barriers-for-job-seekers-in-d-c-and-the-metro-region/
36 Grant, Bruce. 2018. Reducing barriers for job-seekers. D.C. Policy Center. Retrieved on August 30, 2023 from https://www.dcpolicycenter.org/publications/reducing-barriers-for-job-seekers-in-d-c-and-the-metro-region/
37 Department of Employment Services. 2022. The top 50 high demand occupations. Retrieved on August 30, 2023 from https://does.dc.gov/sites/default/files/dc/sites/does/page_content/attachments/2023%20Hot%20Jobs%2050_0.pdf
38 Department of Employment Services. 2022. The top 50 high demand occupations requiring less than a high school diploma Retrieved on August 30, 2023 from https://does.dc.gov/sites/default/files/dc/sites/does/page_content/attachments/2023%20Hot%20Jobs%20Visual%20below%20G ED.pdf
Returning from incarceration also poses a significant barrier to employment. Individuals with a criminal history tend to struggle with finding employment after leaving incarceration on a national level, but the issue is much more pronounced in the District. Over 50% of individuals experiencing homelessness have claimed to have been incarcerated.39 The struggle to procure employment stems from a poor housing situation and the general stigma against hiring individuals who have been convicted of certain crimes. Though institutions such as the Georgetown Pivot program provide support to returning residents, the high rates of homelessness amongst returning residents indicates that the issue is larger than individual experiences.
The factors that individuals may face when searching for employment disproportionally affect Black and Brown residents. As of 2023, labor force participation for young white adults is 11% higher than the labor force participation for young Black adults. Young Black job seekers claimed that they had experienced workplace discrimination, struggled to find work, or lacked the proper mentorship.40 Struggling to find and maintain employment early in life can have disastrous consequences in the future. Unemployment in an individual’s early and late 20s is directly correlated with poor job quality and poverty in an individual's 30s.41 In the District, unemployment and difficulty seeking employment disproportionately affect young Black individuals.42
Overview of Health in the District
Life expectancy has dropped significantly in the U.S. for a number of reasons: COVID-19, the opioid epidemic and lack of access to healthcare services. As of 2020, the average U.S. citizen is expected to live 77.28 years. District residents can expect to live for 78 years.43
39 Coventry, Kate. 2020. Coming home to homelessness. DCFPI. Retrieved on August 30, 2023 from https://www.dcfpi.org/all/coming-home-tohomelessness/#:~:text=Nearly%20three%20of%20five%20DC%20individuals%20experiencing%20homelessness%E2%80%9457,h omelessness%20in%20DC%20connect%20that%20to%20their%20incarceration.
40 Schnur, Caitlin. 2024. DC’s labor market is failing young black workers. DC Fiscal Policy Institute. Retrieved on August 19, 2024 from https://www.dcfpi.org/all/dcs-labor-market-is-failing-young-black-workers/
41 Ross, Martha, et. al. 2018. High-quality jobs for young adults. Brookings Institute. Retrieved on August 19, 2024 from https://www.brookings.edu/wp-content/uploads/2018/10/Brookings_Child-Trends_Pathways-for-High-Quality-Jobs-FINAL.pdf
42 Schnur, Caitlin. 2024. DC’s labor market is failing young black workers. DC Fiscal Policy Institute. Retrieved on August 19, 2024 from https://www.dcfpi.org/all/dcs-labor-market-is-failing-young-black-workers/
43 County Health Rankings & Roadmaps. 2023. 2023 County Health Rankings District of Columbia data – v2. Retrieved on September 18, 2023 from https://www.countyhealthrankings.org/explore-health-rankings/district-of-columbia/data-and-resources
However, there are several health disparities between District residents. For example, the average age-adjusted death rate, which calculates the average number of premature deaths in a given area, is 433 in the District.44 The age-adjusted death rate for white residents is 130, while for Black residents, the age-adjusted mortality rate is 702, nearly 5.5 times higher.45 The disparities in race touch every aspect of health in the District. The child mortality rate, for instance, is three times higher for Black children than it is for white children.46
Over the course of the pandemic, experts advised the public to prioritize their mental health, leading to ongoing discussions about the various factors that affect mental wellbeing. Though the height of the pandemic has receded, the conversations on the salience of mental health are still ongoing. The definition of mental health is loosely defined, yet it is collectively understood to include individual’s emotional and psychological wellbeing.47
The public emphasis on mental wellbeing is ever present in the District. Both adult and child mental health services have seen a seven million dollar increase since 2021.48 This is the result of an 8% of health care services requested by District residents, for a total of 41,560 services requested in 2022.49 The increase in mental health services requested is a direct result to rising rates of symptoms of depression and anxiety within the District. In 2023, nearly 30% of residents reported a major depressive disorder.50 Of the residents who reported depressive episodes, nearly 50% reported that their needs were unmet.51 Unmet health assistance may stem from the financial burden associated with therapy and other mental health services. In 2023, the average therapy session costs 150-200 dollars.52
44 County Health Rankings & Roadmaps. 2023. 2023 County Health Rankings District of Columbia data – v2. Retrieved on September 18, 2023 from https://www.countyhealthrankings.org/explore-health-rankings/district-of-columbia/data-and-resources
45 County Health Rankings & Roadmaps. 2023. 2023 County Health Rankings District of Columbia data – v2. Retrieved on September 18, 2023 from https://www.countyhealthrankings.org/explore-health-rankings/district-of-columbia/data-and-resources
46 County Health Rankings & Roadmaps. 2023. 2023 County Health Rankings District of Columbia data – v2. Retrieved on September 18, 2023 from https://www.countyhealthrankings.org/explore-health-rankings/district-of-columbia/data-and-resources
47U.S Department of Health and Human Services. (2021). What is mental health? Retrieved from https://www.samhsa.gov/mentalhealth on 8/4/2023.
48 Department of Behavioral Health. (2022). Mental health and substance abuse report on service expenditures. Retrieved from https://dbh.dc.gov/sites/default/files/dc/sites/dmh/page_content/attachments/MHEASURES%20Report%20January%202023.p df on 8/4/2023.
49 Department of Behavioral Health. (2022). Mental health and substance abuse report on service expenditures. Retrieved from https://dbh.dc.gov/sites/default/files/dc/sites/dmh/page_content/attachments/MHEASURES%20Report%20January%202023.p df on 8/4/2023.
50 KFF. (2023). Mental Health in the District of Columbia. Retrieved from https://dbh.dc.gov/sites/default/files/dc/sites/dmh/page_content/attachments/MHEASURES%20Report%20January%202023.p df on 8/4/2023
51 KFF. (2023). Mental Health in the District of Columbia. Retrieved from https://dbh.dc.gov/sites/default/files/dc/sites/dmh/page_content/attachments/MHEASURES%20Report%20January%202023.p df on 8/4/2023
52 Brad Brenner. (2023). How much does therapy cost? Average cost of therapy in DC. Therapy Group of D.C. Retrieved from https://therapygroupdc.com/therapist-dc-blog/how-much-does-therapy-cost-average-cost-of-therapy-in-dc/ on 8/4/23.
The costs of poor mental health are not distributed evenly across the District. Individuals with mental illnesses report spending roughly 1,600 dollars out of pocket for mental health services.53 Individuals without mental illness report spending a third of that number.54 Low-income residents are far less likely to have access to mental health services within their budgets. There are also disparities across geography. Wards 7 and 8 report higher needs of mental health services than the rest of the District.55
If mental health services are deemed too expensive, individuals may turn to self-medication as a form of coping, which can lead to substance abuse. The District has wrestled with substance abuse for years, and many who experience mental illness also report high rates substance abuse. In 2023, nearly 5,300 District residents sought substance abuse services from a D.C. government affiliated provider.56 Just over 3,100 individuals who sought substance abuse assistance also requested mental health services from the same provider.57
In 2022, there were 461 opioid-related fatal overdoses, with an average of 38 deaths per month.58 By May of 2023, there were 192 opioid-related fatal overdoses, indicating a steep increase in overdoses within the District. The high number of opioid-related deaths has been a consistent trend in the District since 2018. Older residents are particularly susceptible to opioid overdose. As new, more potent drugs enter the market, older users may have a harder time distinguishing their old supply of opiates. Thus, older residents are more likely to experience repeat overdoses.59 The city’s opioid problem is also more likely to affect Black residents. The
53 KFF. (2023). Mental Health in the District of Columbia. Retrieved from https://dbh.dc.gov/sites/default/files/dc/sites/dmh/page_content/attachments/MHEASURES%20Report%20January%202023.p df on 8/4/2023
54 KFF. (2023). Mental Health in the District of Columbia. Retrieved from https://dbh.dc.gov/sites/default/files/dc/sites/dmh/page_content/attachments/MHEASURES%20Report%20January%202023.p df on 8/4/2023
55 D.C. Health Matters. (2023). Mental Health Needs. Retrieved from https://www.dchealthmatters.org/indexsuite/index/mentalhealth?localeType=3&parentLocale=130951&locale=9405 on 08/04/2023.
56 Department of Behavioral Health. (2022). Mental health and substance abuse report on service expenditures. Retrieved from https://dbh.dc.gov/sites/default/files/dc/sites/dmh/page_content/attachments/MHEASURES%20Report%20January%202023.p df on 8/4/2023.
57 57 D.C. Health Matters. (2023). Mental Health Needs. Retrieved from https://www.dchealthmatters.org/indexsuite/index/mentalhealth?localeType=3&parentLocale=130951&locale=9405 on 08/04/2023.
58 Office of the Chief Medical Examiner. 2023. Opioid-related fatal overdoes: January 1, 2017, to May 31, 2023. Retrieved on August 29, 2023 from https://ocme.dc.gov/sites/default/files/dc/sites/ocme/page_content/attachments/Opioid%20related%20Overdoses%20Deaths_A ug%202023.pdf
59 Turilli, Isabella. 2022. Opioid overdoses are reaching new highs in Washington DC. Retrieved August 29, 2023, from https://www.thinkglobalhealth.org/article/opioid-overdoses-are-reaching-new-highs-washington-dc
average opiates user in DC is Black and between the ages of 55-64.60 Black residents also make up 85% of overdose deaths from opioids.61
To curb overdose deaths, D.C. restaurants have been given permission to distribute Narcan. The drug can also be found in vending machines across the city. Virtual Narcan training education is also provided by the District.
Adverse perinatal outcomes, defined as low birth weight, small for gestational age, preterm birth, stillbirth, or neonatal death, are all issues mothers in D.C. must be conscious of. The District in recent years has struggled to address high rates of adverse perinatal outcomes. Maternal health and wellness are correlated with birth outcomes. For example, if a mother undergoes prenatal care during the first trimester, the child is more likely to be born a healthy birth weight.
The District currently holds the highest maternal mortality rate in the country with 36 deaths per every 100,000 births.62 Low-income residents, particularly in Wards 5, 7 and 8, lack perinatal care. Systemic racism and gendered racism—or the oppression that emerges from the intersection of race and gender—contribute to many of the disparities seen in maternal health and well-being in the United States. In a recent study conducted by Georgetown University Center for Child and Human Development, researchers identified that “[The District] created a predatory health care system that is both inaccessible and unaffordable for Black women.”63 Participants were interviewed as part of the report, where all participants shared at least one experience with racism in pregnancy-related visits to healthcare providers. Postpartum care is also another area that low-income BIPOC mothers struggle to access. 64
60 Turilli, Isabella. 2022. Opioid overdoses are reaching new highs in Washington DC. Retrieved August 29, 2023, from https://www.thinkglobalhealth.org/article/opioid-overdoses-are-reaching-new-highs-washington-dc
61 Turilli, Isabella. 2022. Opioid overdoses are reaching new highs in Washington DC. Retrieved August 29, 2023, from https://www.thinkglobalhealth.org/article/opioid-overdoses-are-reaching-new-highs-washington-dc
62 Bhatnagar et. al. 2022. Racism blleds throughout this entire health care system: elevating black women’s birth stories in Washington, DC through a racial equity lens. Georgetown University Center for Child and Human Development. Retrieved on August 29, 2023 from https://gucchd.georgetown.edu/products/UPD_GU_Racism-Bleeds-throughout-this-Entire-HealthcareSystem.pdf
63 Bhatnagar et. al. 2022. Racism blleds throughout this entire health care system: elevating black women’s birth stories in Washington, DC through a racial equity lens. Georgetown University Center for Child and Human Development. Retrieved on August 29, 2023 from https://gucchd.georgetown.edu/products/UPD_GU_Racism-Bleeds-throughout-this-Entire-HealthcareSystem.pdf
64 Bhatnagar et. al. 2022. Racism blleds throughout this entire health care system: elevating black women’s birth stories in Washington, DC through a racial equity lens. Georgetown University Center for Child and Human Development. Retrieved on August 29, 2023 from https://gucchd.georgetown.edu/products/UPD_GU_Racism-Bleeds-throughout-this-Entire-HealthcareSystem.pdf
Systemic racism also impacts the infant mortality rate. In 2023, there were 446 infant deaths, for an infant mortality rate of 7.65 White residents have an infant mortality rate of 2, while Black residents have an infant mortality rate of 12.66
As of 2023, there are an estimated 357 childcare centers across the District, or 8 childcare centers per 1,000 children.67 Though the District has a robust number of childcare services, the percentage of household income required to pay for childcare expenses remains quite high. An estimated 27% of household income is needed to pay childcare services providers.68
On June 28th, 2022, the Supreme Court voted to overturn Roe v. Wade, meaning the legality of abortion is determined by the state. The decision effectively ended five decades of constitutionally protected abortion rights. Despite the decision, the District has expanded abortion access for out-of-state travelers.69 However, because of the District’s precarious relationship with Congress, funds for abortion access could be taken away in the next budget cycle. Lawmakers continue to uphold a budget rider that prevents the District from subsidizing abortions for low-income individuals.70
Food insecurity is linked to asthma, dental and developmental problems, colds, cancer, heart disease, pregnancy complications, congestive heart failure and lower cognitive function in adults.71 Food insecurity, therefore, effects the District residents who cannot easily afford food essentials. Supplemental Nutrition Assistance Program or SNAP has seen steady increases in enrollment since the pandemic. As of 2023, approximately 145,800 individuals have enrolled in
65 County Health Rankings & Roadmaps. 2023. 2023 County Health Rankings District of Columbia data – v2. Retrieved on September 18, 2023 from https://www.countyhealthrankings.org/explore-health-rankings/district-of-columbia/data-and-resources
66 County Health Rankings & Roadmaps. 2023. 2023 County Health Rankings District of Columbia data – v2. Retrieved on September 18, 2023 from https://www.countyhealthrankings.org/explore-health-rankings/district-of-columbia/data-and-resources
67 County Health Rankings & Roadmaps. 2023. 2023 County Health Rankings District of Columbia data – v2. Retrieved on September 18, 2023 from https://www.countyhealthrankings.org/explore-health-rankings/district-of-columbia/data-and-resources
68 County Health Rankings & Roadmaps. 2023. 2023 County Health Rankings District of Columbia data – v2. Retrieved on September 18, 2023 from https://www.countyhealthrankings.org/explore-health-rankings/district-of-columbia/data-and-resources
69 Grablick, Colleen. 2023. One year after Roe’s fall, here’s where abortion access stands in the D.C. region. DCist. Retrieved on September 11, 2023 from https://dcist.com/story/23/06/28/dobbs-one-year-later-dc-maryland-virginia/
70 Grablick, Colleen. 2023. One year after Roe’s fall, here’s where abortion access stands in the D.C. region. DCist. Retrieved on September 11, 2023 from https://dcist.com/story/23/06/28/dobbs-one-year-later-dc-maryland-virginia/
71 District of Columbia Department of Health. (2019). Our healthy DC. Food security. Retrieved August 28, 2023 from https://ourhealthydc.org/dc-chna/health-outcomes/mental-health/
the program.72 Current SNAP enrollment numbers are a sizeable increase from 2019, where approximately 94,000 individuals were enrolled.
Though food insecurity rates have been steadily decreasing within the District, certain populations are still vulnerable to the issue. For those living East of the Anacostia River, buying food may be a difficult task. Nearly 31% and 51% of Wards 7 and 8 are considered a “food desert” respectively.73 A food desert is an area where grocery stores or markets are located more than half a mile from a residence. Typically, areas labeled as food deserts have low rates of car access and high rates of poverty. The estimated food insecurity rate was 11% in 2021.74 Low-income seniors are particularly vulnerable to food insecurity. The insecurity rate amongst seniors as 13% in the District of Columbia.75
As of 2022, there are 350,364 housing units in the District of Columbia.76 However, there are only 326,970 occupied units.77 Of the current housing stock, 161,140 units are a part of apartment units with 10 or more housing units.78 The next largest supply of housing stock is a single-family attached home, of which the District has an estimated 71,120 units.79 Much of the current housing stock is rapidly aging. Nearly 32% of the current housing stock was built before 1939.80
In 2022, the homeownership rate was 42%, significantly lower than the national average.81 The District’s low homeownership rate can be attributed to much of its housing stock being primarily
72 Schilke, Rachel. 2023. Food stamps: SNAP benefits for September to arrive for DC residents in four days. Washington Examiner. Retrieved on August 28, 2023 from https://gazette.com/news/wex/food-stamps-snap-benefits-for-september-to-arrive-for-dcresidents-in-four-days/article_fc2aaa41-3888-5388-a36634ff7dd8bda5.html#:~:text=Approximately%20145%2C800%20people%2C%20or%2022,member%20per%20month%20is%20%2 4188.
73 D.C. Policy Center. 2018. Food Access in D.C. Retrieved on August 28, 2023 from https://www.dcpolicycenter.org/wpcontent/uploads/2018/01/Food-ACCESS-in-DC.pdf
74 DC Food Policy Council. 2022. Opportunities to strengthen nutrition programs in DC to address senior food insecurity. Retrieved on August 28, 2023 from https://dcfoodpolicycouncilorg.files.wordpress.com/2022/03/opportunities_strengthen_nutrition_programs_dc_senior_food_ins ecurity_fleurian_filkins_dcopfpd.pdf
75 DC Food Policy Council. 2022. Opportunities to strengthen nutrition programs in DC to address senior food insecurity. Retrieved on August 28, 2023 from https://dcfoodpolicycouncilorg.files.wordpress.com/2022/03/opportunities_strengthen_nutrition_programs_dc_senior_food_ins ecurity_fleurian_filkins_dcopfpd.pdf
76 U.S. Census Bureau. 2023. American community survey 1-years estimates. Table H1.
77 U.S. Census Bureau. 2023. American community survey 1-year estimates. Table S2504
78 U.S. Census Bureau. 2023. American community survey 1-year estimates. Table S2504
79 U.S. Census Bureau. 2023. American community survey 1-year estimates. Table S2504
80 U.S. Census Bureau. 2023. American community survey 1-year estimates. Table S2504
81 Federal Reserve Economic Data. 2023. Homeownership rate for the District of Columbia. FRED. Retrieved on September 18, 2023 from https://fred.stlouisfed.org/series/DCHOWN
made up of apartment units. There are also racial-geographical constraints. Much of the singlefamily homes, often coveted for their ability to pass down generational wealth are located in wealthier areas of the District, which provides an advantage to white residents. D.C.’s Black home ownership has mostly stagnated in the early 2020s. Though the District has roughly double the Black population rate of the U.S. as a whole, Black home ownership has hovered around 20%.82
Although the District grew considerably during the 2010s, the pandemic caused several residents to move to the surrounding suburbs. While an exodus of individuals from an area typically decreases overall demand for housing, finding an affordable apartment in D.C. is as competitive as ever. The high demand for housing has incentivized some individuals to take advantage of the situation. In 2023, the D.C. attorney general warned against scammers posting fake apartments for rent and then charging individuals transaction fees.83 The rise is scammers is indicative of the current housing market instability that many residents of low-income face.
The competition surrounding the rental market creates intense pressure on the cost of housing in the District. A study conducted by the National Low Income Housing Coalition found that for a 2-bedroom apartment, renters would have to make near $40 an hour to make rent, for fair market rent.84 This is especially impactful for young families living in the District, who may require additional rooms for their family. The situation is even more dire for minimum wage workers, who at $17.50 an hour, would have to work 79 hours a week to afford a 1-bedroom apartment. For an individual making minimum wage working 40 hours a week, the fair market rent is an estimated $1,160. There are few, if any 1-bedroom apartments in the District at that price. In fact, for a studio apartment, annual income required to pay rent at the end of the month is $70,880, for a fair rent price.85
Unlike homeowners, renters do not receive tax breaks for entering a lease with a landlord. This puts further economic pressure on low-income, young populations who are more likely to rent after completing their education.
82 Hopkins, Paige. 2023. D.C.’s Black homeownership rates have stagnated. Axios. Retrieved on September 18, 2023 from https://www.axios.com/local/washington-dc/2023/01/12/dc-black-homeownership-rates-unchanged
83 Ianelli, Nick. (2023) Don’t be fooled by this scam if you’re renting in DC. WTOP. Retrieved from https://wtop.com/dc/2023/08/dont-be-fooled-by-this-scam-if-youre-renting-in-dc/ on 8/21/23.
84 National Low Income Housing Coalition. 2024. Out of reach District of Columbia. Retrieved on August 19, 2024 from https://nlihc.org/oor/state/dc
85 National Low Income Housing Coalition. 2024. Out of reach District of Columbia. Retrieved on August 19, 2024 from https://nlihc.org/oor/state/dc
As a rule of thumb, housing is considered “affordable” when 30% of take-home income is appropriated to an individual’s rent or mortgage. However, this rule is inherently regressive. Lower-income households dedicate a higher proportion of their income to rent than higherincome households, as higher-income households tend to have more expendable capital after paying rent or a mortgage. Despite this limitation, the rule is often accepted as at least a benchmark for affordability. If a household spends more than 30% of their income on rent, then the household is considered “cost burdened”.
Many residents within the District are considered cost burdened and even severely cost burdened (50% or more of take-home income is dedicated to rent). By the end of 2021, nearly 25% of renters were considered cost burdened.86 Even as the city provides services such as the Affordable Housing Locator and various forms of housing vouchers, rent continues to increase dramatically throughout the city. By 2023, the average rent for an apartment of 745 square feet was $2,327.87
To counter rising costs and displacement of low-income residents, the District government announced the goal of constructing 36,000 new housing units and dedicating 12,000 of the new units as affordable, by 2025. As of 2024, 100% of the proposed housing units have begun or completed construction, though the affordable units still lag in construction.88 In the same year, the District government is proposing slashing emergency rental assistance as well as cutting housing production funds.89
As the pandemic wanes and more commuters from Virginia and Maryland work from home, the D.C. government has incentivized some businesses to convert their high-end corporate offices to affordable housing, with pushback from local businesses.
The District government has also delayed several distributions of public housing vouchers and applications. In 2013, the D.C. Housing Authority (DCHA) froze the waitlist of public housing
86Upward Mobility. 2022. Housing. Retrieved from upwardmobility.dc.gov/page/housing on 8/21/23.
87 Rent Café. (2023). Retrieved from https://www.rentcafe.com/average-rent-market-trends/us/dc/washington/ on 8/21/23.
88 Baskin, Morgan. (2023). Bowser proposes slashing emergency rental assistance, housing production funds amid grim economic forecast. DCist. Retrieved from https://dcist.com/story/23/03/24/bowser-budget-rental-assistance-housing-production/ on 8/21/23.
89 Baskin, Morgan. (2023). Bowser proposes slashing emergency rental assistance, housing production funds amid grim economic forecast. DCist. Retrieved from https://dcist.com/story/23/03/24/bowser-budget-rental-assistance-housing-production/ on 8/21/23.
vouchers to the public.90 Some residents have been on the DCHA waitlist for more than 30 years.
Despite the increase of individuals with high incomes in recent years, many in the District struggle to find housing. Though 2022 saw the fifth consecutive year homelessness fell below 10,000 persons, there was an 18% increase in the count of unhoused individuals at a certain point in time (PIT)–a measure used by experts to capture an accurate number of a population in constant flux.91 Nearly 9,000 individuals are still considered homeless within the District.92 Nearly half of these individuals are experiencing “chronic homeless” – experiencing homelessness for a year or longer.93 The increase in homeless individuals may stem from the increase in the prices of rent, especially after the pandemic benefits offered by federal programs have waned. However, in 2023, 29,107 unhoused persons transitioned into permanent supportive housing or escaped homelessness, an all-time high. The significant increase of individuals using government programs to transition out of homelessness indicates that DC programs are accessible and an effective way of combating homelessness.
In 2020, the District government launched Homeward 2.0, an initiative to make homelessness a brief and non-recurring experience. To achieve this aim, Homeward 2.o aims to increase funding to permanent supportive housing programs, rapid rehousing programs and provide assistance to families experiencing homelessness.94 The benefits of this program have yet to be seen. There has been no way to monitor the progress of homeless individuals and rapid rehousing programs continue to be underfunded.95 The targeted goal of providing 1,924 permanent housing vouchers has fallen short, as only 369 vouchers have been distributed.96
90 Cloherty, Megan. (2023). DC is ready to clea 20,000 names from waitlist, and reopen public housing applications. WTOP. Retrieved from https://wtop.com/dc/2023/03/dc-is-ready-to-clear-20000-names-from-waitlist-and-reopen-public-housingapplications/ on 8/21/23.
91 Metropolitan Washington, Council of Governments .(2023). Homelessness in metropolitan Washington. Council of Governments. Retrieved from https://www.mwcog.org/documents/2023/05/10/homelessness-in-metropolitan-washington-results-and-analysisfrom-the-annual-point-in-time-pit-count-of-persons-experiencing-homelessness-featured-publications-homelessness/ on 8/21/23.
92 Metropolitan Washington, Council of Governments .(2023). Homelessness in metropolitan Washington. Council of Governments. Retrieved from https://www.mwcog.org/documents/2023/05/10/homelessness-in-metropolitan-washington-results-and-analysisfrom-the-annual-point-in-time-pit-count-of-persons-experiencing-homelessness-featured-publications-homelessness/ on 8/21/23.
93 Coventry, Kate. (2023). Bringing it all home: How DC can become the first major city to end chronic homelessness and provide higher-quality services. DC Fiscal Policy Institute. Retrieved from https://www.dcfpi.org/all/bringing-it-all-home-how-dc-canbecome-the-first-major-city-to-end-chronic-homelessness-and-provide-higher-quality-services/ on 8/21/23.
94 Interagency Council on Homelessness. (2020). Homeward DC 2.0: ICH strategic plan FY2021 – FY 2025. Retrieved from https://ich.dc.gov/page/homeward-dc-20-ich-strategic-plan-fy2021-fy2025 on 8/21/23.
95 Coventry, Kate .(2023). Underfunding and implementation delays undermine progress towards ending homelessness. DC Fiscal Policy Institute. Retrieved from https://www.dcfpi.org/all/underfunding-and-implementation-delays-undermine-progress-towardending-homelessness/ on 8/23/21.
96 Coventry, Kate .(2023). Underfunding and implementation delays undermine progress towards ending homelessness. DC Fiscal Policy Institute. Retrieved from https://www.dcfpi.org/all/underfunding-and-implementation-delays-undermine-progress-towardending-homelessness/ on 8/23/21.
Moreover, as a result of the 2024 District Budget, rapid rehousing vouchers were greatly limited. While the lingering effects of COVID-19 play a role in the delays of these programs, homeless advocates hope to speed up the leasing and voucher attainment process and increase permanent supportive housing supply.
Homelessness also disproportionally affects low-income residents of color. Of the nearly 9,000 homeless persons counted in the 2023 PIT, 71% were Black or African American.97 The racial disparity faced by Black and African American individuals reflects the intentional efforts to erode the livelihood of BIPOC groups through racial segregation, block busting, racialdiscriminatory covenants. Factors that increase the risk of homelessness also reflect the de facto and de jure racism experienced by BIPOC groups. A majority of individuals experiencing homelessness have a history of incarceration and involvement in foster care programs.98 Within the District, nearly 90% of individuals in prison are Black and 84% of children in foster care are Black.99 The Council of Governments (COG) has identified several gaps between white and Black communities within the District, noting the salience that housing and economic mobility factor into homelessness.100
Substandard housing has been a point of contention within the District, especially amongst those who are living in public housing. The enduring legacy of structural racism continues to disproportionately impact Black and Brown District residents, as the majority of public housing projects are located in predominately Black areas, specifically in Wards 7 and 8. As of 2023, there are 19,000 people living in D.C. public housing.101 Although both the D.C. government,
97 Metropolitan Washington, Council of Governments .(2023). Homelessness in metropolitan Washington. Council of Governments. Retrieved from https://www.mwcog.org/documents/2023/05/10/homelessness-in-metropolitan-washington-results-and-analysisfrom-the-annual-point-in-time-pit-count-of-persons-experiencing-homelessness-featured-publications-homelessness/ on 8/21/23.
98 Coventry, Kate. (2023). Bringing it all home: How DC can become the first major city to end chronic homelessness and provide higher-quality services. DC Fiscal Policy Institute. Retrieved from https://www.dcfpi.org/all/bringing-it-all-home-how-dc-canbecome-the-first-major-city-to-end-chronic-homelessness-and-provide-higher-quality-services/ on 8/21/23.
99 Coventry, Kate. (2023). Bringing it all home: How DC can become the first major city to end chronic homelessness and provide higher-quality services. DC Fiscal Policy Institute. Retrieved from https://www.dcfpi.org/all/bringing-it-all-home-how-dc-canbecome-the-first-major-city-to-end-chronic-homelessness-and-provide-higher-quality-services/ on 8/21/23.
100 Metropolitan Washington, Council of Governments .(2023). Homelessness in metropolitan Washington. Council of Governments. Retrieved from https://www.mwcog.org/documents/2023/05/10/homelessness-in-metropolitan-washingtonresults-and-analysis-from-the-annual-point-in-time-pit-count-of-persons-experiencing-homelessness-featured-publicationshomelessness/ on 8/21/23.
101 Cloherty, Megan. (2023). DC is ready to clea 20,000 names from waitlist, and reopen public housing applications. WTOP. Retrieved from https://wtop.com/dc/2023/03/dc-is-ready-to-clear-20000-names-from-waitlist-and-reopen-public-housingapplications/ on 8/21/23.
local advocates and residents within public housing have demanded the DCHA to make necessary repairs, the agency has often sidestepped the issue.102
The Department of Housing and Urban Development audited the DCHA. Of the 8,084 units in 60 developments across the city, HUD claims that DCHA is “not maintaining units in a decent, safe and sanitary condition”.103 As the rental units are in poor condition, of the 8,084 units available, 1,628 units are left vacant, though many individuals are kept on the waitlist.104 Mismanagement at DCHA directly impacts DC’s low-income residents the most.
Substandard housing has also been an issue in the private real estate market, particularly in poorer areas of the city. In 2023, a judge ruled on the side of renters against three property managers who failed to pass safety inspections.
To read more on housing and the housing crisis in the District, please refer to the Special Section on Housing in this report.
While violent crime has fallen 7% from 2021 to 2022, as of August 2023, violent crime has increased 39% from August of 2022.105 Robberies as well, have increased 66% from 2022. Homicides also continue to increase, as there have been 175 in 2023 so far.106 Violent assault with a dangerous weapon has also increased by 3% in 2023. The increase in violent offenses may be correlated with the amount of weapons police officers have recovered. In 2022, 3,152 firearms were recovered, which is a 36% increase from 2022.107 If more individuals have access to firearms, the easier it will become to commit crimes with said firearms. This also explains the increase in violent crimes, as typically robberies or carjackings can turn deadly if the perpetrator
102 Koma, Alex. 2023. DCHA says it can’t spend more money on public housing repairs, even if the council found extra cash. Washington City Paper. Retrieved from https://washingtoncitypaper.com/article/600689/dcha-says-it-cant-spend-more-moneyon-public-housing-repairs-even-if-the-council-found-extra-cash/ on 8/21/23.
103 Austermuhle, Martin. (2022). Scathing federal audit of D.C. Housing Authority spurs calls for reform at troubled agency. DCist. Retrieved from https://dcist.com/story/22/10/10/dc-dcha-federal-audit/ on 8/21/2023.
104 Austermuhle, Martin. (2022). Scathing federal audit of D.C. Housing Authority spurs calls for reform at troubled agency. DCist. Retrieved from https://dcist.com/story/22/10/10/dc-dcha-federal-audit/ on 8/21/2023.
105 Metropolitan Police Department. 2023. District crime data at a glance. Retrieved on August 29, 2023 from https://mpdc.dc.gov/page/district-crime-data-glance.
106 Metropolitan Police Department. 2023. District crime data at a glance. Retrieved on August 29, 2023 from https://mpdc.dc.gov/page/district-crime-data-glance.
107 Metropolitan Police Department. 2023. District crime data at a glance. Retrieved on August 29, 2023 from https://mpdc.dc.gov/page/district-crime-data-glance.
is carrying a dangerous weapon. Homicides continued to trend upward. In 2013, there were just 104 homicides. By 2022, there were 203.
By mid-2024 however, violent crime had seen a drastic fall in the District. Compared to 2023, violent crime had fallen 29%.108 This follows the national trend of violent crimes decreasing.
Carjackings have become a frequent issue for District residents. In 2023, motor vehicle theft has increased 113% (2,571 incidents to 3,563 incidents).109 Carjackings have been the main reason for increasing rates of property crime within the District. Halfway through 2023, property crime has increased 28%.
The District has begun to combat issues of carjackings. Directly working with one of the most targeted brands for carjacking, Nissan, to show residents measures that can be taken to avoid carjacking. The District has also paired with Doordash, providing drivers dashboard cameras. Children as young as 12 have been arrested for attempted carjacking.
Also known as hate crimes, bias related crimes are defined by DC’s Bias Related Crimes Act of 1989 as a criminal act or attempted criminal act that “demonstrates an accused’s prejudice based on the actual or perceived race, color, religion, national origin, sex, age, marital status, personal appearance, sexual orientation, gender identity or expression, family responsibility, homelessness, physical disability, matriculation, or political affiliation of a victim.”110
Hate crimes had peaked in 2018, before slowing decreasing through 2022. In 2018, there were a total of 205 hate crimes across the District. By 2022, there were 129, a 58% decrease.111 Of the hate crimes reported in 2022, 45 were targeted an individual’s sexual orientation. Crimes targeting an individual’s race and ethnicity had a report count of 30.
108 Spiegel, Anna. 2024. Violent crime drops sharply in D.C. Axios. Retrieved on August 19, 2024 from https://www.axios.com/local/washington-dc/2024/08/14/violent-crime-homicides-decline-2024
109 Metropolitan Police Department. 2023. District crime data at a glance. Retrieved on August 29, 2023 from https://mpdc.dc.gov/page/district-crime-data-glance.
110 Metropolitan Police Department 2023. MPD Bias-related crimes. Retrieved August 29, 2023 from https://mpdc.dc.gov/hatecrimes
111 Metropolitan Police Department 2023. MPD Bias-related crimes. Retrieved August 29, 2023 from https://mpdc.dc.gov/hatecrimes
To gain insight into trends surrounding hate crimes, as of January 2022, MPD reports if an offense contains multiple biases. For example, in 2022 there was one report of a hate crime targeting an individual’s race and sexual orientation.112
Domestic violence is a serious public health concern both in the District and nationwide. In response, the District has created the Domestic Violence Unit. The MPD unit provides important information about domestic violence, where to go for resources and how to escape domestic violence.
To respect those who may have experienced domestic violence, public data is kept private. However, an estimated 40% of women and 25% of men have experienced domestic violence in D.C., percentages that are much higher than the rest of the country.113 Intimate partner violence is also experienced in schools. 1 in 8 middle schoolers and high schoolers reported physical or sexual violence while dating in 2019.114 LGBTQIA+ identifying students from the same age group are more risk of dating violence than peers their age; queer students are twice as likely to report being abused by their partner.115
Juvenile crimes have seen a stark increase in the past three years, becoming a major concern for District residents. In 2021, juveniles had committed 1,278 crimes within the D.C area.116 By 2022, criminal activity amongst juveniles great to 1,682 arrests within the year, a 31% increase.117 Though 1,292 of the arrests made were by D.C residents in 2022, it is a 1% increase from the total crimes committed within the District-regardless of residency-in 2021. Within this timeframe, there was an increase in property crime, such as robbery and carjacking (81%). Release violations also saw a significant increase (39%). However, a decrease in violent offenses,
112 Metropolitan Police Department 2023. MPD Bias-related crimes. Retrieved August 29, 2023 from https://mpdc.dc.gov/hatecrimes
113National Coalition Against Domestic Violence. 2023. Prominence of domestic violence in DC. DC Coalition Against Domestic Violence. Retrieved September 15, 2023 from https://www.dccadv.org/press/#:~:text=Domestic%20violence%20is%20a%20very,or%20stalking%20in%20their%20lifetimes.
114 National Coalition Against Domestic Violence. 2023. Prominence of domestic violence in DC. DC Coalition Against Domestic Violence. Retrieved September 15, 2023 from https://www.dccadv.org/press/#:~:text=Domestic%20violence%20is%20a%20very,or%20stalking%20in%20their%20lifetimes.
115 National Coalition Against Domestic Violence. 2023. Prominence of domestic violence in DC. DC Coalition Against Domestic Violence. Retrieved September 15, 2023 from https://www.dccadv.org/press/#:~:text=Domestic%20violence%20is%20a%20very,or%20stalking%20in%20their%20lifetimes.
116 Metropolitan Police Department (2021). 2021 annual report. Retrieved August 1st, 2022 from https://mpdc.dc.gov/sites/default/files/dc/sites/mpdc/publication/attachments/AR_2021_FINAL_lowres.pdf
117 Metropolitan Police Department (2022). 2022 biannual report. Retrieved August 1st, 2022 from https://mpdc.dc.gov/node/1649856
such as assault and murder (38%). A majority (56%) of juveniles arrested lived in Wards 7 and 8.118 Police Service Area (PSA) which comprises Marshall Heights, Benning Ridge and Capitol View had the highest rate of juvenile crime for D.C residents. With a total of 92 juvenile arrests, these neighborhoods accounted for 8% of total juvenile arrests in 2022.
Yet, by 2024, criminal activity amongst juveniles fell steeply by September 2024. Carjackings, mostly committed by juveniles, fell by 48%.119
The District continues to see increases in early childhood education enrollment. In the 20212022 school year, there were 12,442 children enrolled in pre-K education services across the District, a 2% increase from the 2020-2021 school year.120 Since the pandemic, there has been a drop in enrollment for infant and toddler education programs. Enrollment had consistently stayed at 5,000 participants before than pandemic, but then deceased by nearly half in 2021.121 By 2022 the number of toddlers and infants enrolled in early childhood education has begun to increase after the COVID-19 pandemic.122 Families also continue to steer away from DCPS early education programs, as nearly 53% of students enrolled attend charter or private institutions.123 Each ward also has seen an increase in early education enrollment.
118 Metropolitan Police Department (2022). 2022 biannual report. Retrieved August 1st, 2022 from https://mpdc.dc.gov/node/1649856
119 Turco, Rebecca. 2024. DC Mayor Bowser shares thoughts on modifying the Youth Rehabilitation Act. abc news. Retrieved on September 16, 2024 from https://wjla.com/news/local/washington-dc-youth-rehabilitation-act-crime-rate-carjacking-teen-arrestsyouth-crime-juvenile-crime-juvenile-justice-yra
120 DC Kids Count. (2022). Early childhood. Retrieved August 28, 2023 from datacenter.kidscount.org.
121 DC Kids Count. (2022). Early childhood. Retrieved August 28, 2023 from datacenter.kidscount.org.
122 DC Kids Count. (2022). Early childhood. Retrieved August 28, 2023 from datacenter.kidscount.org.
123 DC Kids Count. (2022). Early childhood. Retrieved August 28, 2023 from datacenter.kidscount.org.
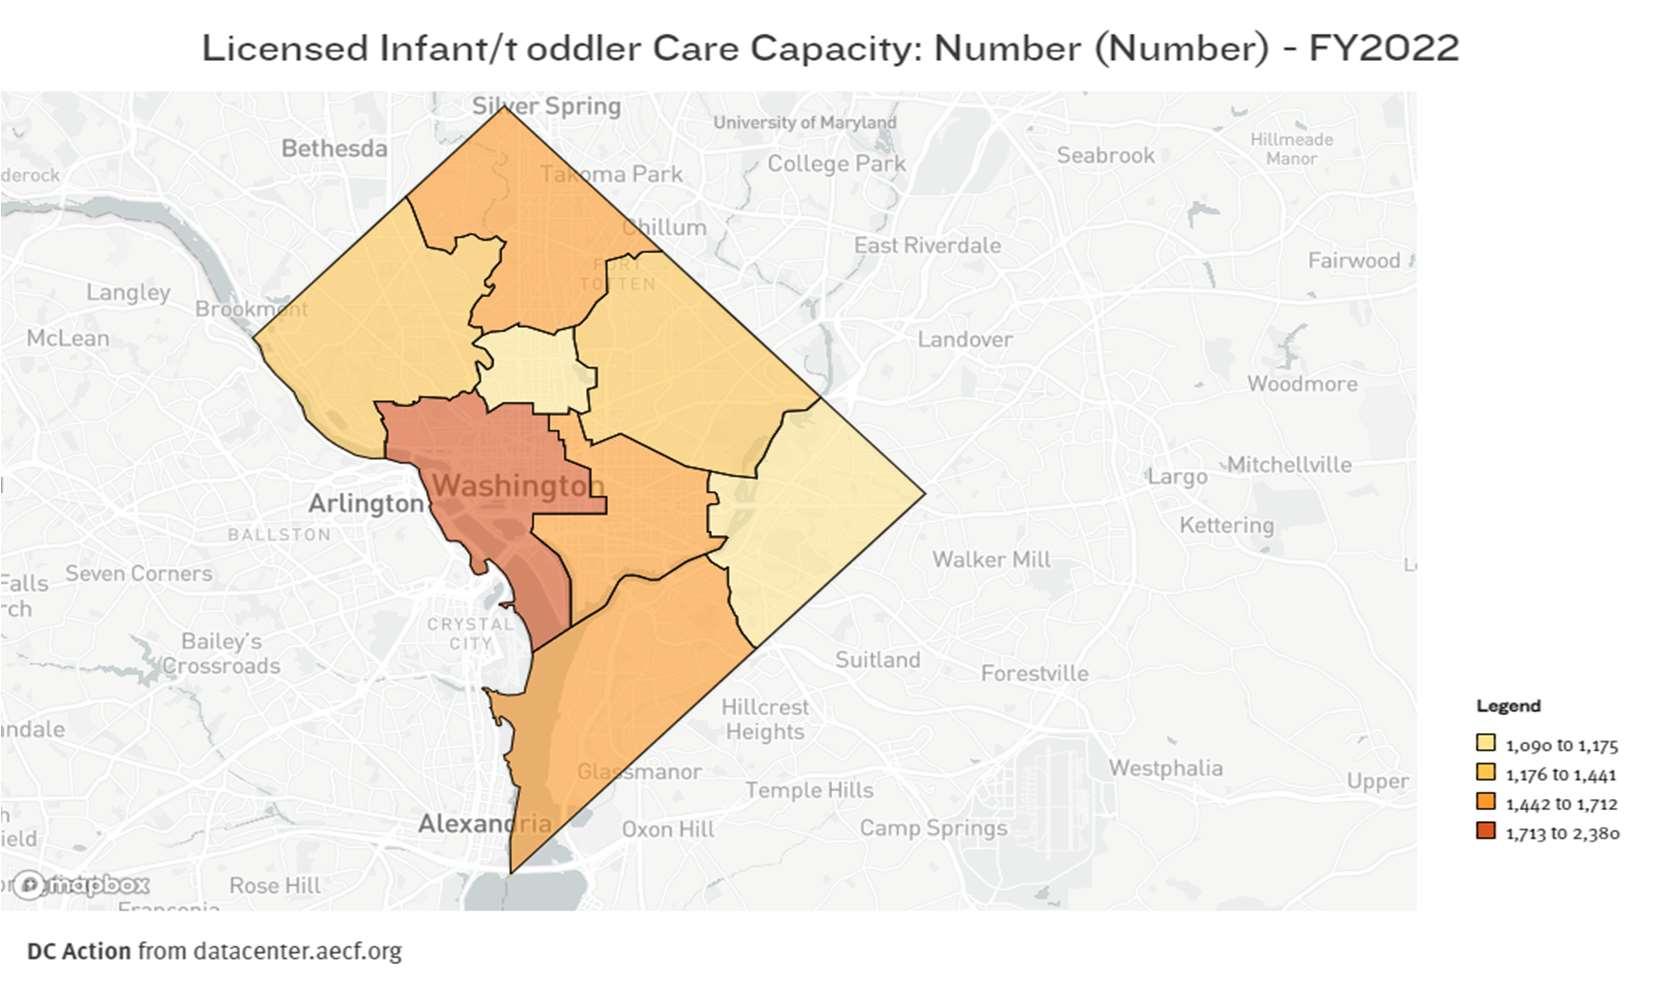
Figure 2: Capacity of early learning centers across the District, DC Action.
As early childhood enrollment continues to increase after the pandemic, the District has allocated $20.02 billion for programming. Compensation for early educators is now equivalent to public school teachers with similar educational experience. To achieve this, the District raised taxes on residents with high incomes. In order to continue to appropriately fund essential early childhood development programs, the District should continue to tax residents with higher incomes. Early childhood educators must now obtain the District minimum educational requirements, a bachelor’s degree in early childhood education, to teach in the District.124
Public school enrollment has stalled since the onset of the pandemic. In the 2020-2021 school year, there were 87,045 students enrolled in DC public and charters schools. Enrollment then dropped to 86,991 students in DPCS and PBCS schools for the 2022-2023 school year.125 Enrollment changes are most severe in elementary education as all but two wards saw a decrease in public and charter school enrollment.126 High school enrollment increased
124 Alliance for Early Success. 2023. State Early Childhood Policy Landscapes. Retrieved on August 28, 2023 from https://earlysuccess.org/district-of-columbia.
125 District off Columbia Public Schools. 2023. DC Public Schools Announces Enrollment Increase for the 2022-2023 School Year. Retrieved on August 28, 2023 from https://dcps.dc.gov/release/dc-public-schools-announces-enrollment-increase-2022-2023school-year#:~:text=DCPS%20enrollment%20increased%20to%2050%2C204,the%202019%2D2020%20School%20Year.
126 Coffin & Rubin. 2023. State of D.C. schools, 2021-22… Retrieved on August 28, 2023 from https://www.dcpolicycenter.org/publications/schools-21-22/
drastically across all wards however.127 Black students make up the majority of those enrolled in DC public and charter schools, with no grade band falling below 60% Black majority.128 The second largest racial group are Hispanic students, which make up around 19% across all grade bands.129 The racial make-up of DC students has remained mostly the same across the years.
Proficiency rates in both mathematics and English language arts (ELA) assessments have declined significantly, both compared to previous years in the District and national averages. In 2019, 34% of fourth grade students reached or exceeded expectations in math proficiency, but by 2022, only 24% of fourth graders met or exceeded expectations.130 Eighth grade scores also saw significant declines, as only 16% of students met or exceeded expectations for math. Fourth grade assessment scores in DC ranked tied for 50th in the country for both math and ELA proficiency.131
The decreases in public school enrollment, and stark decreases in ELA and math proficiency stem directly from the effects of the COVID-19 pandemic. The decrease in subject proficiency is not just relegated to the District, in fact, it is nationwide phenomenon researchers are struggling to find a solution for. Fourth grade students across the country saw proficiency scores decrease by the largest margin in 30 years.132 Students that were originally struggling before the pandemic are now falling farther behind. Lower test scores are often indicators that a child may become disengaged with education and fail to graduate or even attend high school.133 Nearly 49% of students were considered at-risk for the 2021-2022 school year, a 4% increase from the year over.134 The increase in at-risk students may have been caused by the increase of economic insecurity wrought by the pandemic, which often affected low-income families the hardest.
Beyond test scores, students are recovering emotionally from the impacts of the pandemic. Attendance declined dramatically in 2022, almost half of students missed 10% or more of the
127 Coffin & Rubin. 2023. State of D.C. schools, 2021-22… Retrieved on August 28, 2023 from https://www.dcpolicycenter.org/publications/schools-21-22/
128 Coffin & Rubin. 2023. State of D.C. schools, 2021-22… Retrieved on August 28, 2023 from https://www.dcpolicycenter.org/publications/schools-21-22/
129 Coffin & Rubin. 2023. State of D.C. schools, 2021-22… Retrieved on August 28, 2023 from https://www.dcpolicycenter.org/publications/schools-21-22/
130 Nations Report Card. 2023. State Profiles. Retrieved on August 28, 2023 from https://www.nationsreportcard.gov/profiles/stateprofile/overview/DC?cti=PgTab_Findings&chort=1&sub=MAT&sj=DC&fs=Grade &st=MN&year=2019R3&sg=Gender%3A%20Male%20vs.%20Female&sgv=Difference&ts=Single%20Year&tss=2019R3&sfj=NP.
131 Nations Report Card. 2023. State Profiles. Retrieved on August 28, 2023 from https://www.nationsreportcard.gov/profiles/stateprofile/overview/DC?cti=PgTab_Findings&chort=1&sub=MAT&sj=DC&fs=Grade &st=MN&year=2019R3&sg=Gender%3A%20Male%20vs.%20Female&sgv=Difference&ts=Single%20Year&tss=2019R3&sfj=NP.
132 Mervosh, Sarah. 2022. The pandemic erased two decases of progress in math and reading. New York Times. Retrieved on August 28, 2023 from https://www.nytimes.com/2022/09/01/us/national-test-scores-math-reading-pandemic.html.
133 Mervosh, Sarah. 2022. The pandemic erased two decases of progress in math and reading. New York Times. Retrieved on August 28, 2023 from https://www.nytimes.com/2022/09/01/us/national-test-scores-math-reading-pandemic.html.
134 Coffin & Rubin. 2023. State of D.C. schools, 2021-22… Retrieved on August 28, 2023 from https://www.dcpolicycenter.org/publications/schools-21-22/
school year.135 Students also struggled with mental health. When surveyed, 36% DCPS high school students reported feeling sad and hopeless.136 Female students were more likely to report mental health issues (48%) than their male peers (23%).137 Mental health issues may be the reason for poor attendance during the 21-22 academic year. If a student does not feel safe in their environment, they may not attend class. In 2022, 8% of DCPS high school students did not go to school because they felt unsafe on their way to, or back, from school.138 Distance from schools is also an issue for attendance, particularly in Wards 7 and 8. East of the Anacostia River, students on average travel three more miles to get to school, compared to the other six wards in D.C.139
There are several other disparities by race in the DCPS education system. Race is central in predicting where a child will attend school. Of students enrolled in DCPS, 60% of Black students live in Wards 7 and 8.140 Only 13% of Black students live in Wards 2 and 3.141 According to the D.C. Policy Center, a majority of Black students are found in five neighborhoods across Wards 7 and 8, and white students are found across three neighborhoods in Ward 3.142 Students residing in Wards 7 and 8 are also more likely to be considered at risk. Ward 8 is home to 24% of the DCPS elementary school population but encompasses 36% of the at-risk elementary school population.143
The District is well-known for high levels of educational attainment, with nearly 60% of residents holding a bachelor’s degree or higher.144 Education is the primary means to climbing the socio-economic ladder within the District. For those who have less than a high school education, the median income is $26,970, a fraction of the median household income in D.C.145
135 Coffin & Rubin. 2023. State of D.C. schools, 2021-22: in-person learning, measuring outcomes and work on recovery. D.C. Policy Center. Retrieved on September 18, 2023 from https://www.dcpolicycenter.org/publications/schools-21-22/
136 Coffin & Rubin. 2023. State of D.C. schools, 2021-22: in-person learning, measuring outcomes and work on recovery. D.C. Policy Center. Retrieved on September 18, 2023 from https://www.dcpolicycenter.org/publications/schools-21-22/
137 Coffin & Rubin. 2023. State of D.C. schools, 2021-22: in-person learning, measuring outcomes and work on recovery. D.C. Policy Center. Retrieved on September 18, 2023 from https://www.dcpolicycenter.org/publications/schools-21-22/
138 Coffin & Rubin. 2023. State of D.C. schools, 2021-22: in-person learning, measuring outcomes and work on recovery. D.C. Policy Center. Retrieved on September 18, 2023 from https://www.dcpolicycenter.org/publications/schools-21-22/
139 Coffin & Rubin. 2023. State of D.C. schools, 2021-22: in-person learning, measuring outcomes and work on recovery. D.C. Policy Center. Retrieved on September 18, 2023 from https://www.dcpolicycenter.org/publications/schools-21-22/
140 Sayin & Calma. 2023. Needs assessment of out-of-school time programs in the District of Columbia. D.C. Policy Center.
Retrieved on September 18, 2023 from https://www.dcpolicycenter.org/publications/ost-needs-assessment/
141 Sayin & Calma. 2023. Needs assessment of out-of-school time programs in the District of Columbia. D.C. Policy Center.
Retrieved on September 18, 2023 from https://www.dcpolicycenter.org/publications/ost-needs-assessment/
142 Sayin & Calma. 2023. Needs assessment of out-of-school time programs in the District of Columbia. D.C. Policy Center. Retrieved on September 18, 2023 from https://www.dcpolicycenter.org/publications/ost-needs-assessment/
143 Sayin & Calma. 2023. Needs assessment of out-of-school time programs in the District of Columbia. D.C. Policy Center.
Retrieved on September 18, 2023 from https://www.dcpolicycenter.org/publications/ost-needs-assessment/
144 U.S. Census Bureau. 2023. American community survey 1-year estimates. Table S1501.
145 U.S. Census Bureau. 2023. American community survey 1-year estimates. Table S1501.
Comparatively, individuals with a high school education make$ 38,599, or a 43% increase. Those with a bachelor’s degree have even greater gains. The median income for those who have graduated college is $83,903, or about a 117% increase from those with just a high school education. The poverty rate is significantly higher for those who do not hold a college or high school degree. Those lacking either degree have a poverty rate of 37%, compared to high school and college degree holders, who experience poverty 25% and 16% of the time, respectively.146
There are racial disparities between those who have a college degree, a high school degree, or neither. Almost 95% of white high schoolers graduate with a GED or diploma.147 Meanwhile, Black and Hispanic students have a much lower rate of graduation, at 89% and 87% respectively.148 There is a significant disparity between college degrees, by race. Only 34% of Black individuals hold a college degree. White college degree holders make up 92% of the white adult population, while Hispanic degree holders make up 65%.149
In addition to schools serving students from K-through-12, D.C. has schools that serve adults seeking to complete their GED. In 2022, there were 5,090 adults attending D.C. sponsored educational programs.150 This is an increase of nearly 15%. The Office of the State Superintendent of Education (OSSE) provides the DC ReEngagement Center (REC) as a “single door” through which youth ages 16-24 who are not enrolled in school can reconnect with potential educational options.
In the 2021-22 academic year, 15% of the DCPS student population were identified as students with special education needs.151 Of the students with special education needs, nearly 75% were enrolled in elementary and middle schools.152 Wards 7 and 8 enroll a majority of students with special educational needs. As many as 47% of elementary and middle school students with special education needs reside in Wards 7 and 8. For high school students with special needs, the proportion increases to 51%.153
146 U.S. Census Bureau. 2023. American community survey 1-year estimates. Table S1501.
147 U.S. Census Bureau. 2023. American community survey 1-year estimates. Table S1501.
148 U.S. Census Bureau. 2023. American community survey 1-year estimates. Table S1501.
149 U.S. Census Bureau. 2023. American community survey 1-year estimates. Table S1501.
150 Coffin & Rubin. 2023. State of D.C. schools, 2021-22… Retrieved on August 28, 2023 from https://www.dcpolicycenter.org/publications/schools-21-22/
151 Calma, Emilia. 2023. While we know where students with special education needs live and go to school more study is needed to address gaps in accessibility for out-of-school time programs. D.C. Policy Center. Retrieved on September 18, 2023 from https://www.dcpolicycenter.org/publications/special-education-ost-testimony/
152 Calma, Emilia. 2023. While we know where students with special education needs live and go to school more study is needed to address gaps in accessibility for out-of-school time programs. D.C. Policy Center. Retrieved on September 18, 2023 from https://www.dcpolicycenter.org/publications/special-education-ost-testimony/
153 Calma, Emilia. 2023. While we know where students with special education needs live and go to school more study is needed to address gaps in accessibility for out-of-school time programs. D.C. Policy Center. Retrieved on September 18, 2023 from https://www.dcpolicycenter.org/publications/special-education-ost-testimony/
Low-income residents in cities across the country often don’t rely on private transportation such as cars to commute to work. Many low-income workers use city buses and metros to reach their destinations. According to recent census data, 34% of individuals in the District do not have access to a car. The percentage increases to 45%, if you only include renters.154
A decline in ridership as a result from the COVID-19 pandemic has threatened to financially disrupt many public transportation services across the country. The District of Columbia is no exception. In what advocates are calling a “transit death spiral” Washington Metropolitan Area Transit Authority (WMATA) was projected to have a $750 million dollar deficit in 2024 if revenue does not increase accordingly.155 The WMATA projects that there could be a 67% reduction in services, which would lead to longer wait times for both trains and buses.156 Ridership has decreased by 50% since the start of the pandemic in 2020.157
To discourage turnstile jumping (commonly referred to as hopping), WMATA has installed new higher, stronger faregates as part of the system wide rollout. These changes have taken place after WMATA had already installed new faregates across many metro stations. The taller faregates also coincide with an increase in the cost of fines hopping passengers are given, if caught. But notoriously, WMATA enforcement has been lacking in recent years in preventing faregate hopping. Activists claim that the new enforcement procedures will lead to police harassment. WMATA hopes to collect the estimated $40 million lost to fair evasion in 2024.158
The looming threat of WMATA financial collapse as well as increased fare evasion enforcement directly impacts low-income residents the most. First, an increase in wait-times may lead to some residents who rely on public transportation to be late for work or other important matters. For example, if WMATA eliminates night transit options, workers who work longer hours may
154 U.S. Census Bureau. 2022. American community survey. Table DP04.
155 Hamburg, Daniel. 2023. Metro projects $750 million deficit, which could lead to reduction in bus, rail service. Retrieved on September 11, 2023 from https://www.dcnewsnow.com/news/local-news/washington-dc/metro-projects-750-million-deficitwhich-could-lead-to-reduction-in-bus-rail-service/.
156 Hamburg, Daniel. 2023. Metro projects $750 million deficit, which could lead to reduction in bus, rail service. Retrieved on September 11, 2023 from https://www.dcnewsnow.com/news/local-news/washington-dc/metro-projects-750-million-deficitwhich-could-lead-to-reduction-in-bus-rail-service/.
157 Hamburg, Daniel. 2023. Metro projects $750 million deficit, which could lead to reduction in bus, rail service. Retrieved on September 11, 2023 from https://www.dcnewsnow.com/news/local-news/washington-dc/metro-projects-750-million-deficitwhich-could-lead-to-reduction-in-bus-rail-service/.
158 Winston, Skyler. 2023. New DC metro bill threatens fare evaders. Retrieved on September 11, 2023 from https://thehilltoponline.com/2023/08/21/new-dc-metro-bill-threatens-fare-evaders/
face difficulty commuting from work. Secondly, if WMATA increases fare enforcement, lowincome residents who opt to avoid payment may face obstacles with law enforcement, which could lead to a ticket or potential escalation of violence.
Decreases in public transit options and efficiency may also incentivize some individuals to take private transportation, such as cars. If this is the case, traffic will increase in volume, resulting in frustration for pedestrians, cyclists, and commuters alike.
Traffic continues to frustrate many in the District. For those who have access to a car, traffic is a major issue regardless of socio-economic status. The District is notorious for bad traffic. In fact, the commute times in D.C. are the longest in the country, according to one NPR article. The average commute time in D.C. is 43 minutes.159 While D.C. has higher salaries than other cities across the country, the cost of living is much higher. Therefore, D.C. has a strong commuting population from Virginia and Maryland.
As a response to high levels of traffic across the District, the current administration has increased the number of tickets that residents receive if they are caught speeding. The increase in traffic tickets distributed is a result of newly implemented speeding cameras.160 The District has also implemented laws preventing vehicles from turning right on red by 2025.161 Through more intense traffic enforcement, the city seeks to increase its revenue. Tougher enforcement also may incentivize commuters to take public transportation.
A high volume of automobiles entering and exiting D.C. each day leads to high levels of traffic, as well as traffic-related fatalities. On average, traffic deaths have increased in the District each year since 2012. Traffic fatalities since the pandemic have continuously surpassed 30 deaths a year.162
159 Berkon, Eliza. 2020. D.C. has some of the longest commute times in the country. What help is available? NPR. Retrieved on September 11, 2023 from https://www.npr.org/local/305/2020/01/24/799292338/d-c-has-some-of-the-longest-commutes-in-thecountry-what-help-is-available#:~:text=Commutes%20here%20are%20among%20the,more%20to%20work%20every%20day.
160 Dil, Cuneyt. 2023. House republics want to intervene in D.C. traffic. Axios. Retrieved on September 11, 2023 from https://www.axios.com/local/washington-dc/2023/06/23/dc-traffic-house-republicans
161 Dil, Cuneyt. 2023. House republics want to intervene in D.C. traffic. Axios. Retrieved on September 11, 2023 from https://www.axios.com/local/washington-dc/2023/06/23/dc-traffic-house-republicans
162 Metropolitan Police Department. 2023. Traffic fatalities as of September 11, 2023.MPD. Retrieved on September 11, 2023 from https://mpdc.dc.gov/page/traffic-data
The world continues to feel the impact of climate change, and the District is no different. While the DMV area has not recorded record high temperatures like elsewhere in the country, climate change has still brought substantial changes to the environment.
The District is primarily threatened by the impact of heavy rain and flooding.163 D.C. is susceptible to riverine, costal and interior flooding.164 In a recent report, researchers estimate that 16,000 properties in D.C. have a one in four chance of being severely affected by flooding in the next 30 years.165 Dealing with constant flooding can be expensive. The cost to prevent flooding is often the reason flooding disproportionately affects low-income residents in the District. Nearly 90% of the properties at-risk of flooding are located in Wards 7 and 8.166
Urban environments are often hotter than their rural counterparts. A “heat island” refers to an urban area that is significantly warmer due to a lack of shade or trees. For this reason, neighborhoods such as Fort Totten, Pleasant Plains and Columbia Heights are significantly hotter than neighborhoods such as Palisades or Chevy Chase.167 Working outdoors in heat islands can be difficult and many who reside in these neighborhoods end up paying more in electricity.168 Poorer residents are at greater risk of heatstroke or heat illnesses as a result of limited access to healthcare.169 Other common indicators of poorer neighborhoods, such as a lack of local grocery stores and lower car ownership, work to exacerbate the issues brought by urban heat islands.170
163 Scott, Michon. 2019. Prepare for more downpours: heavy rain has increased across most of the United States, and is likely to increase further. Climate.gov. Retrieved on September 11, 2023 from https://www.climate.gov/news-features/featuredimages/prepare-more-downpours-heavy-rain-has-increased-across-most-united-0 164 Jauregui-Volpe, Marcelo. 2023. The hidden costs of flooding in D.C’s poorest wards. Washington City Paper. Retrieved on September 11, 2023 from https://washingtoncitypaper.com/article/619983/the-hidden-costs-of-flooding-in-d-c-s-poorest-wards/ 165 Jauregui-Volpe, Marcelo. 2023. The hidden costs of flooding in D.C’s poorest wards. Washington City Paper. Retrieved on September 11, 2023 from https://washingtoncitypaper.com/article/619983/the-hidden-costs-of-flooding-in-d-c-s-poorest-wards/ 166 Jauregui-Volpe, Marcelo. 2023. The hidden costs of flooding in D.C’s poorest wards. Washington City Paper. Retrieved on September 11, 2023 from https://washingtoncitypaper.com/article/619983/the-hidden-costs-of-flooding-in-d-c-s-poorest-wards/ 167 hola. 2021. Summer heat can lead to adverse health reactions for residents across D.C. Hola Cultura. Retrieved on September 11, 2023 from https://holacultura.com/d-c-heat-islands-and-how-heat-affects-human-health/ 168 hola. 2021. Summer heat can lead to adverse health reactions for residents across D.C. Hola Cultura. Retrieved on September 11, 2023 from https://holacultura.com/d-c-heat-islands-and-how-heat-affects-human-health/ 169 hola. 2021. Summer heat can lead to adverse health reactions for residents across D.C. Hola Cultura. Retrieved on September 11, 2023 from https://holacultura.com/d-c-heat-islands-and-how-heat-affects-human-health/ 170 hola. 2021. Summer heat can lead to adverse health reactions for residents across D.C. Hola Cultura. Retrieved on September 11, 2023 from https://holacultura.com/d-c-heat-islands-and-how-heat-affects-human-health/
During heat waves, the effects of urban heat islands and climate change can be especially deadly. D.C. experiences a “Moist Tropical +” air mass nearly every summer. Moist Tropical + air mass is hotter and more humid than other kinds of tropical air masses found throughout the U.S. Moist Tropical + can cause heat exhaustion, heart attacks, strokes and respiratory failures.171 Temperatures during the summer, like the rest of the country, are expected to increase in the upcoming years. Providing adequate shade can increase health benefits drastically.
As part of the Inflation Reduction Act, the U.S. Forest Services announced that D.C. would receive $34 million to plant trees to promote “tree equity”.172 The federal money will pay for the planting of 10,000 new trees, the maintenance of 30,000 young trees and tree plantings at 75 schools.173 Under the conditions of the grant funding, all of the money must go towards work in underserved communities.174
171 Hola. 2021. Cooling D.C. requires thinking about who’s most vulnerable to heat. Hola Cultura. Retrieved on September 11, 2023 from https://holacultura.com/cooling-d-c-requires-thinking-about-whos-most-vulnerable-to-heat/
172 Fenston, Jacob. 2023. D.C area gets tens of millions in funding for ’tree equity’. DCist. Retrieved on September 18, 2023 from https://dcist.com/story/23/09/15/dc-millions-grant-funding-tree-equity/
173 Fenston, Jacob. 2023. D.C area gets tens of millions in funding for ’tree equity’. DCist. Retrieved on September 18, 2023 from https://dcist.com/story/23/09/15/dc-millions-grant-funding-tree-equity/
174 Fenston, Jacob. 2023. D.C area gets tens of millions in funding for ’tree equity’. DCist. Retrieved on September 18, 2023 from https://dcist.com/story/23/09/15/dc-millions-grant-funding-tree-equity/
This section highlights the range of services available to District residents, including the processes for accessing those services with examples of providers. The District provides a variety of programs and services meant to combat poverty, though often these programs and services are underfunded or unreliable.
This section also highlights the number of services provided to residents by UPO. CSGB eligible District residents are eligible for UPO services as well. UPO primarily provides services in Wards 5, 6, 7 and 8. Due to data limitations, not every service UPO has been provided has been recorded for this report. Of the services that have been tracked, UPO provided over 12,000 services (not including EBT) to District residents from January 2021 to January 2024.
An average UPO resident is female, single, uses Medicaid, between the age of 25-44, Black, has no high school diploma and has been unemployed longer than six months, according to internal UPO data. The distribution of services across the District can be seen below:
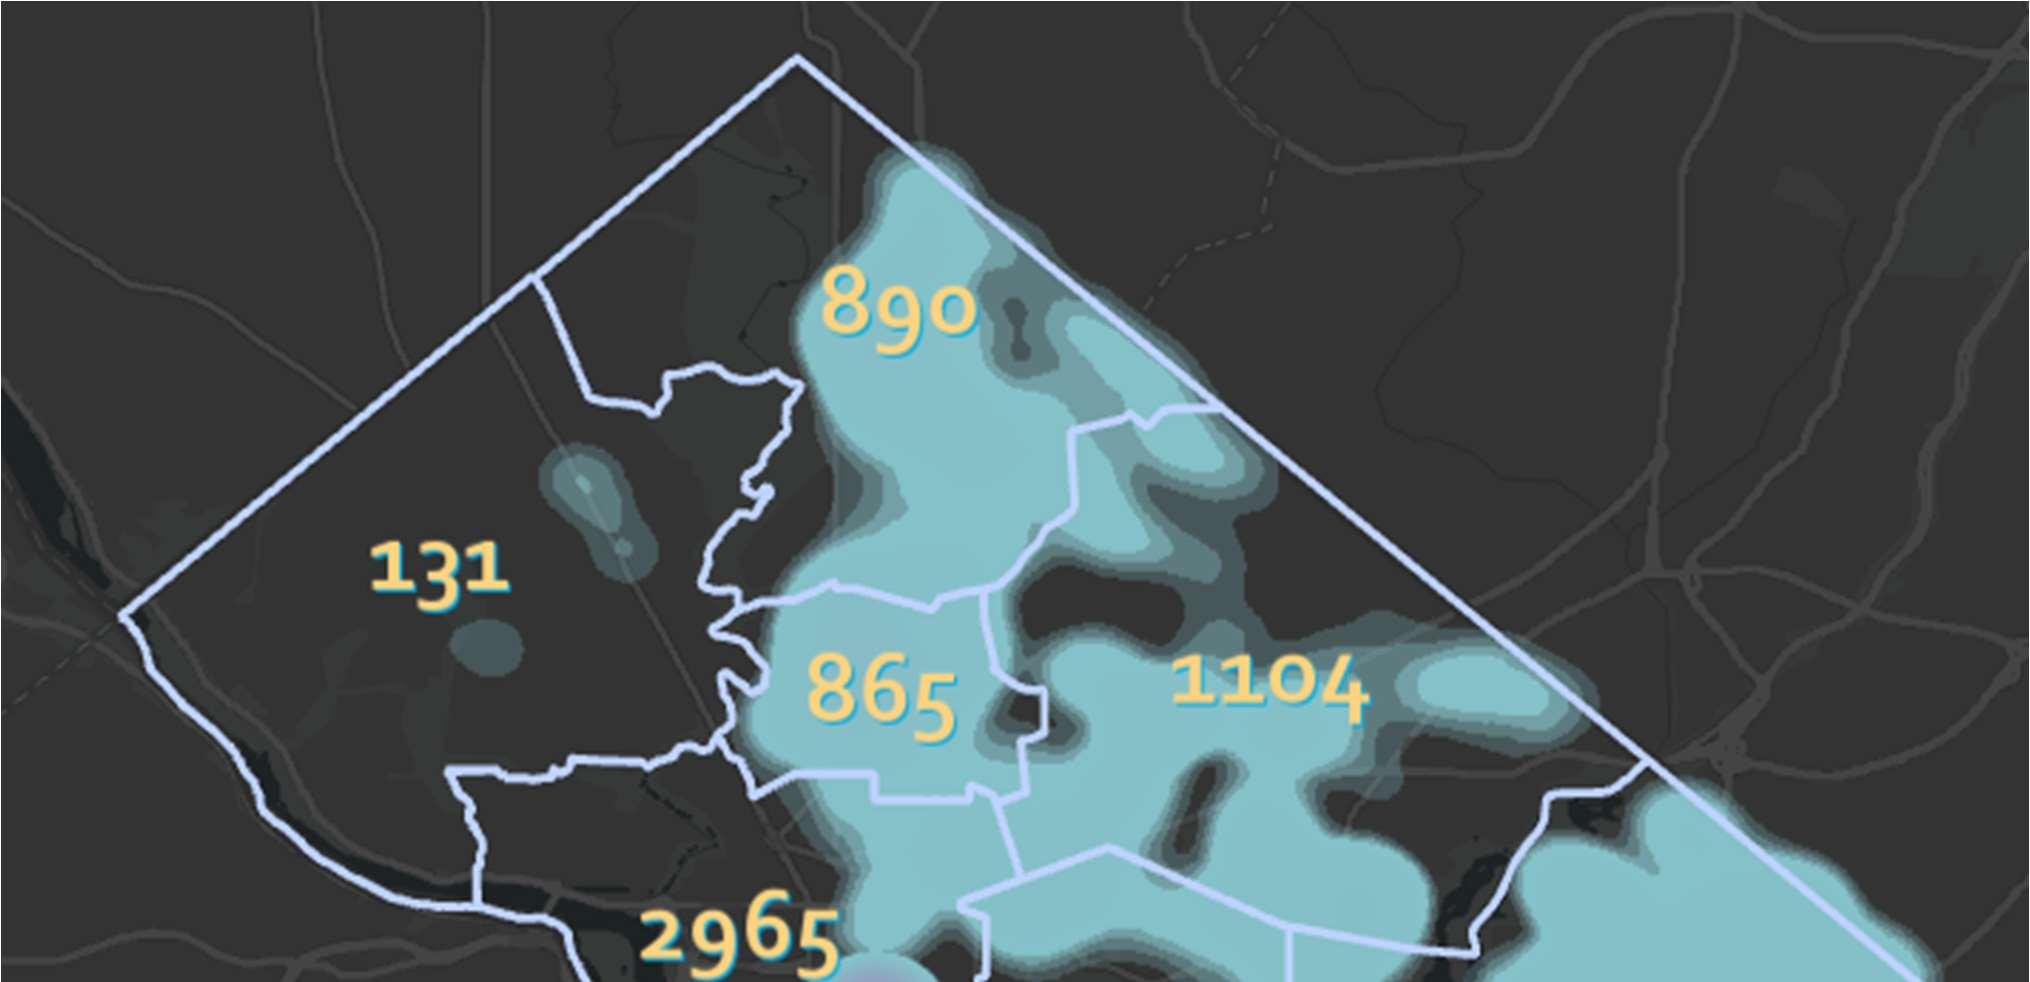
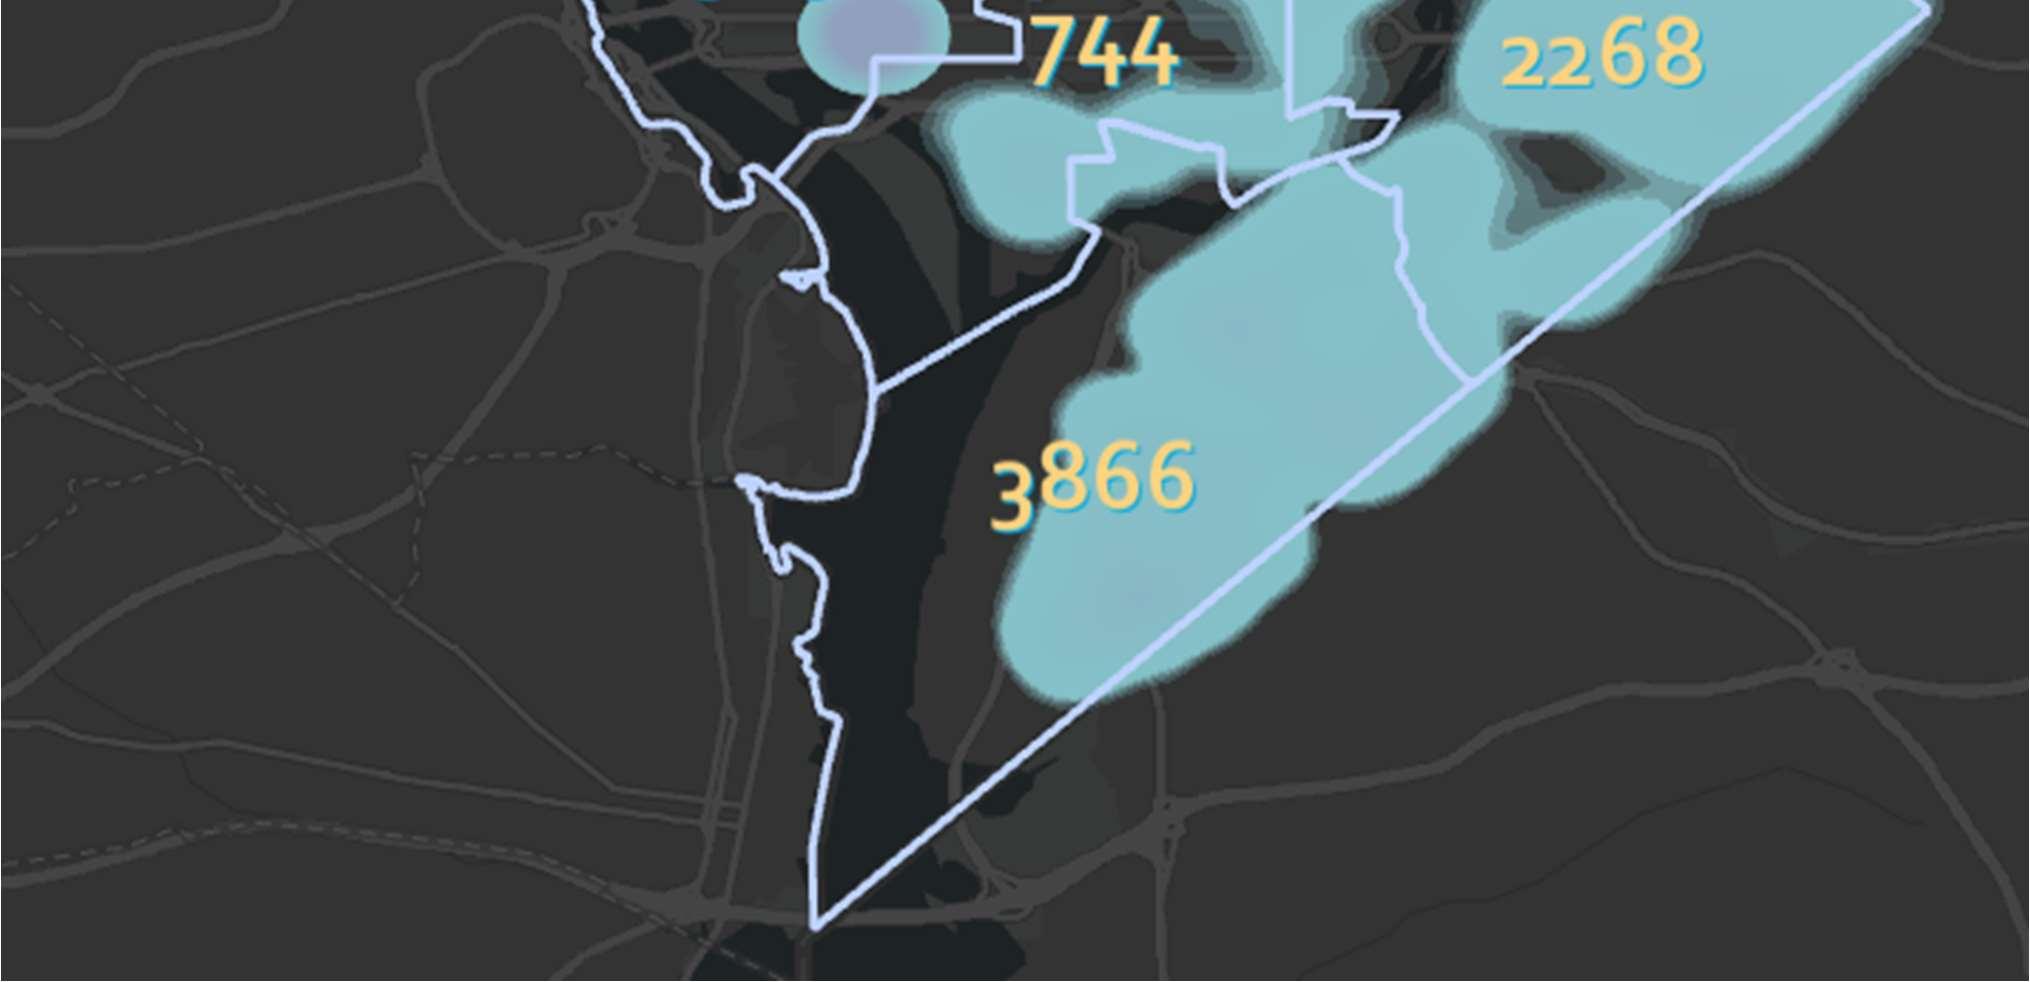
The majority of UPO customers reside in Ward 8, with nearly 4,000 total services provided to residents of that Ward. Very few UPO customers live in Ward 3, which reflects the economic disconnection between Ward 3 and the poorer areas of the District. From January 1st, 2021, to January 1st, 2024, 2,965 services were provided to residents residing in Ward 2. While Ward 2 is
considered a wealthy area of the District, the ward has undergone significant gentrification in recent years, particularly in the Eastern side of the ward.
The services outlined below include some of the need categories included in the Unite US and UPO service data. However, this narrative also examines other service sectors, provides examples of community-based organizations that provide those services, and includes links to useful resources on obtaining those services.
There are nonprofit organizations throughout the District that support families by providing direct services and making referrals to other service providers for case management, housing, employment, and school-based services. Nonprofits that specifically provide services include Families First DC, Collaborative Solutions for Communities, Georgia Avenue Family Support Collaborative, Edgewood/Brookland Family Support Collaborative, East River Family Strengthening Collaborative, Far Southeast Family Strengthening Collaborative. Other referral programs are provided by the Strong Families Program Division. The Families First DC program is specifically catered towards families in Wards 7 and 8.
There are several support options for childcare, primarily provided by My Child Care DC. The website provides services from OSSE, private and home-based child-development services and facilities that accept subsidy vouchers.
More information can be found at https://mychildcare.dc.gov/.
The DC Home Visiting Council states that “Home visiting programs support expectant parents and the families of young children before childbirth and in the earliest months and years of a child's life. Participation in home visiting programs is voluntary and serves as a preventative and early intervention resource for families. In these programs, trained family support workers visit families in their homes, or wherever families are most comfortable, and provide a wide variety of services meant to help families meet their goals.”
DC’s home visiting providers include UPO, the Healthy Babies Project, and Mary’s Center. A full list can be found at http://www.dchomevisting.org.
The Developmental Disabilities Council has identified non-profits that support children with disabilities and developmental delays. Some of these organizations include Georgetown University Center for Child and Human Development, Advocates for Justice and Education and Health Services for Children with Special Needs.
More information can be found at https://ddc.dc.gov/page/community-resources-ddc.
The District of Columbia also provides assistance for infants and toddlers with developmental delays or disabilities. The Strong Start DC Early Intervention provides in-person visit upon parental request. The program serves as the single point of entry for infants and toddlers in Washington DC whose families have concern about their development.
More information can be found at https://osse.dc.gov/service/strong-start-dc-earlyintervention-program-dc-eip.
Healthy Futures is based on the Early Childhood Mental Health Consultation (ECMHC) model, an evidence-based approach to support young children's social-emotional development and address challenging behaviors in early learning environments. The DC Department of Behavioral Health operates Healthy Futures, and it works through early childhood education centers and homes to build capacity in 59 childcare providers to promote social-emotional development, prevent escalation of challenging behaviors, and support referrals for additional assessments and services. More information on Healthy Futures can be found at https://dcchildcareconnections.org/resource/department-of-behavioral-health-dbhhealthyfuturespcit/.
Help Me Grow DC is an information and referral helpline for District residents that provides parents, physicians, and providers with the knowledge and resources they need to make a difference in the lives of expectant parents and families with children through the age of five. Help Me Grow services include: personal care coordination, free child development and
perinatal screenings, answers to pregnancy, parenting and child development questions, and connection to community resources.
More information on Help Me Grow can be found at https://helpmegrow.dc.gov
The District of Columbia recognizes the struggle that many families go through in finding affordable housing. Thus, the District created an online tool, the DC Housing search, to make it easy for residents to find affordable housing that is available at any given time.
More information can be found at https://www.dchousingsearch.org/index.html
Services for residents experiencing homelessness are separated into services for families with children and residents without children.
For families and individuals experiencing homelessness, there is the Coordinated Assessment and Housing Placement, which “ensures standardized access and assessment for all individuals and families experiencing homelessness in the District.” Households receive referral for housing, like permanent housing, targeted affordable housing and rapid rehousing.
For individuals experiencing homelessness, there is the emergency shelter program, which provides shelters on a first-come, first-served basis.
There are several programs available for rapid rehousing and permanent housing for individuals and families experiencing homelessness. Rapid Rehousing for Individuals is a short-term subsidy program that assists individuals experiencing homelessness to find affordable permanent housing. Permanent housing is an evidence-based intervention that combines housing assistance through a permanent rental subsidy with voluntary supportive services to address the needs of chronically homeless individuals or families.
More information can be found at https://dhs.dc.gov/page/services-individuals-experiencinghomelessness.
ERAP helps residents earning less than 40% of the Area Median income who are facing housing emergencies. Residents may also use ERAP to pay for security deposits.
More information can be found at https://erap.dhs.dc.gov/ Services for Homeless Students
Every DCPS school has a staff member (a liaison) who coordinates services to students experiencing homelessness, providing services funded under the federal McKinney-Vento Act. McKinney-Vento liaisons assist students and families with transportation assistance, school uniforms, school supplies and provide information regarding in-school or community-based resources.
Residents seeking jobs can receive guidance by visiting one of the District’s American Job Centers under the DC Department of Employment Services (DOES). DOES identifies key providers within the District that connect District residents with in-demand job training skills.
More information can be found at https://dcworks.dc.gov/page/provider-directory.
There are two programs available to all residents with low-incomes, Medicaid and Healthcare Alliance. While Medicaid is federally funded, Healthcare Alliance is only available in the District. Through these combined programs, many District residents can obtain health insurance. There are also supplementary non-profit organizations which provide free healthcare as well as mental health services, private or funded through the District government.
Services
The Department of Aging and Community Living has several services available to District seniors such as protective services, nutrition services, and transportation.
There are also numerous non-profits across the District that provide necessary food relief for low-income seniors, such as We Are Family.
More information can be found at https://dacl.dc.gov/services.
The District administers a number of federal food assistance programs, and it also operates several local programs. In addition, several non-profit organizations in the District offer food services.
The federally funded food programs include: Supplemental Nutrition Assistance Program (SNAP): SNAP provides electronic benefits that allow households with low incomes to purchase groceries at retail stores or online. School breakfast and lunch: The District provides free breakfast and lunch in all K-12 schools. Summer meals: The District offers free meals in the summer through recreation centers and schools. Special Supplemental Food Program for Women, Infants, and Children (WIC): The WIC program provides a select set of free foods (such as milk and cereal), as well as nutrition education, to pregnant women and children up to age five. Commodity Supplemental Food Program (CSFP): The District provides free USDA commodity foods to seniors with low incomes through this program. Child and Adult Care Food Program (CACFP): This program provides free meals through early childhood education centers, afterschool programs for youth, and centers serving seniors or adults with disabilities. In addition, the District operates other services to help residents get free food or free meals. Afterschool meals for children: The District offers free meals to children after school through several recreation centers. Produce Plus: The District provides vouchers to residents with low incomes to help them purchase produce at farmers’ markets.
DC residents facing domestic violence can seek a variety of services, largely from non-profit organizations, including emergency housing, permanent housing, financial assistance, legal assistance and mental health services. A list of services for residents facing domestic violence can be found at https://dcadv.org/resources/get-help/.
There are also organizations that provide direct relief. These include the Family Violence Prevention and Services Program, House of Ruth, Ujima, My Sister’s Place and DC Victim Hotline. The District government has been proactive in combatting domestic violence through the MPD Domestic Violence Unit and Domestic Violence Intake Center.
Several organizations in the District offer free legal assistance to DC residents with low incomes, including legal help with housing, employment, family needs (such as divorce or child support), public benefits, immigration issues, and more. A list of free legal services and providers can be found at https://wwww.lawhlep.org/dc .
A collection of volunteers and direct service providers operate a mutual aid network to help fill in the gaps in District government programs and existing non-profit service providers. Mutual aid volunteers deliver food and meals, provide transportation to medical appointments, help residents buy medical supplies and more. Information on DC’s mutual aid network can be found at https://themamdc.com/
Introduction
After nearly five years of a continuous decrease in juvenile arrests, criminal activity amongst teenagers (often referred to as juveniles) increased drastically in 2022 and 2023. Before 2022, criminal activity amongst juveniles resulted in approximately 600-800 juvenile arrests per year before falling significantly during the coronavirus pandemic (2020-2021). Yet starting in 2022, criminal activity amongst teenagers skyrocketed, specifically, violent crime. The Metropolitan Police Department (MPD) recorded nearly 1,600 juvenile arrests in 2022, a 31% increase from 2021. In the first half of 2021, there were 247 juveniles arrested for violent crime. In the first half of 2023, the number of arrests increased to 363, a 47% increase. While nowhere near the 735 juveniles arrested in the first half of 2016, the increase is alarming. Especially considering that many of the teenagers arrested for violent crimes are first time offenders (meaning their record is clean before their first crime). D.C. police have noted that 97 juveniles arrested in 2022 have been charged for violent crimes on their first arrest.175
While this trend is concerning, crime on aggregate (non-violent and violent crime) has steadily decreased in the District over the years. Much of the sensationalism surrounding juvenile crime
175 Oberg, Ted. 2022. Violent crimes involving young suspects on rise in D.C. NBC Washington. Retrieved on August 29, 2023 from https://www.nbcwashington.com/news/local/violent-crimes-involving-young-suspects-on-rise-in-dc/3243141/
is in reaction to increased violence, rather than increased reports of crime, overall. By September 2024, violent crime had dropped by 35%.176 This special section seeks to uncover the growing trends in juvenile violent crime within the District as well as identify possible solutions to the growing violent activity.
An important statistic that often gets overlooked is the number of juveniles participating in criminal or violent activity. While the number of juvenile related arrests have increased since the end of the COVID-19 pandemic, proportional to the number of youths within the city, very few children are committing crimes. From research conducted by the Criminal Justice Coordinating Council (CCJC), only 4.2% of youth participate in crime, let alone violent crime. Of the 4.2% of youth involved with the justice system, 77% were enrolled in DCPS or PCS.177
Justice involved youth often face more hardship at home than their non-justice involved counterparts. For example, 10% of justice involved students were experiencing homelessness at the time of their arrest, compared to 4% of non-justice involved students who were arrested. Moreover, justice involved juveniles had a reported 38 unexcused absences from school, three times the rate for non-justice involved youth. Juveniles involved with the justice system were also more likely to experience health concerns. For those involved in the justice system, 35% recorded comorbid disorders, 6% recorded psychotic disorders, 13% recorded a specific learning disorder and 5% indicated some kind of motor disorder. The health concerns experienced by juveniles in the justice system are significantly higher than the reported. 178
Age, gender and race are significant variables in determining the likelihood of youth becoming involved in the justice system. Of the children surveyed for the CJCC report, 92% of the juveniles were black, 72% were male and the average age of respondents was 15.5 years of age. These findings are consistent with the literature at large.179
176 Metropolitan Police Department. 2024. Year-to-date crime comparison. Retrieved on September 12, 2024 from https://mpdc.dc.gov/page/district-crime-data-glance
177 Sill, Kaitlyn. 2020. A study of the root causes of juvenile justice system involvement. Criminal Justice coordinating Council. Retrieved on January 3, 2024 from https://cjcc.dc.gov/sites/default/files/dc/sites/cjcc/CJCC%20Root%20Cause%20Analysis%20Report_Compressed.pdf
178 Sill, Kaitlyn. 2020. A study of the root causes of juvenile justice system involvement. Criminal Justice coordinating Council. Retrieved on January 3, 2024 from https://cjcc.dc.gov/sites/default/files/dc/sites/cjcc/CJCC%20Root%20Cause%20Analysis%20Report_Compressed.pdf
179 Sill, Kaitlyn. 2020. A study of the root causes of juvenile justice system involvement. Criminal Justice coordinating Council. Retrieved on January 3, 2024 from https://cjcc.dc.gov/sites/default/files/dc/sites/cjcc/CJCC%20Root%20Cause%20Analysis%20Report_Compressed.pdf
Specifically, the probability of a District youth being involved within the justice system peaks at 15.5 years. Researchers have noted that younger and older youth are less likely to commit crimes than their 15-year-old counterparts.180
Of the 922 juveniles arrested in DC from January to June 2023 (though some may be from out of state), 50 juveniles were arrested for armed carjackings.181 An additional 96 juveniles were arrested for illegal possession of a firearm or ammunition.182 The high rates of gun possessions in turn lead to high rates of gun violence. As of writing, there have been 15 juveniles that have been victims of gun-related homicides in DC.183 Of the carjackings committed in 2023, 75% of carjackings involved a firearm.184 District residents are increasingly concerned about the rising number of youths arrested for carjackings and armed carjackings, with headlines frequently reporting arrests of children as young as twelve. MPD has admitted uncertainty regarding the reasons behind the high rate of juvenile carjackings citywide.185 From 2016-2022, there has been an average of 52 arrests per 1,000 children between the ages of 10-17, twice the rate of the national average.186 This period also saw a noticeable increase in arrests for violent offenses among juveniles with no prior charges.
The surge in armed violent offenses can be linked to the overall increase in firearms within the District. In 2022, MPD has recovered more than 2,700 firearms.187 Many of those guns come from Virigina. According to Attorney General Brian Schwalb, “Virginia is, by far, the source state for the most illegal firearms recovered in D.C.”
In December of 2023, the U.S. Attorney for the District of Columbia, Mathew Graves, met with D.C. councilmembers to discuss the inflow of guns into the city. Graves claimed that D.C.’s
180 Sill, Kaitlyn. 2020. A study of the root causes of juvenile justice system involvement. Criminal Justice coordinating Council. Retrieved on January 3, 2024 from https://cjcc.dc.gov/sites/default/files/dc/sites/cjcc/CJCC%20Root%20Cause%20Analysis%20Report_Compressed.pdf
181 Metropolitan Police Department. 2023. Biannual report January-July. Retrieved on November 27, 2023 from https://mpdc.dc.gov/page/biannual-reports-juvenile-arrests
182 Metropolitan Police Department. 2023. Biannual report January-July. Retrieved on November 27, 2023 from https://mpdc.dc.gov/page/biannual-reports-juvenile-arrests
183 Carbone, Mariel. 2023. Crime in DC: our children speak. DC News Now. Retrieved on November 27, 2023 from https://www.dcnewsnow.com/news/local-news/washington-dc/crime-in-dc-our-children-speak/
184 Uliano, Dick. 2023. DC police don’t’ know what’s driving high rate of juvenile carjackings. WTOP news. Retrieved on December 18, 2023 from https://wtop.com/dc/2023/10/police-cast-light-on-their-efforts-to-curb-car-jacking/ 185 Uliano, Dick. 2023. DC police don’t’ know what’s driving high rate of juvenile carjackings. WTOP news. Retrieved on December 18, 2023 from https://wtop.com/dc/2023/10/police-cast-light-on-their-efforts-to-curb-car-jacking/ 186 Mason, Hannah. 2023. D.C. voices: juvenile justice. D.C. Policy Center. Retrieved on December 4, 2023 from https://www.dcpolicycenter.org/publications/dc-juvenile-justice/ 187 Davies, Emily. 2022. Shootings of youths are soring in D.C., vexing city leaders. The Washington Post. Retrieved on December 18, 2022 from https://www.washingtonpost.com/dc-md-va/2022/12/11/youth-gun-violence-dc/
system is not good enough at preventing the inflow of illegal firearms.188 For arrested individuals who are released before conviction, Graves claims it is far too easy for criminals to re-arm themselves.
Unlike other states, the District does not have direct control over the judicial system. Instead, the District court system works in tandem with the federal government to determine the outcomes for arrested juveniles. As a result, the process of sending a juvenile through the legal system is rather lethargic. More about the legal process is shown in Figure 5:
If a juvenile is arrested, they are initially processed by MPD at the Youth Services Center (YSC). If the offense is serious or violent, the police officer at YSC is responsible for a videotaped interview with the arrested child.189 The child is also advised of their rights of silence and their rights to an attorney.190 If the arrest is not violent, then the parents are notified of the child’s arrest. After the arrest, there are three different actions MPD may take. In both cases, the child is photographed and fingerprinted.191 They may release the child through a community release or dismissal (no charges), send the child to Court Social Service (CSS) Intake Screening, or referral the child to an alternative court (ACE).192 Both the ACE and community release both result in the child being released to the parents. In recent years, there has been an increased effort to release children back to their parents, which has come with some controversy.
188 Flack, Eric. 2023. U.S. attorney for DC: gun prosecution laws fall short, put gun offenders back on the street. WUSA9. Retrieved on December 18, 2023 from https://www.wusa9.com/article/news/local/dc/matthew-graves-us-attorney-crime-guns-dc-gunviolence-illegal-guns-dc-superior-court/65-263aefd3-733c-4bff-8079-cbd056bacaca
189 Council for Court Excellence. 2009. To the DC juvenile justice system. State Justice Institute. Retrieved on November 30, 2023 from https://www.courtexcellence.org/uploads/publications/DCJuvenileJusticeGuideEnglish_Final.pdf
190 Council for Court Excellence. 2009. To the DC juvenile justice system. State Justice Institute. Retrieved on November 30, 2023 from https://www.courtexcellence.org/uploads/publications/DCJuvenileJusticeGuideEnglish_Final.pdf
191 Metropolitan Police Department. 2023. Youth investigations branch. Retrieved on November 30, 2023 from https://cjcc.dc.gov/page/dc-criminal-and-juvenile-justice-systems-glance
192 Metropolitan Police Department. 2023. Youth investigations branch. Retrieved on November 30, 2023 from https://cjcc.dc.gov/page/dc-criminal-and-juvenile-justice-systems-glance
If the juvenile’s case is deemed severe, they will remain in the court system. This process begins with the local agency (MPD) transferring a child to a federal agency, and then having the federal agency transfer the child back to a local agency. The process first begins when MPD performs a CSS Intake Referral. MPD is directly responsible for the transfer of custody to the United States Marshall Service (USMS). From the transfer of custody, the child undergoes the CSS Screening and is assessed based on their criminal history and mental health screening. If their emotional or mental health stability believed to be at risk, the child is referred to the Office of the Attorney General.193 If the child is deemed dangerous, they will be detained for a court hearing. If the child is deemed not a threat to the community at large, they will be released back into the community. All CSS screenings result in an OAG referral.
When a juvenile has been detained, they remain in the court system and experience an Overnight Detention Referral Determination at YSC. This process also takes place if the parent does not respond to the initial inquiry by MPD and OAG. Once the child has stayed overnight at YSC, they are then transferred to the Department of Youth Rehabilitation Services (DYRS) (DYRS is a local agency). From this point, the juvenile is given an arraignment and sent to court. The court processing is entirely overseen by the federal government. During the trial process, the child can be released to the parents, placed in a non-secure shelter home placement, or secured at YSC. If the child is found guilty of the crime, they are sent to Family Court Disposition Hearing and are placed at a detainment center.194
Juvenile processing is complicated and involves many different agencies, both federal and statewide. This results in multiple physical transfers of juveniles between agencies, which may feel
193 Metropolitan Police Department. 2023. Youth investigations branch. Retrieved on November 30, 2023 from https://cjcc.dc.gov/page/dc-criminal-and-juvenile-justice-systems-glance
194 Metropolitan Police Department. 2023. Youth investigations branch. Retrieved on November 30, 2023 from https://cjcc.dc.gov/page/dc-criminal-and-juvenile-justice-systems-glance
jarring for young detainees. Moreover, information may be lost in the transfer of the juvenile between agencies.
Because of the bifurcated system, MPD has struggled to keep track of current data, especially amongst juveniles.195 If departments are sharing data, then how the data is collected must be identical across departments. The collection of data is important as that data collected can be used by governments, news agencies and advocacy groups. MPD historically has struggled to keep their data accurate. Both car crash and stop-and-frisk data have been found to be incomplete.196 There are also inconsistencies in the collection of juvenile data. In the publicly available dataset on juvenile criminal activity within the city, data is mislabeled or unclear. For example, there is an offense simply named “While Armed” with three offenses in 2023. No further clarification of what crime was committed is offered. Minor missteps in the data collection process can have major implications in the processing and perception of juvenile crime in the District. The inaccuracies collecting data reflect the ongoing systemic challenges that MPD faces when arresting, charging, and prosecuting juveniles.
The bifurcated system of D.C.’s juvenile detention system has drawbacks beyond data collection and management. With the increase in juvenile crime since the pandemic, more attention has been placed on the juvenile justice system.
Involvement in the juvenile justice system has been proven not to rehabilitate juveniles involved in criminal activity, but further exacerbate anti-social behaviors. In a national study, researchers found that incarcerated juveniles are 39% less likely to complete high school and are 41% more likely to be incarcerated as an adult, by the time of age 25.197 These results are echoed by the District government’s independent agency, the Criminal Justice Coordinating Council (CCJC).198
Despite the evidence, there has been growing calls to “crack-down” on youth who have been arrested for violent and non-violent criminal activity.
195 Youth Justice. 2019. D.C.’s juvenile systems: an overview. Public Welfare Foundation. Retrieved on November 30, 2023 from https://www.publicwelfare.org/wp-content/uploads/2019/10/PWF_DCs-Justice-Systems-Overview.pdf
196 Cirruzzo, Chelsea, 2021. MPD crash data is incomplete, study finds. Axios. Retrieved on November 30, 2023 from https://www.axios.com/local/washington-dc/2021/10/06/dc-mpd-crash-pedestrian-safety
197 Aizer & Doyle. 2013. Juvenile incarceration, human capital and future crime: evidence from randomly assigned judges National Bureau of Economic Research. Retrieved on December 4, 2023 from https://www.nber.org/system/files/working_papers/w19102/w19102.pdf
198 Partin, Erin. 2022. A study of factors that affect the likelihood of juvenile justice system involvement
Ward 2 councilmember, chair of the council’s Committee on the Judiciary and Public Safety, has called for more accountability amongst juveniles.199 This comment comes in direct contrast to the Office of the Attorney General, which has made a conscious effort to reduce the number of juveniles who are entered into the system. Increase calls for juvenile accountability coincide with juvenile justice reform, specifically concerning juvenile detainment.
In November 2023, a juvenile was killed while driving a carjacked vehicle. Before their death, the juvenile was recently arrested for a previous carjacking crime and was released to home confinement. The judge cited the lack of space at the Youth Services Center (YSC) for arrested juveniles which influenced their decision.200 YSC is ran by the Department of Youth Rehabilitation Services (DYRS).
YSC acts as a pretrial detention center, where arrested juveniles await their trial. The space YSC offers is very limited, with room for only 88 juveniles. DYRS has also seen staffing shortages since the beginning of 2023. Moreover, with the increased public pressure to hold juveniles accountable for their crimes, YSC has surpassed its capacity in 2023 (though by an estimated 35 juveniles).201 The combination of the crowded detention center and staff shortages has left YSC in disarray.
As a result of the overcrowding and understaffing, violence has been increasing amongst juveniles staying at YSC. The most recent report by MPD (October 2023) indicates that there have been 32 incidents between juveniles in YSC.202 In addition, there have been 35 “critical incidents during this period.203 MPD also reports data on staff-on-youth assaults, which occur infrequently.
199 Flores, Christian. 2023. ‘You need to be held accountable’: D.C. councilmember discusses juvenile justice. ABC7news. Retrieved on December 4, 2023 from https://wjla.com/news/local/-juvenile-justice-shootings-gun-violence-baby-k-kaden-holland-you-needto-be-held-accountable-dc-councilmember-brooke-pinto-discusses-murder-first-degree-sexual-abuse-burglary
200 Segraves, Mark. 2023. Teen carjackings raise concerns about space to detain juvenile offenders in D.C. Washington News4. Retrieved on December 4, 2023 from https://www.nbcwashington.com/news/local/teen-carjackings-raise-concerns-about-spaceto-detain-juvenile-offenders-in-dc/3460783/
201 Gathright & Grablick. 2023. ‘Why is my child always on lockdown?”: confinement at D.C.’s youth jail worries parents, advocates. WAMU. Retrieved on December 4, 2023 from https://wamu.org/story/23/07/24/confinement-at-dc-youth-jail-hasparents-worried/
202 Metropolitan Police Department. 2023. YSC incident rates. Retrieved on December 12, 2023 from https://oijjfo.dc.gov/sites/default/files/dc/sites/oijjfo/publication/attachments/YSC%20Incident%20Rates.pdf
203 Metropolitan Police Department. 2023. YSC incident rates. Retrieved on December 12, 2023 from https://oijjfo.dc.gov/sites/default/files/dc/sites/oijjfo/publication/attachments/YSC%20Incident%20Rates.pdf
Several anecdotal accounts of the conditions within YSC have caused concerns for activists, leading to criticism of YSC. A mother, who had her son detained in YSC claimed that the facility was treating children like “dogs.” The mother claims that “they had him in a cell locked in a cell with no sheets, no water for two days.”204 At one point, a thirteen-year-old girl was illegally detained for 15 days as there were not enough beds in alternative shelters.205
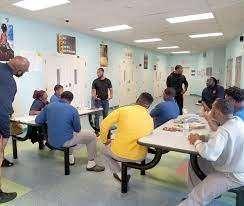
Overcrowding has been the main culprit of much of the violence occurring at YSC. In November of 2023, five officers were harmed in a massive brawl that took place in YSC. In a speech after the brawl, council member Trayon White said, “there are a lot of frustrated youth in here and as a result, they’re acting out in various ways.”206 White, who has oversight of YSC, has decided to not remove the independent body that oversees the facility. This oversight is set to expire come September 2024.
One of the most drastic actions taken by the District government has been the reinforcement of the youth curfew. While being mandated by law for several years, the curfew was scarcely enforced by police. With the increase in juvenile violence, the current administration has decided to begin enforcing the curfew at 11 p.m. in selected areas of the city. The curfew enforcement began September 1st, 2023. The selected areas of enforcement include LeDroit Park, Columbia Heights and U Street, amongst others. These are areas of the city that have seen juvenile “gangs” approach, harass, and commit violence against the population. The largest story stemmed from an estimated forty youth entering the Howard campus, brawling with students, and stabbing an individual.
204 Hamburg, Daniel. 2023. Violence increasing at DC youth services center. DC NEWS NOW. Retrieved on December 12, 2023 from https://www.dcnewsnow.com/news/local-news/washington-dc/violence-increasing-at-dc-youth-services-center/
205 Segraves, Mark. 2023. Lawyers claim DC housing for arrested juveniles violates their rights. NBC Washington. Retrieved on December 12, 2023 from https://www.nbcwashington.com/news/local/lawyers-claim-dc-housing-for-arrested-juveniles-violatestheir-rights/3464364/
206 Lynn, Kellye. 2023. DC councilmember raises alarm over conditions at Youth Services Center, citing violence & lack of supplies. ABC7 News. Retrieved on December 15, 2023 from https://wjla.com/news/local/dc-youth-services-center-detentioncouncilmember-trayon-white-criticism-district-fights-assault-supplies-education-children-teens-program-support-staffingshortage-sam-abed-acting-director-confirmation
Juvenile advocates and public safety experts doubt the effectiveness of the reinforced curfew. Actual of enforcement of the curfew has proven difficult. There are several ways for juveniles to avoid the curfew. For example, if a juvenile is caught out past 11 p.m. in their car, they will be let go if they are simply returning home. The likelihood of juveniles telling the truth if caught, with such an easy alibi, is very low. In fact, a council member does not support the enforcement. Furthermore, the Metropolitan Police Department (MPD) has struggled with staffing since the George Floyd Protests in 2020. Since these protests, MPD has encountered staffing troubles that may hinder the number of juveniles caught breaking the curfew laws. If a juvenile is caught, they will be brough to DYRS where they will relate to their family members. If no family member shows to receive the child, with they be put through rehabilitative services.
Past research also indicates that the enforcement of the juvenile curfew may not be as successful as the current administration hopes. Research stems from the 1995 enforcement of the juvenile curfew, when crime in the District was also at a peak. Using juvenile arrest data from 1993 to 2001, researchers concluded that juvenile curfews have no impact on reducing overall juvenile arrests.207
Following the reinstitution of the juvenile curfew in some parts of the District, in November 2023, the current administration announced a state of emergency surrounding youth violence. Specifically, the current administration is attempting to bring more juveniles into the custody of DYRS and YSC.208 Moreover, the order to allow judges to detain juveniles long before their trial. The emergency order would allow DYRS to purchase additional beds for shelter homes.209
Research indicates that juvenile criminal activity is a response to environmental conditions, rather than an individual’s capacity to commit violent acts. It is also important to address that childhood criminal activity often tapers at the age of 17. Thus, violent acts during childhood does not correspond to violent acts in adulthood.210 If a child is charged and arrested for a crime, there is a presumption that the child will be detained as they are likely to be a repeat offender.
207 Cole, Danny. 2003. Effect of a curfew law on juvenile crime in Washington, D.C. American Journal of Criminal Justice. Retrieved on December 18, 2023 from https://www.ojp.gov/ncjrs/virtual-library/abstracts/effect-curfew-law-juvenile-crimewashington-dc
208 Grablick, Colleen. 2023. Mayor Bowser declares public emergencies over youth violence, opioids. DCist. Retrieved on December 18, 2023 from https://dcist.com/story/23/11/13/mayor-bowser-public-emergency-youth-violence-opiods/
209 Grablick, Colleen. 2023. Mayor Bowser declares public emergencies over youth violence, opioids. DCist. Retrieved on December 18, 2023 from https://dcist.com/story/23/11/13/mayor-bowser-public-emergency-youth-violence-opiods/
210 Sparta, Steven & Koocher, Gerald. 2006. The forensic mental health assessment of children and adolescents. Oxford University. Retrieved on December 18, 2023 from https://www.ojp.gov/ncjrs/virtual-library/abstracts/effect-curfew-law-juvenile-crimewashington-dc
This is not the case. For example, when comparing juveniles who have been arrested for homicide and juveniles arrested for larceny, juveniles who were arrested for homicide were less likely to have prior offenses and less likely to have a known history of prior violent behavior.211 This research explains the increase in violent offenses by juveniles in the District without prior charges. Violent offenses committed by juveniles are likely to stem from environmental conditions, which in turn impact childhood cognitive development. Moreover, developmental capacities are unique to each child, which is especially true for children growing up in poverty. Development also is not a linear trend. A child may develop anti-social behaviors quickly or develop anti-social behaviors over an extended period. 212 Because of these developmental differences, youth can develop different forms of anti-social behavior, from drug abuse to criminal activity. For juveniles charged with violent offenses, it is more likely than not that they were exhibiting “reaction behavior,” behavior researchers see in children who have not fully emotionally developed. Reaction behaviors typically misperceive hostile or aggressive social cues from others.
For juveniles that have been arrested for homicide, early on-set offenders typically live in homes with a history of mental illness and have elevated levels of anger and aggression.213 For juveniles who have a history of prior arrests and/or repeat offenders, factors of incarceration primarily stem from home life. Parental history of criminal activity and family violence were the main factors in predicting if a child were to be arrested multiple times before adulthood.214 Specifically in low-income Black communities, associations between youths and parent relationships, parent bonding, and school climate have statistically significant impact on predicting youth violence and mental health outcomes.215 Research has indicated that parental physical and emotional abuse and juvenile violence are interlinked. For youth involved in the justice system, nearly 50% reported neglect and 20% reported physical abuse. Nearly 12% of youth were removed from
211 Sparta, Steven & Koocher, Gerald. 2006. The forensic mental health assessment of children and adolescents. Oxford University. Retrieved on December 18, 2023 from https://www.ojp.gov/ncjrs/virtual-library/abstracts/effect-curfew-law-juvenile-crimewashington-dc
212 Sparta, Steven & Koocher, Gerald. 2006. The forensic mental health assessment of children and adolescents. Oxford University. Retrieved on December 18, 2023 from https://www.ojp.gov/ncjrs/virtual-library/abstracts/effect-curfew-law-juvenile-crimewashington-dc
213 Baglivio, Michael & Wolff, Kevin. 2017. Prospective prediction of juvenile homicide/attempted homicide among early-onset offenders. International Journal of Environmental Research and Public Health. Retrieved on December 18, 2023 from file:///C:/Users/czielinski/Downloads/ijerph-14-00197.pdf
214 Lattimore, P, et al. 1995. Predicting rearrest for violence among serious youthful offenders. National Institute of Justice. Retrieved on December 18, 2023 from https://nij.ojp.gov/library/publications/predicting-rearrest-violence-among-seriousyouthful-offenders
215 Boyd, Donte, et al. 2022. The mental health of Black youth affeceted by community violence: family and school context as pathways to resilience. Children. Retrieved on December 18, 2023 from https://www.ncbi.nlm.nih.gov/pmc/articles/PMC8870431/pdf/children-09-00259.pdf
their home, on average by age 7.216 Adverse childhood experiences (ACEs) often result in juvenile criminal activity later in life.
All the predictors of juvenile violence stated above are directly related to poverty. The impacts of childhood poverty and growing up in a violent, low-income community cannot be understated. The consequences of childhood poverty are vast and explain the increase in juvenile violence within the District:
“Wefindoverwhelmingevidencefromthisliteraturethat,onaverage,achild growingupinafamilywhoseincomeisbelowthepovertylineexperiencesworse outcomesthanachildfromawealthierfamilyinvirtuallyeverydimension,from physicalandmentalhealthtoeducationalattainmentandlabormarketsuccess,to riskybehaviorsanddelinquency.”217
Poverty directly impacts the physical environment for juveniles, specifically inadequate shelter, and medical care, as well as food insecurity.218 Poverty also directly affects the parents’ ability to provide a quality homelife for their child. The psychological distress from poverty has been linked to harsh, inconsistent, and detached parenting, which may impair a child’s socioemotional development.219 Statistical models conclude that if a parent is of low-income, the child is more likely to engage in violent offenses as a teenager or young adult.220 However, risks can be mitigated if the child has a “positive” homelife.
For youth involved in D.C. justice system, poverty has a significant impact on criminal activity, according to the CJCC. For example, nearly 88% of arrested juveniles went without Medicare for over a year and an estimated 32% were on TANF.221
216 Sill, Kaitlyn. 2020. A study of the root causes of juvenile justice system involvement. Criminal Justice coordinating Council. Retrieved on January 3, 2024 from https://cjcc.dc.gov/sites/default/files/dc/sites/cjcc/CJCC%20Root%20Cause%20Analysis%20Report_Compressed.pdf
217 National Library of Medicine. 2023. A roadmap to reducing child poverty. National Center for Biotechnology Information. Retrieved on December 18, 2023 from https://www.ncbi.nlm.nih.gov/books/NBK547371/
218 National Library of Medicine. 2023. A roadmap to reducing child poverty. National Center for Biotechnology Information. Retrieved on December 18, 2023 from https://www.ncbi.nlm.nih.gov/books/NBK547371/
219 National Library of Medicine. 2023. A roadmap to reducing child poverty. National Center for Biotechnology Information. Retrieved on December 18, 2023 from https://www.ncbi.nlm.nih.gov/books/NBK547371/
220 Sariaslan, Amir, et al. 2014. Childhood family income, adolescent violent criminality and substance misuse: quasi-experimental total population study. PubMed Central. Retrieved on December 18, 2023 from https://www.ncbi.nlm.nih.gov/pmc/articles/PMC4180846/#:~:text=Using%20traditional%20epidemiological%20methods%2C%2 0we,and%20substance%20misuse%20during%20adolescence.
221 Sill, Kaitlyn. 2020. A study of the root causes of juvenile justice system involvement. Criminal Justice coordinating Council. Retrieved on January 3, 2024 from https://cjcc.dc.gov/sites/default/files/dc/sites/cjcc/CJCC%20Root%20Cause%20Analysis%20Report_Compressed.pdf
This research is especially pertinent in the District of Columbia, where low-income neighborhoods facing persistent poverty are concentrated in areas that have seen historical disinvestment and are currently underserved. Juvenile criminal activity is concentrated in Wards 7 and 8, where 56% of the arrests, as of writing, have taken place in 2023. Both wards have high rates of poverty and unemployment, which as shown, has a negative impact on childhood development. Of the preventable factors that lead juveniles to commit crime, poverty should be considered one of the highest, if not most important factor to eliminate.
Introduction
Many major metropolitan areas, D.C. included, are experiencing a housing supply shortage and inefficiencies providing affordable housing to residents of low-income. The gap between supply and demand is especially stark in D.C. In 2023, the D.C. metro area was missing an estimated 134,000 homes for sale and for rent.222 While a shortage of sales may be linked to rising interest rates and a slowing housing market, the demand for housing units in the District is still quite high.223 Beyond the existing housing market, in 2019 the Metropolitan Washington Council of Governments estimated that 32,000 new homes had to be built in the Washington D.C., region by 2030 in response to the growing population.224 There is an acute need for housing within the District of Columbia.
In addition to the housing supply shortage, the District struggles with connecting low-income residents to affordable housing units. For low-income residents, DC has only 33 affordable and available rental homes for every 100 renters.225 The property values in the city increase year over year and wages remain stagnant for many low-income families-often families of color-, housing, even affordable units, are out of reach for many, leading to high levels of displacement.226 Many low-income residents cannot wait for the completed construction of new affordable units. For
222 Sparber, Sami. 2023. D.C. is short 134,000 homes for sale. Axios. Retrieved on October 5, 2023 from https://www.axios.com/local/washington-dc/2023/07/01/washington-dc-rent-housing-inventory
223 Hopkins, Paige. 2023. D.C.’s housing market comes back to Earth in 2023. Axios. Retrieved on October 5, 2023 from https://www.axios.com/local/washington-dc/2023/01/03/dc-2023-housing-market
224 Hopkins, Paige. 2023. D.C.’s housing market comes back to Earth in 2023. Axios. Retrieved on October 5, 2023 from https://www.axios.com/local/washington-dc/2023/01/03/dc-2023-housing-market
225 Burton, et al. 2024. Combating rising evictions in the District of Columbia with housing subsidies. The Urban Institute. Retrieved on September 18, 2024 from https://www.urban.org/sites/default/files/202406/Combating_Rising_Evictions_with_Housing_Subsidies_0.pdf
226 Golding, Eliana. 2023. A holistic and reparative agenda for ending displacement in DC. DC Fiscal Policy Institute. Retrieved on August 28, 2024 from https://www.dcfpi.org/all/agenda-for-ending-displacement/
individuals making less than 50% of their neighborhood AMI, 79% are rent burdened.227 But where the predominant government housing provider, the DC Housing Authority has an occupancy rate of 75% (the lowest in the country for large metropolitan areas) and holds some of the most rapidly deteriorating housing stock in the country.228
This section will detail the ongoing housing crisis within the District and the measures being taken to solve said crisis, specifically, measures taken by government entities. Current market trends indicate that the current real estate market is not building enough housing units naturally and thus requires government intervention. There are many kinds of government led projects that could be beneficial to increasing the current housing stock in D.C, while also connecting low-income residents with affordable units. The District has a large toolkit at its disposal to spur construction of affordable housing units, and for the most part, has kept its promise of delivering 36,000 homes by 2025 (recently completed in 2024). However, existing rules, regulations and public pushback may limit growth of housing units where they are needed most. While it is necessary to build more housing units across D.C. in its entirety, where affordable housing units are located is salient to creating inclusive and diverse communities. Therefore, government entities should carefully consider where new housing projects are being built and what tools they should use to spur development, in addition to securing affordable units for low-income residents who are at risk of displacement.
Historically, affordable housing units and public housing units have been built in ways that contributed to racial segregation. Segregation was further reinforced by racist zoning regulations. The District of Columbia has an extensive history of inhibiting the economic mobility of Black and Brown residents through racist zoning, housing and urban renewal projects. By limiting where housing units can and can’t be built, past developers have set the stage for the current housing crisis. This report finds that much of the affordable and public housing stock is still being built in predominately poorer areas, continuing the trend of economic segregation by affordable housing. Moreover, much of the public housing stock that is meant to serve low-income residents is in dire disrepair. Movements that have aimed at building economically inclusive neighborhoods in historically wealthy areas of the District have been met with pushback from residents. Above all, the lack of affordable housing developments, and preservation, disproportionally harm low-income Black and Brown communities. Many
227 Burton, et al. 2024. Combating rising evictions in the District of Columbia with housing subsidies. The Urban Institute. Retrieved on September 18, 2024 from https://www.urban.org/sites/default/files/202406/Combating_Rising_Evictions_with_Housing_Subsidies_0.pdf
228 Golding, Eliana. 2023. A holistic and reparative agenda for ending displacement in DC. DC Fiscal Policy Institute. Retrieved on August 28, 2024 from https://www.dcfpi.org/all/agenda-for-ending-displacement/
gentrified or gentrifying communities have seen a mass exodus of Black and Brown residents towards cheaper areas beyond the District. Therefore, the city should invest in solutions that directly prevent displacement and limit the cost of rent for low-income individuals.
When individuals and families cannot afford housing, the implications can be dire. Access to decent housing provides a reprieve for families and communities looking for stability. Therefore, it should be with the upmost importance that the District resolves the ongoing housing crisis by systematically assessing and reinvesting in neighborhoods that have been subject to systemic regulations designed to limit their economic mobility, in addition to preserving and maintaining the existing affordable housing stock.
There are an estimated 360,000 housing units in the District.229 Of the current estimated housing stock, approximately 326,970 housing units are occupied, for an occupancy rate of 90%.230 Homeownership is relatively low, with an estimated 134,120 housing units occupied by their owners.231 Renting is still the preferred method of occupancy. An estimated 192,850 households (or 58%) rent their housing unit.232 Moreover, 49.3% of DC households live in an apartment building with ten or more units.233 Low-income individuals and households are disproportionately likely to be renters, rather than homeowners. Of renter-occupied housing units, 25% of households make under $35,000 each year.234 Just 9.6% of homeowners make less than $35,000 each year.235 Residents with low-incomes therefore, are more reliant on rent relief measures such as public housing or ERAP. Census data indicates that 44,000 households in the District were “severely cost burdened” or spent more than half their income on rent.236 That is a 22% increase from 2010. The proportion of severely cost burdened households has increased dramatically, despite efforts by the city government to increase the existing affordable housing stock.
Moreover, as many low-income households struggle to attain economic security, the District should provide support to severely rent-burdened individuals. Steps to alleviate the cost of rent
229 U.S. Census Bureau. 2023. American community survey 1-year estimates. Table DP04.
230 U.S. Census Bureau. 2023. American community survey 1-year estimates. Table S2503.
231 U.S. Census Bureau. 2023. American community survey 1-year estimates. Table S2503.
232 U.S. Census Bureau. 2023. American community survey 1-year estimates. Table S2503.
233 U.S. Census Bureau. 2023. American community survey 1-year estimates. Table S2504.
234 U.S. Census Bureau. 2023. American community survey 1-year estimates. Table S2503.
235 U.S. Census Bureau. 2023. American community survey 1-year estimates. Table S2503.
236 Baskin, Morgan. 2023. Growing share of D.C. renters spend at least half of their income on rent. DCist. Retrieved on September 25, 2023 from https://dcist.com/story/23/09/19/dc-residents-income-rent/
include strengthening rent control, promoting tenants’ rights and preserving existing affordable housing.
While most District residents reside in apartment building units, there are also condominiums, cooperatives, flats, and single-family homes, all of which potentially could be part of the affordable housing stock.237 Moreover, it is difficult to quantify rent ranges as there is no publicly available data on private transactions between private sellers and buyers. The best public data is Costar, which only estimates 64% of available transactions across the District. However, estimates do exist, though the ranges are quite broad. Only 1% of rental housing units cost between $700-$1000.238 In comparison, 64% of rentals are estimated to cost over $2000 a month.239 An estimated 11% of units cost $1,001-$1,500 a month and 25% cost $1,501-$2,000 a month.240 These estimates do not account for the sizeable shadow rental market in the District, though this report will touch on the subject in a later section.
Affordable rent, or fair rent, is described as 30% or less of a family’s take home income. As mentioned in previous sections, many families across the District are “severely cost burdened” or dedicate over 50% of their income towards rent. The poorest ward, Ward 8, has a median household income of 47,000.241 Accounting for an affordable rent, or 30% of income, a household with median income living in Ward 8 would need to pay no more than $1,185 per month towards rent. The American Community Survey collects information on the monthly
237 Taylor, Yesim. 2020. Appraising the District’s rentals. D.C. Policy Center. Retrieved on September 27, 2023 from https://dcpolicycenter.wpenginepowered.com/wp-content/uploads/2020/03/Rental-Housing-Report.Final_.March-15.pdf 238 RentCafe. 2023. Washington, DC rental market trends. Retrieved on October 5, 2023 from https://www.rentcafe.com/averagerent-market-trends/us/dc/washington/ 239 RentCafe. 2023. Washington, DC rental market trends. Retrieved on October 5, 2023 from https://www.rentcafe.com/averagerent-market-trends/us/dc/washington/ 240 RentCafe. 2023. Washington, DC rental market trends. Retrieved on October 5, 2023 from https://www.rentcafe.com/averagerent-market-trends/us/dc/washington/ 241 DC Health Matters. 2023. Median household income. Retrieved on October 5, 2023 from https://www.dchealthmatters.org/demographicdata/index/view?id=2419&localeId=131495
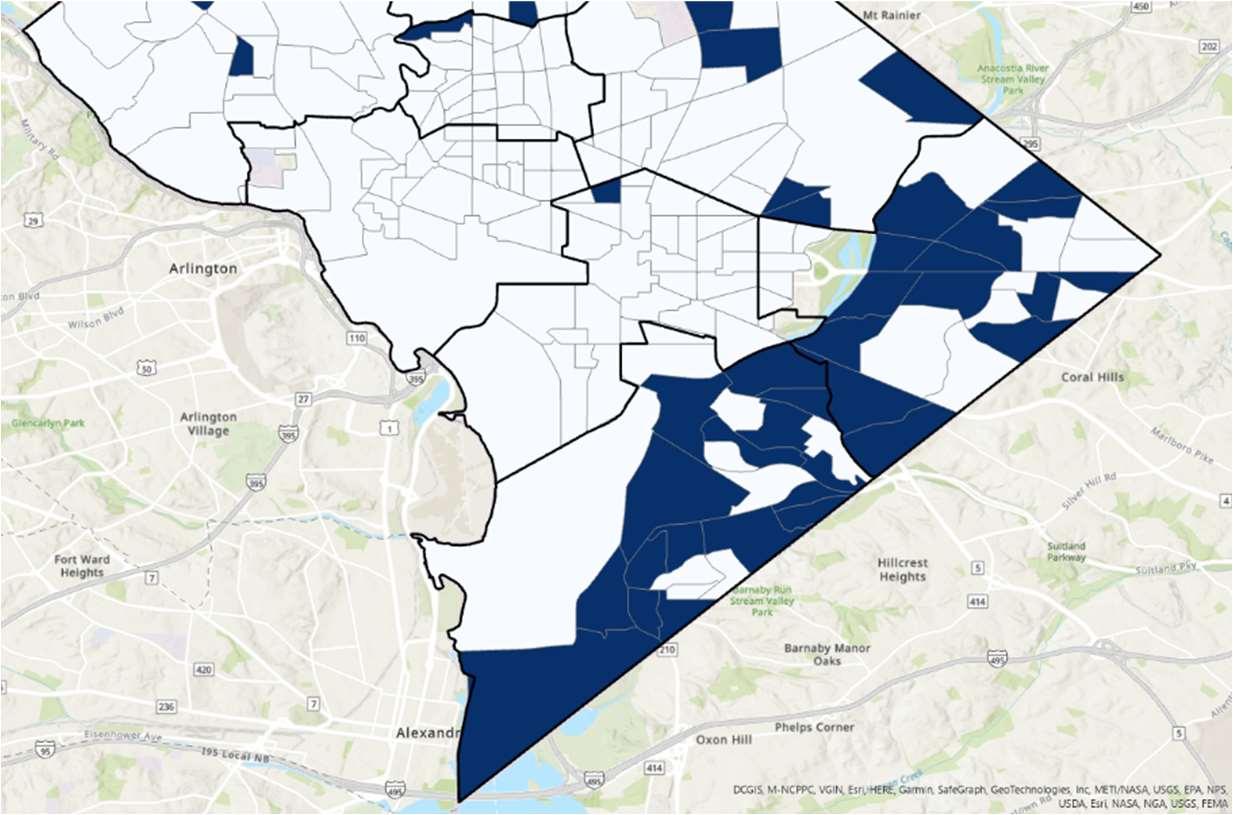
Figure 6: Where 50% or more of the population pays more than [??] fair rent price based on income
housing costs of renters across the District. Figure 9 details the number of communities in D.C. where the majority of renters pay $1,000 to $1,500 in housing costs per month.242 In the highlighted areas of Figure 10, 50% or more of the population pays more than the affordable rent price (or the fair rent price of 30% of take-home pay) for their annual household incomes. Meanwhile, in other wards across the District, there are very few neighborhoods where a majority of individuals are paying $1,000 to $1,500 in housing costs each month –instead, they tend to pay much more. The small and shrinking supply of low-cost housing is a reminder that residents with low incomes have few places to look in DC when they need to find affordable housing, fueling the ongoing displacement of residents, especially Black residents. Moreover, the fact that housing stock that is affordable to individuals making an estimated $45,000 to $50,000 a year is primarily located in Wards 7 and 8 -- and a notable share of that is subsidized housing -contributes to segregating communities by income. The wealthier areas of the city are essentially cut off from low-income communities in the District.
Renters saw unprecedented gains in rental assurance and eviction protection during the height of the pandemic. Though as the pandemic recedes, so too do the protections granted to tenants. Now, an unprecedented number of individuals are potentially facing eviction in the District.
During the pandemic, the District set an eviction moratorium, meaning tenants could not be evicted for non-payment of rent. The District government was able to support tenants and landlords through the moratorium with the STAY DC program, a $352 million program meant to aid low- and moderate-income residents who could not afford to pay rent amid the
pandemic.243 To qualify for the program, a tenant had to be making less than 80% of the area median income, or less than $57,650 for a family of four.244 In 2024, 14% of renter households reported being behind on rent.245 As expected, there were very few evictions, if any, during the pandemic. The eviction moratorium concluded in 2021.
At the start of 2022, nearly 35,000 D.C. households indicated they were behind on rent.246 Moreover, before the pandemic, the District had one of the highest eviction rates in the country as well as the lowest fee for a landlord to file an eviction notice.247 Increasing rent costs and decreasing emergency rental aid may prove to increase the number of eviction filings even further. Current data on eviction filings have been scant since 2018. While the D.C. Superior Courts do release the number of cases brought to court by landlords and tenants, they might not always be related to eviction filings. However, the Landlord and Tenant courts have been much more active since the end of the eviction moratorium. In 2022, the Landlord and Tenant courts saw a 1336% increase in new case filings, compared to 2021.248 While the increase in new case filings is quite staggering, the total remains around 10,000, a far cry from the 30,000 case filings the court of Landlord and Tenants would see each year.249 To reiterate, this does not mean all case filings are eviction notices.
However, in 2024, the Urban Institute released data estimating that in 2024, there will be 1,500 evictions, one of the eviction rates in the last ten years. The same study concludes that the District should allocate $108 million for the Emergency Rental Assistance Program.250
There is a limited time frame, from June 2023 to October 2023 when eviction scheduling data has been made available. Eviction scheduling is different than eviction filing. Nearly one third of
243 Yarborough & Jones. 2023. ‘Bigger than me’: landlords complain about missing rent payments from DC COVID-era program NBC Washington. Retrieved on October 10, 2023 from https://www.nbcwashington.com/investigations/bigger-than-me-landlordscomplain-about-missing-rent-payments-from-dc-covid-era-program/3297569/
244 STAY DC. 2023. Rent and utility assistance. Retrieved on October 10, 2023 from https://stay.dc.gov/
245 Burton, et al. 2024. Combating rising evictions in the District of Columbia with housing subsidies. The Urban Institute. Retrieved on September 18, 2024 from https://www.urban.org/sites/default/files/202406/Combating_Rising_Evictions_with_Housing_Subsidies_0.pdf
246 Selby, Julia. 2022. Ending DC’s eviction moratorium: the effects on low-income residents and the spread of COVID-19. Cornell Policy Review. Retrieved on October 10, 2023 from http://www.cornellpolicyreview.com/ending-dcs-evictionmoratorium/?pdf=6153
247 Selby, Julia. 2022. Ending DC’s eviction moratorium: the effects on low-income residents and the spread of COVID-19. Cornell Policy Review. Retrieved on October 10, 2023 from http://www.cornellpolicyreview.com/ending-dcs-evictionmoratorium/?pdf=6153
248 District of Columbia Courts. 2022. Statistical summary. Retrieved on October 10, 2023 from file:///C:/Users/czielinski/Downloads/CY2022_Statistical_Summary_FINAL.pdf
249 District of Columbia Courts. 2022. Statistical summary. Retrieved on October 10, 2023 from file:///C:/Users/czielinski/Downloads/CY2022_Statistical_Summary_FINAL.pdf
250 Burton, et al. 2024. Combating rising evictions in the District of Columbia with housing subsidies. The Urban Institute. Retrieved on September 18, 2024 from https://www.urban.org/sites/default/files/202406/Combating_Rising_Evictions_with_Housing_Subsidies_0.pdf
eviction filings were rejected by the District courts in 2022.251 When judges do accept an eviction filing, it has to go through a several day process before the eviction filing is scheduled. Between June 2023 and October 2023, there were 667 publicly available eviction scheduling. Perhaps not surprisingly, many of the eviction scheduling take place in poorer areas of the District. Nearly one half of all scheduled evictions take place East of the Anacostia River.
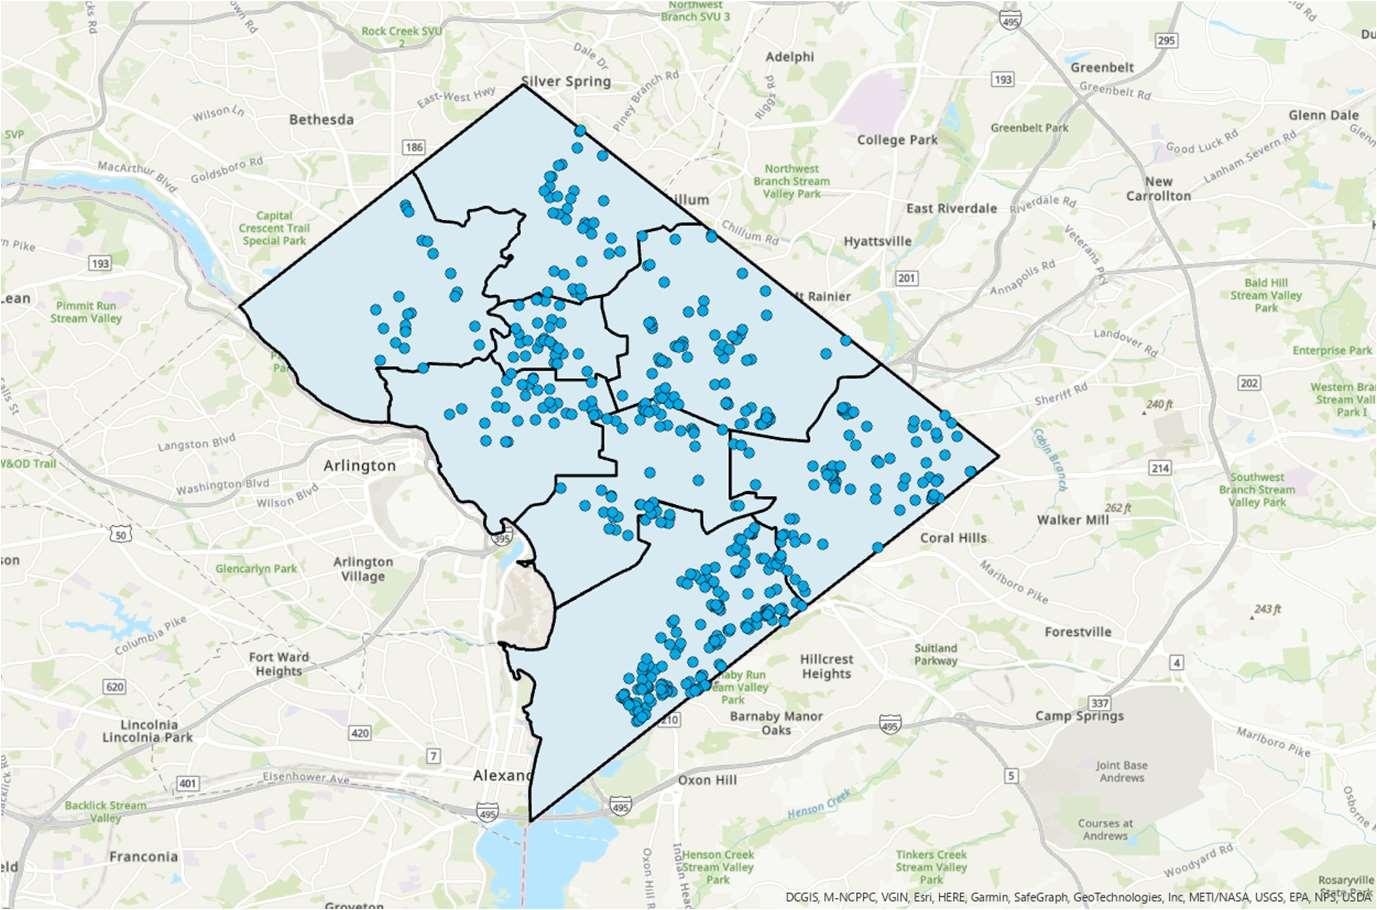
Figure 7: Evictions across the District
The impact of an eviction can be traumatic. Those who have received an eviction notice will be removed from their current residence and more often than not, they are not able to afford another home in a similar area. Evictions often, lead to a greater rate of homelessness and substantially worsen employment outcomes.252
While many renters live in apartment buildings and condominiums, there is a sizeable number of residents who rent undisclosed housing units from private owners. Privately owned yet rented housing units are not recorded in Census or traditional housing surveys. Like apartment buildings, the shadow market for rental housing units primarily serves low to middle-income families.253 Last measured in 2018, the shadow market comprised nearly 80,000 housing units, or nearly 26% of the housing stock in the District.254 The housing stock of the shadow market
251 District of Columbia Courts. 2022. Statistical summary. Retrieved on October 10, 2023 from file:///C:/Users/czielinski/Downloads/CY2022_Statistical_Summary_FINAL.pdf
252 Collinson & Reed. 2018. The effects of evictions on low-income households. NYU. Retrieved on October 10, 2023 from https://www.law.nyu.edu/sites/default/files/upload_documents/evictions_collinson_reed.pdf
253 Sayin, Yesim. 2018. D.C’s shadow rental market. D.C. Policy Center. Retrieved on September 29, 2023 from https://www.dcpolicycenter.org/publications/shadow-rental-market-2018-state-of-business/
254 Sayin, Yesim. 2018. D.C’s shadow rental market. D.C. Policy Center. Retrieved on September 29, 2023 from https://www.dcpolicycenter.org/publications/shadow-rental-market-2018-state-of-business/
does not only consist of condominiums or apartment buildings. There is a sizeable portion of the shadow housing stock that is composed of single-family dwellings, last estimated at 46%.255
Indicative of the name, the District’s rental shadow market is loosely regulated.256 Private owners have the right to rent out their single-family or condominium units, if they are looking in to bring extra cash. Higher interest rates may incentivize this. Though the District’s rental market is notoriously competitive, sales in 2023 remain quite low.257 When the rental market slows, renters (typically) gain leverage as houses remain on the market for longer periods of time. To offset a potential loss of revenue from high interest rates, sellers may rent out their homes for a brief period. This would increase the size of the shadow market housing stock.
In 2019, the current administration announced the goal of increasing the housing stock by 36,000 units, a third of which would be dedicated to lower-income residents, by 2025. Of the 36,000 units planned, all have been completed as of 2024. The expansion of affordable housing stock has primarily taken place in poorer areas of the city. Rock Creek West, an enclave of wealth in the District, has only developed 4.7% of the goal for new affordable housing stock in that geographic area, a mere 83 affordable units.258 Poorer areas, such as Far Southeast and Southwest, have developed 218.2% of the affordable housing stock expected in the mayor’s plan.259 More information can be seen below:
255 Sayin, Yesim. 2018. D.C’s shadow rental market. D.C. Policy Center. Retrieved on September 29, 2023 from https://www.dcpolicycenter.org/publications/shadow-rental-market-2018-state-of-business/
256 Brown-Perry, Nena. 2020. 34,000 units in 20 years: DC’s rental market, by the numbers. Urban Turf. Retrieved on October 2, 2023 from https://dc.urbanturf.com/articles/blog/34000-units-in-20-years-dcs-rental-market-by-the-numbers/16669
257 UrbanTurff Staff. 2023. Will this be the summer of the shadow buyer? UrbanTurf. Retrieved on October 2, 2023 from https://dc.urbanturf.com/articles/blog/will_this_be_the_summer_of_the_shadow_buyer/21133
258 Deputy Mayor for Planning & Economic Development. 2023. 36,000 housing count. DMPED. Retrieved on September 25, 2023 from https://open.dc.gov/36000by2025/
259 Deputy Mayor for Planning & Economic Development. 2023. 36,000 housing count. DMPED. Retrieved on September 25, 2023 from https://open.dc.gov/36000by2025/
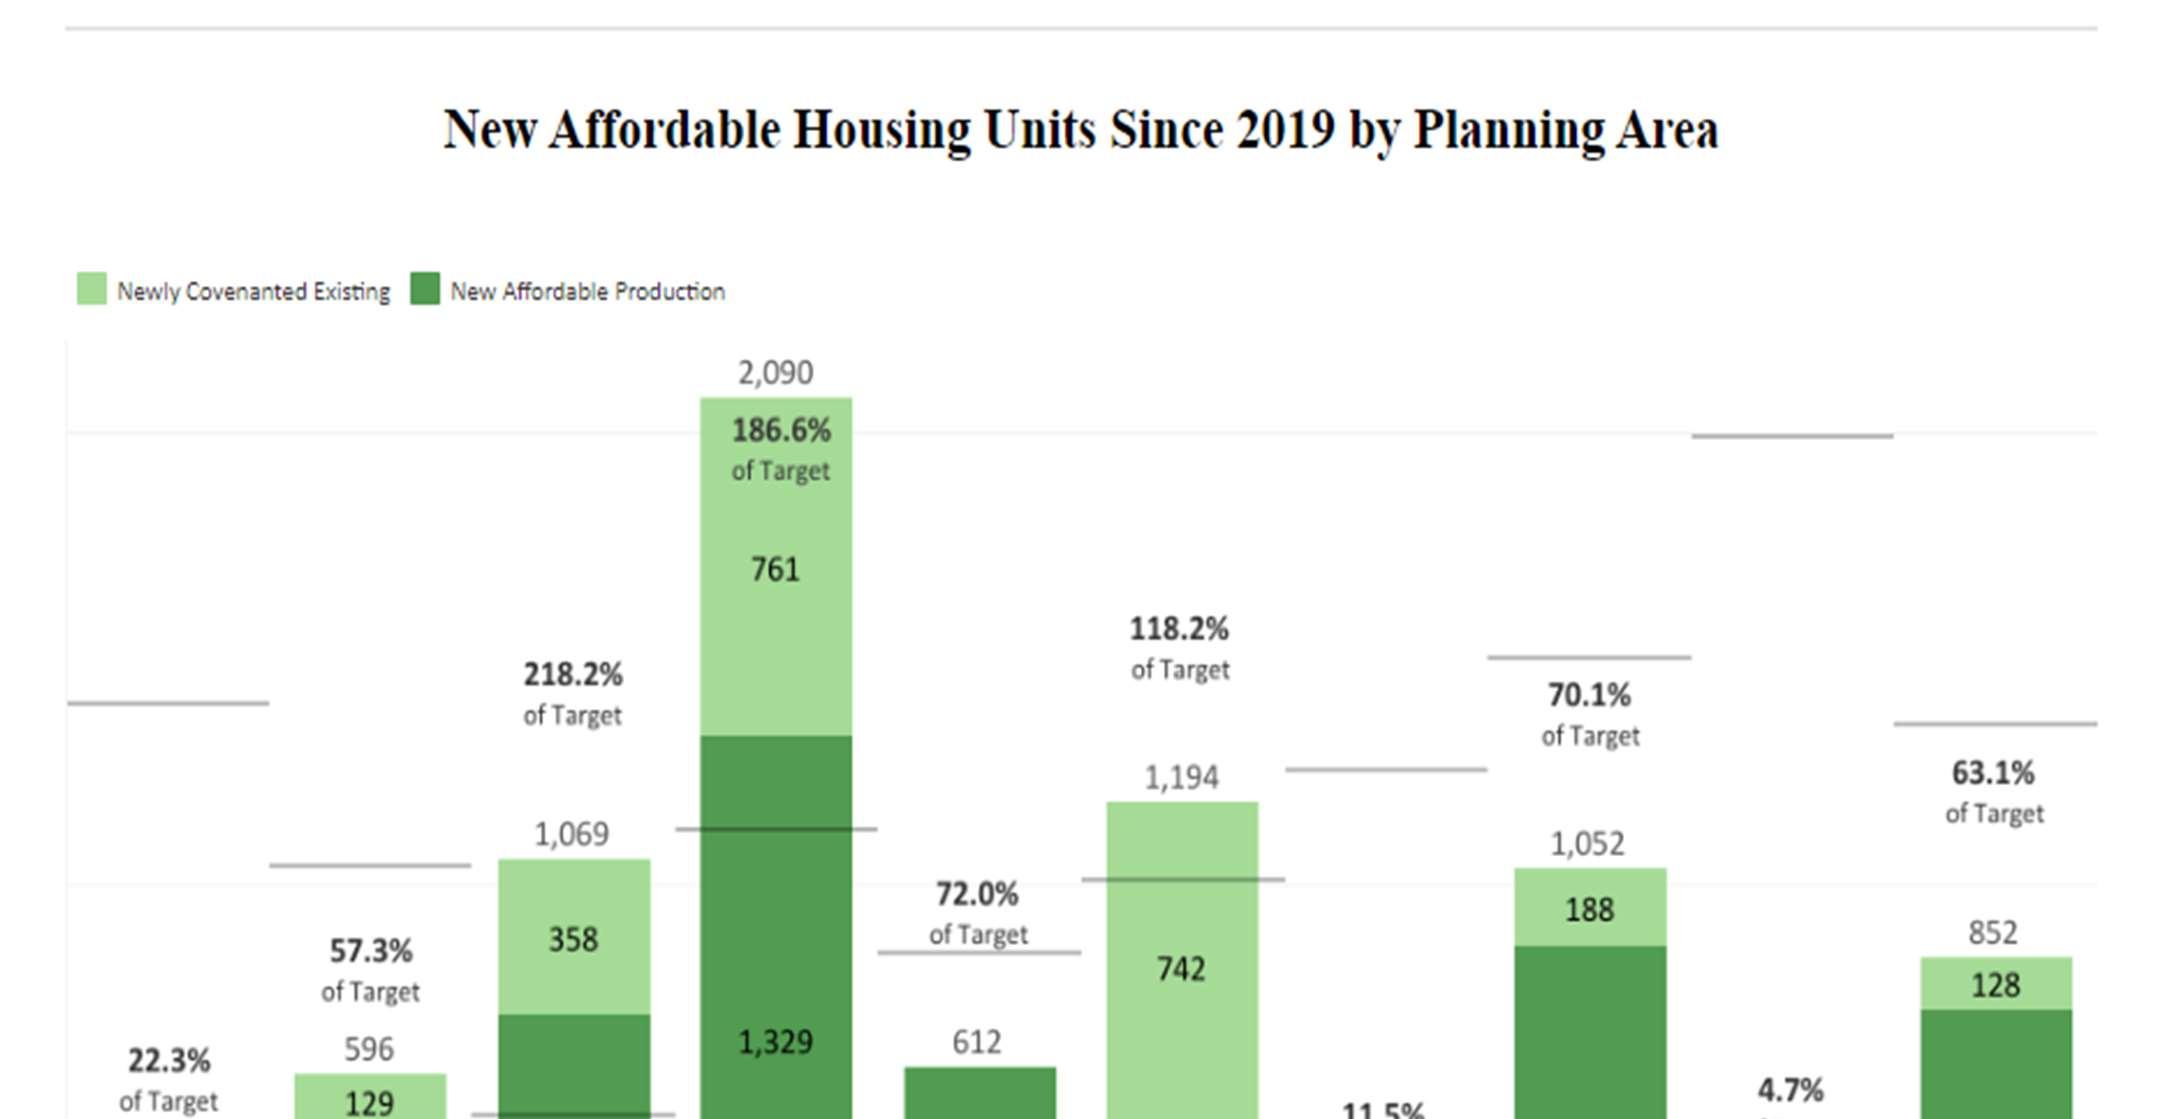
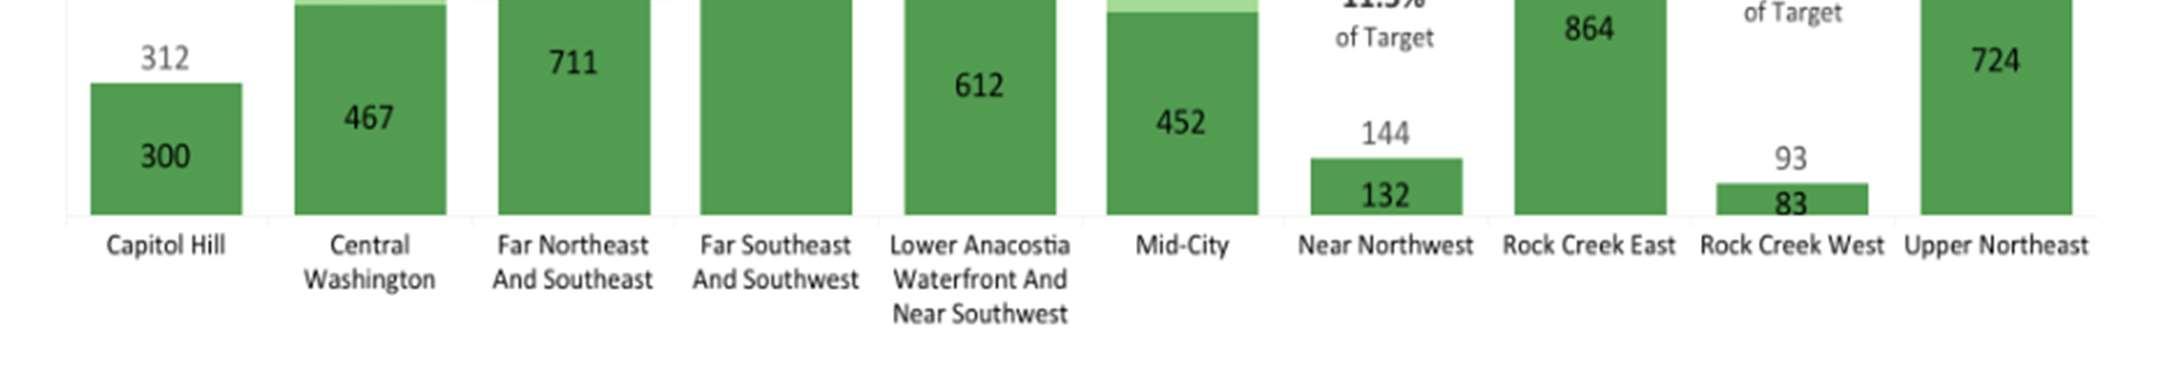
Other wealthy areas, such as Near Northwest and Capitol Hill, have also seen meager gains in affordable housing developments relative to the 2025 goal. Residents of wealthy neighborhoods tend to oppose the construction of affordable housing. For example, in 2023, the Chevy Chase Community Center was set to become a mixed-use development, with a sizeable portion of units to become dedicated housing stock. Though the development has not been certified by the city, some residents have already complained.260 Proponents of restrictive zoning have long been an obstacle to building affordable housing in wealthy neighborhoods. Some claim that building affordable housing would diminish the neighborhoods character. The 36,000 new homes planned by the current administration were specifically designed to build more homes in wealthy secluded neighborhoods in D.C.261 Yet, the D.C. government has struggled to follow up on that promise,
260 Molloy, Mary. 2023. D.C’s Chevy Chase neighborhood in uproar over affordable housing. Washington Post. Retrieved on September 25, 2023 from https://www.washingtonpost.com/dc-md-va/2023/07/09/chevy-chase-dc-affordable-housingcommunity-center/
261 Baca, Alex. 2019. DC wants more affordable housing in wealthy neighborhoods, per its newly-released targets. Greater Greater Washington. Retrieved on September 25, 2023 from https://ggwash.org/view/74302/washington-dc-where-bowser-wants-to-buildmore-affordable-housing
262
instead building much of the affordable housing stock in poorer areas, which typically have lower levels of rent anyway. Less than one percent of the District’s affordable housing stock is in Ward 3.
Historically, apartment buildings for low-income residents were built in low-income areas. Ward 3 was specifically zoned to develop expensive low-density, single-family homes.263 Consequently, Ward 3 homes are far too expensive to those who have been economically disadvantaged. Research has shown that building affordable housing units in high-income neighborhoods can lead to racial and economic integration.264 In 2018, a report from the D.C. Policy Center concluded that developing high-density lots in the upper Northwest region of D.C. would help ease the increasing cost of rent elsewhere.265
In 2023, the current administration has set to cut spending on affordable housing programs. The Housing Production Trust Fund, a tool used to finance new affordable housing units, has seen significant cuts in 2024’s fiscal year.266 In 2023, the fund was given $500 million, propped up in large part with federal pandemic funds. The 2024 budget cut funding to $100 million, and the 2025 budget is $80 million.267 Housing construction costs have risen sharply over the past decade, while funding for the Housing Production Trust Fund has hovered around $100 million per year (and less in FY 2025), which means the number of affordable housing units being built or rehabilitated is declining over time. The budget cuts make it significantly harder for affordable housing units to compete against luxury apartments built across the city. Moreover, construction of new homes has become more expensive due to supply chain issues.268 Though the District seems slated to reach the 36,000 homes, further efforts to expand the current affordable housing stock may be limited.
262 Baca, Alex. 2019. DC wants more affordable housing in wealthy neighborhoods, per its newly-released targets. Greater Greater Washington. Retrieved on September 25, 2023 from https://ggwash.org/view/74302/washington-dc-where-bowser-wants-to-buildmore-affordable-housing
263 Zickuhr, Kathryn. 2018. Discriminatory housing practices in the District: a brief history. D.C. Policy Center. Retrieved on September 25, 2023 from https://www.dcpolicycenter.org/publications/discriminatory-housing-practices-in-the-district-a-briefhistory/
264 Local Housing Solutions. 2023. Expanding affordable housing in resource-rich neighborhoods. Retrieved on September 25, 2023 from https://localhousingsolutions.org/policy-objectives/expanding-affordable-housing-in-resource-rich-neighborhoods/
265 Sayin, Yesim. 2018. Taking stock of the District’s housing stock: capacity, affordability and pressures on family housing. D.C. Policy Center. Retrieved on September 25, 2023 from https://www.dcpolicycenter.org/publications/taking-stock/
266 Baskin, Morgan. 2023. Bowser proposes slashing emergency rental assistance, housing production funds amid grim economic forecast. DCist. Retrieved on September 25, 2023 from https://dcist.com/story/23/03/24/bowser-budget-rental-assistancehousing-production/
267 Baskin, Morgan. 2023. Bowser proposes slashing emergency rental assistance, housing production funds amid grim economic forecast. DCist. Retrieved on September 25, 2023 from https://dcist.com/story/23/03/24/bowser-budget-rental-assistancehousing-production/
268 Baskin, Morgan. 2023. Bowser proposes slashing emergency rental assistance, housing production funds amid grim economic forecast. DCist. Retrieved on September 25, 2023 from https://dcist.com/story/23/03/24/bowser-budget-rental-assistancehousing-production/
There is an ongoing effort to increase the supply of affordable housing production and preservation. District government agencies such as the Department of Housing and Community Development (DCHD), the Deputy Mayor for Planning and Economic Development (DPMED), the DC Housing Authority, the DC Housing Finance Agency and DC Inclusionary Zoning program all have capabilities to spearhead new affordable housing projects or preservation.
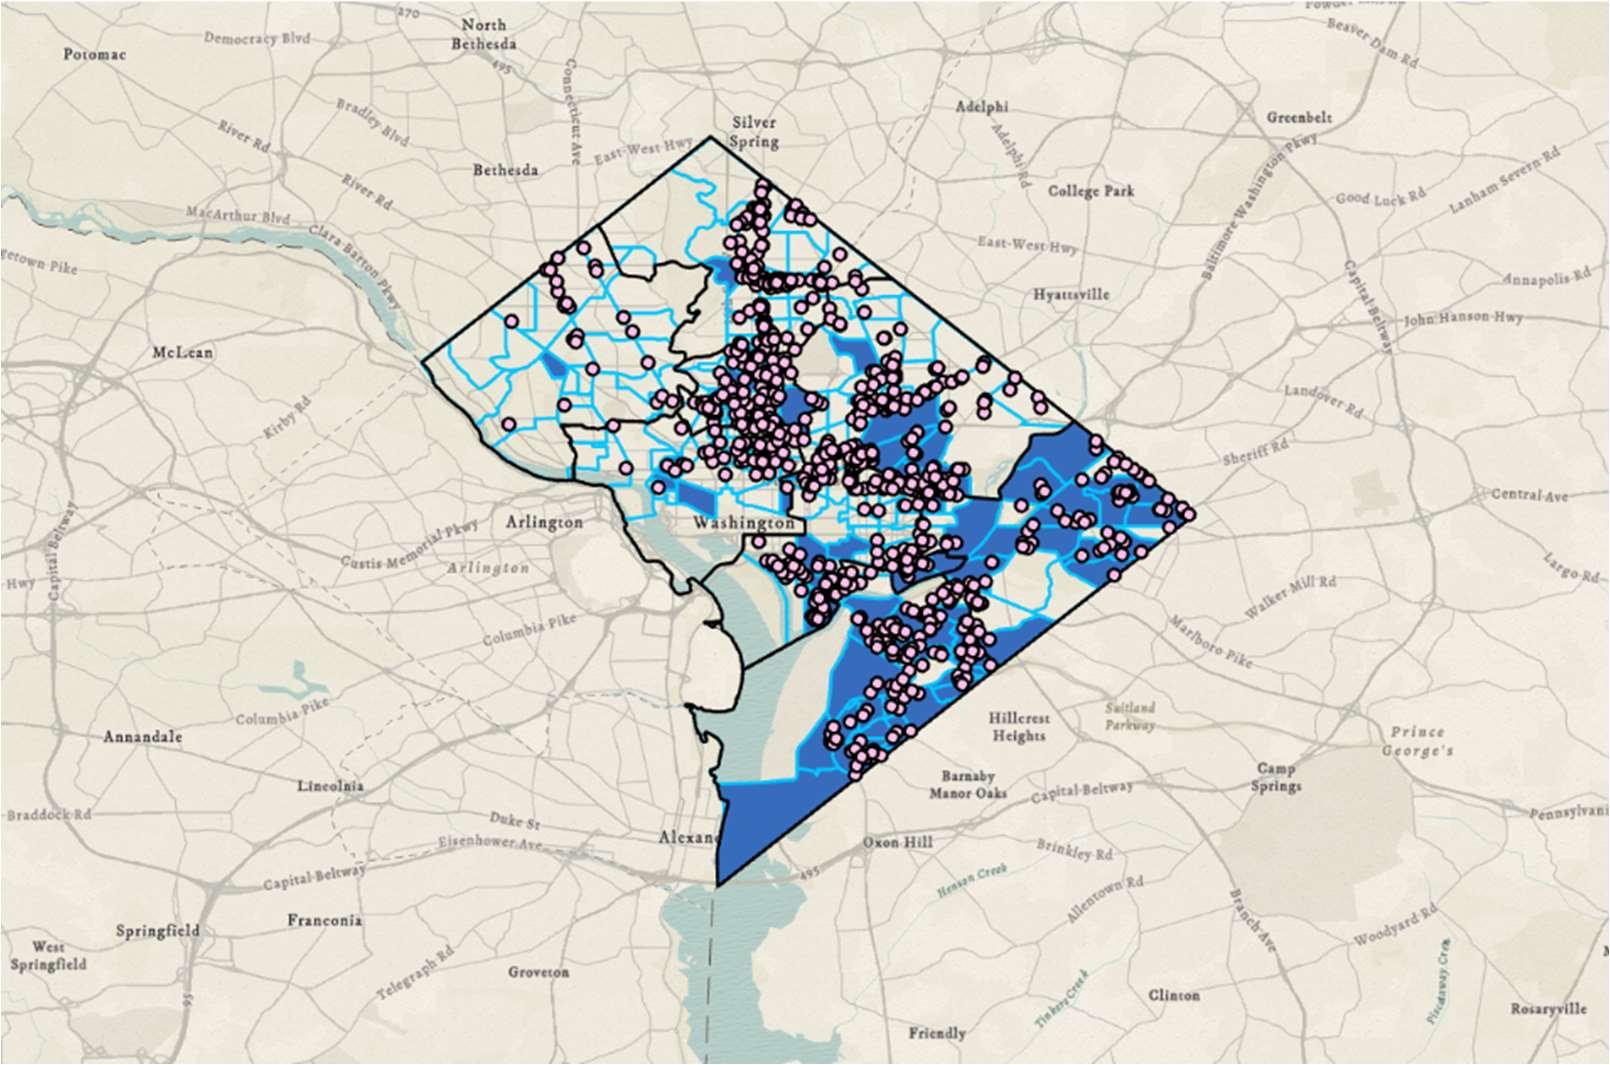
Seen in Figure 13 is the number housing projects that have begun construction or have opened to the public since 2015. There are an estimated 837 ongoing or completed projects designated by the agencies mentioned above in 2023. The areas highlighted in blue are identified as “low-income communities” or areas of the city that are experiencing poverty at a rate of 20% or higher. Perhaps not surprisingly, much of the ongoing or completed construction and preservation of affordable housing units are outside wealthy areas of the District. Planning affordable housing project in low-income areas seems to be an established trend amongst District city planners. As seen in the figure above, wealthy areas West of Rock Creek Park have significantly less affordable housing projects planned or completed compared to poorer wards such as Wards 7 and 8. For example, in Ward 8 there are 127 completing or completed affordable housing projects provided by the agencies listed above. In Ward 3, that number there are 26 housing projects. This number may be misleading as data on the number of units in each building is not publicly available, however much of the building of affordable homes is centered in low-income and historically Black neighborhoods.
Zoning Regulations
Updating zoning regulations is potentially one of the most vital tools in the fight for more affordable housing. Fundamentally, zoning is a constraint on how and what developers can build on a single parcel of land. Developers, residents and even Advisory Neighborhood Commissions have an input on what a piece of land in the District should be utilized for. Analysis of zoning laws and regulations can provide salient information about the supply of housing stock in the District. D.C., much like the rest of the country, has a sizeable amount of land dedicated to single-family homes -- as opposed to condominiums or cooperatives, which tend to be higher density -- limiting the ability to build more housing. An estimated 59% of homeowners own single-family homes.269 On the Official District Zoning Map, these properties are given the designation of “residential properties” which are “residential zones, designed to provide for stable, low-to-moderate-density residential areas suitable for family life and supporting uses.”270 Pictured below is a map of the residential zoning units across the District.271 Though there are many low-density zoning classifications, some of which are single-family zones, and others that are row dwellings, the purpose of these residential zoning parcels is to keep density low.
269 D.C. Policy Center. 2020. Appraising the District’s rentals – landscape of rental housing. Retrieved on September 20, 2023 from https://www.dcpolicycenter.org/publications/appraising-the-districts-rentals-chapter-ii/
270 D.C. Office of Zoning. 2023. Zoning handbook. Retrieved on September 20, 2023 from https://handbook.dcoz.dc.gov/pages/residential-r-zones#R-1B
271 Flanagan, Neil. 2016. This map illustrates DC’s new zoning rules. Greater Greater Washington. Retrieved on September 20, 2023 from https://ggwash.org/view/43304/this-map-illustrates-dcs-new-zoning-rules
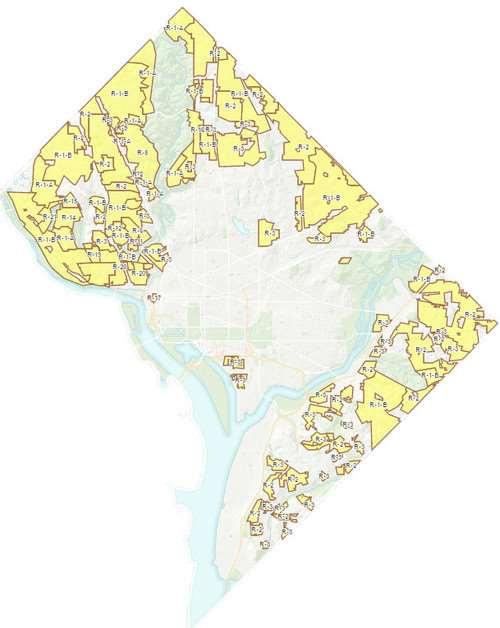
Figure 10: Single Family Zoning across the District, Office of Zoning
Low-density zoning is one of the greatest constraints of housing supply. As only a few housing units can be built on a parcel, the housing stock in the designated areas is very limited. Ward 3 and the northern part of Ward 4 represent the areas of the city most dominated by zoning restricted to single-family homes. Consequently, the most expensive housing can also be found in this area. Empirical evidence indicates low-density zoning artificially increases housing prices.272 While low-density zoning can be found in poorer parts of the District, like Wards 7 and 8, these areas have seen historic disinvestment (these areas also have a large amount of public housing and apartment buildings, unlike the wealthier areas of the city), explaining cheaper rent and home prices.273 Low-density zoning also segregates communities by race and socio-economic status.274 Zoning regulations have a profound effect on where people are able to live, and more often than not, lawmakers have used zoning regulations to segregate cities. D.C. is no exception. The original zoning codes in the District were built by segregationist developers.275 The wealthy, restrictively zoned areas of the predominantly white Northwest quadrant have become out of reach for lowand middle-class Black residents.
272 Mleczko & Desmond. 2023. Using natural language processing to construct a national zoning and land use database. Sage Journals. Retrieved on September 20, 2023 from https://journals.sagepub.com/doi/epdf/10.1177/00420980231156352
273 Burton, Elizabeth. 2022. DC’s population growth has affected the racial and ethnic composition of Wards 6, 7 and 8. Urban Institute. Retrieved on September 20, 2023 from https://greaterdc.urban.org/blog/dcs-population-growth-has-affected-racial-andethnic-composition-wards-6-7-and-8
274 Mleczko & Desmond. 2023. Using natural language processing to construct a national zoning and land use database. Sage Journals. Retrieved on September 20, 2023 from https://journals.sagepub.com/doi/epdf/10.1177/00420980231156352
275 Goggin, Brian. 2019. Historic housing policies segregated DC and hurt Black residents. How do we do better now? Greater Greater Washington. Retrieved on September 20, 2023 from https://ggwash.org/view/75053/we-have-a-history-of-housingpolicies-that-hurt-and-segregated-black-people-how-do-we-fix-it-now
Reforming zoning regulations could create more integrated neighborhoods and increase the housing supply. Ward 1, which is primarily composed of medium to high density housing stock,276 has no racial majority and has a large stock of affordable homes.277 Across the country, other cities, such as Minneapolis and Portland, have eliminated their restrictive zoning regulations. According to a study provided by Pew Research Center, eliminating restrictive regulations in these cities slowed rent growth and increased housing supply.278 While not a complete solution to the growing housing crisis in the District, reforming zoning regulations could be an important tool for providing affordable housing. Loosening restrictions could provide the necessary incentives to build more housing.
In this report, gentrification is defined as the arrival of new wealthy residents into an established, urban area with low average incomes; bringing about economic and environmental changes, which often leads to the displacement of poorer residents, changing the demographics of the area.279 Gentrification has become a key issue for poorer, long-term residents who wish to avoid displacement. When wealthier residents arrive in an area, the price of land tends to increase.280 The price of land increases as wealthier residents are more than likely to pay higher rents while also demanding better goods and services in the area.281 Key to gentrification is the profit-incentive behind neighborhood development. Developers look to take advantage of cheap land and build expensive housing to court the wealthy arrivals. Displacement is further exacerbated if luxury housing is built without accommodating the previous long-term residents of the lot.
D.C. is no stranger to gentrification. In 2019, the city was ranked the most gentrified city in the country (though the city did lose that title not too long after).282 Gentrification picked up starting in the early 2000s, fueled in part by efforts of then Mayor Williams to increase DC's tax base
276 D.C. Office of Zoning. 2023. Official zoning map. Retrieved on September 20, 2023 from https://handbook.dcoz.dc.gov/pages/residential-r-zones#R-3
277 D.C. Health Matters. 2023. 2023 demographics. Retrieved on September 20, 2023 from https://www.dchealthmatters.org/demographicdata?id=131488
278 Horowitz & Canavan. 2023. More flexible zoning helps contain rising rents. Pew. Retrieved on September 20, 2023 from https://www.pewtrusts.org/en/research-and-analysis/articles/2023/04/17/more-flexible-zoning-helps-contain-risingrents#:~:text=The%20evidence%20indicates%20that%20more,generally%20saw%20faster%20rent%20growth.
279 Urban Displacement Project. 2023. What are gentrification and displacement. Retrieved on September 20, 2023 from https://www.urbandisplacement.org/about/what-are-gentrification-and-displacement/
280 National Low Income Housing Coalition. 2019. Gentrification and neighborhood revitalization: what’s the difference? Retrieved on September 20, 2023 from https://nlihc.org/resource/gentrification-and-neighborhood-revitalization-whats-difference
281 National Low Income Housing Coalition. 2019. Gentrification and neighborhood revitalization: what’s the difference? Retrieved on September 20, 2023 from https://nlihc.org/resource/gentrification-and-neighborhood-revitalization-whats-difference
282 Austermule, Martin. 2020. D.C. no longer the ’most intensely gentrified city’ in U.S., ranking behind San Francisco and others in new study. DCist. Retrieved on September 20, 2023 from https://dcist.com/story/20/06/18/dc-is-the-13th-most-gentrified-uscity-study/
through new arrivals.283 Even in the 1940s and 1950s, D.C. had sought to use urban renewal funds to build highways through historically Black middle-class neighborhoods.284
In the 2020s, even historical Black neighborhoods such as Anacostia have started to see the effects of gentrification. Homes sold to Black buyers east of the Anacostia River have been declining proportional to the increase in homes bought by non-Black buyers.285 There also have been increasing issues of affordability. The average home sold in the District cost nearly $300,000 in 2019, but the median renter could only afford $185,000.286 The change in demographics and increase in the price of homes could be indicators of gentrification within the area.
There are ways to slow or even contain gentrification. Often, high housing costs in in-demand areas force wealthier residents to look towards lower-income areas. Therefore, increasing existing housing supply in wealthier neighborhoods can decrease the migration of wealthy residents into poorer parts of D.C.287 Moreover, the District can expand upon affordable housing in poorer areas of the District. As of 2022, 14.5% of the land east of the Anacostia River is considered vacant.288 Preserving affordable housing units is integral for ensuring that residents are not displaced. But if the housing supply in an area does not increase on pace with demand, rents will increase regardless. The District therefore should build more affordable housing on land that is not considered in use.
In 2022, the U.S. Department of Housing and Urban Development (HUD) issued a report on the state of the D.C. Housing Authority (DCHA). The report did not mince words. HUD concluded that DCHA that there were five issues contributing to DCHA’s failure to distribute Housing
283 Austermule, Martin. 2020. D.C. no longer the ’most intensely gentrified city’ in U.S., ranking behind San Francisco and others in new study. DCist. Retrieved on September 20, 2023 from https://dcist.com/story/20/06/18/dc-is-the-13th-most-gentrified-us-citystudy/
284 Kiger, Patrick. 2022. Understanding gentrification in D.C. WETA. Retrieved on September 20, 2023 from https://neighborhoods.wetaguides.org/neighborhood/understanding-gentrification-dc
285 Mitra & Theodos. 2023. Homeownership and race in the DC communities east of the Anacostia River. Urban Institute. Retrieved on September 20, 2023 from https://www.urban.org/sites/default/files/202302/Homeownership%20and%20Race%20in%20DC%20Communities%20East%20of%20the%20Anacostia%20River.pdf
286 Mitra & Theodos. 2023. Homeownership and race in the DC communities east of the Anacostia River. Urban Institute. Retrieved on September 20, 2023 from https://www.urban.org/sites/default/files/202302/Homeownership%20and%20Race%20in%20DC%20Communities%20East%20of%20the%20Anacostia%20River.pdf
287 Goodman, et al. 2020. To understand a city’s pace of gentrification, look at its housing supply. Urban Institute. Retrieved on September 20, 2023 from https://www.urban.org/urban-wire/understand-citys-pace-gentrification-look-its-housing-supply
288 Mitra & Theodos. 2023. Homeownership and race in the DC communities east of the Anacostia River. Urban Institute. Retrieved on September 20, 2023 from https://www.urban.org/sites/default/files/202302/Homeownership%20and%20Race%20in%20DC%20Communities%20East%20of%20the%20Anacostia%20River.pdf
Choice Voucher (HCV) programs and operating DCHA Public Housing (PH) programs.289 The five areas of improvement are provided below:
Inadequate oversight, management and tracking of critical “Financial Management and Procurement” functions and indicators that directly contribute to DCHA’s failure to comply with program requirements;290
Inadequate management and knowledge of property management functions including compliance with HUD rules and regulations that directly contributes to DCHA’s failure to comply with program requirements;
Inadequate management and knowledge of HCV program functions including compliance with HUD rules and regulations that directly contributes to DCHA’s failure to comply with program requirements;
Poor oversight of DCHA policies and operations, by DCHA’s Board of Commissioners and Executive Leadership that directly contributes to DCHA’s failure to comply with program requirements; and,
DCHA’s failure to provide decent, safe, and sanitary housing opportunities for residents in violation of program requirements.291
Conducting interviews with DCHA board members, HUD found that “all members displayed awareness of the problems the housing authority faces regarding the poor condition of the housing stock.”292 The report fixates on DCHA inability to adhere to HUD regulations for public housing stock. DCHA has the largest vacancy rate in the country (24%), yet one of the largest waitlists for public housing. DCHA’s ineptitude in pairing residents with vacant stems from the one of the key issues listed by HUD, that being the current disrepair of housing stock. Many housing units are left vacant as DCHA has not repaired them. HUD claims that DCHA is currently not maintaining units in “a decent, safe and sanitary condition.”293 When HUD asked for documentation about lead-levels in DCHA PH, the District agency could not provide evidence.294 Pictured below are the most extreme cases of vacant building mismanagement:
289 U.S. Department of Housing and Urban Development. 2022. District of Columbia Housing Authority assessment. Retrieved on September 19, 2023 from https://oag.dc.gov/sites/default/files/2022-10/DCReview_Final%209302022%20%281%29.pdf
290 U.S. Department of Housing and Urban Development. 2022. District of Columbia Housing Authority assessment. Retrieved on September 19, 2023 from https://oag.dc.gov/sites/default/files/2022-10/DCReview_Final%209302022%20%281%29.pdf
291 U.S. Department of Housing and Urban Development. 2022. District of Columbia Housing Authority assessment. Retrieved on September 19, 2023 from https://oag.dc.gov/sites/default/files/2022-10/DCReview_Final%209302022%20%281%29.pdf
292 U.S. Department of Housing and Urban Development. 2022. District of Columbia Housing Authority assessment. Retrieved on September 19, 2023 from https://oag.dc.gov/sites/default/files/2022-10/DCReview_Final%209302022%20%281%29.pdf
293 U.S. Department of Housing and Urban Development. 2022. District of Columbia Housing Authority assessment. Retrieved on September 19, 2023 from https://oag.dc.gov/sites/default/files/2022-10/DCReview_Final%209302022%20%281%29.pdf
294 U.S. Department of Housing and Urban Development. 2022. District of Columbia Housing Authority assessment. Retrieved on September 19, 2023 from https://oag.dc.gov/sites/default/files/2022-10/DCReview_Final%209302022%20%281%29.pdf
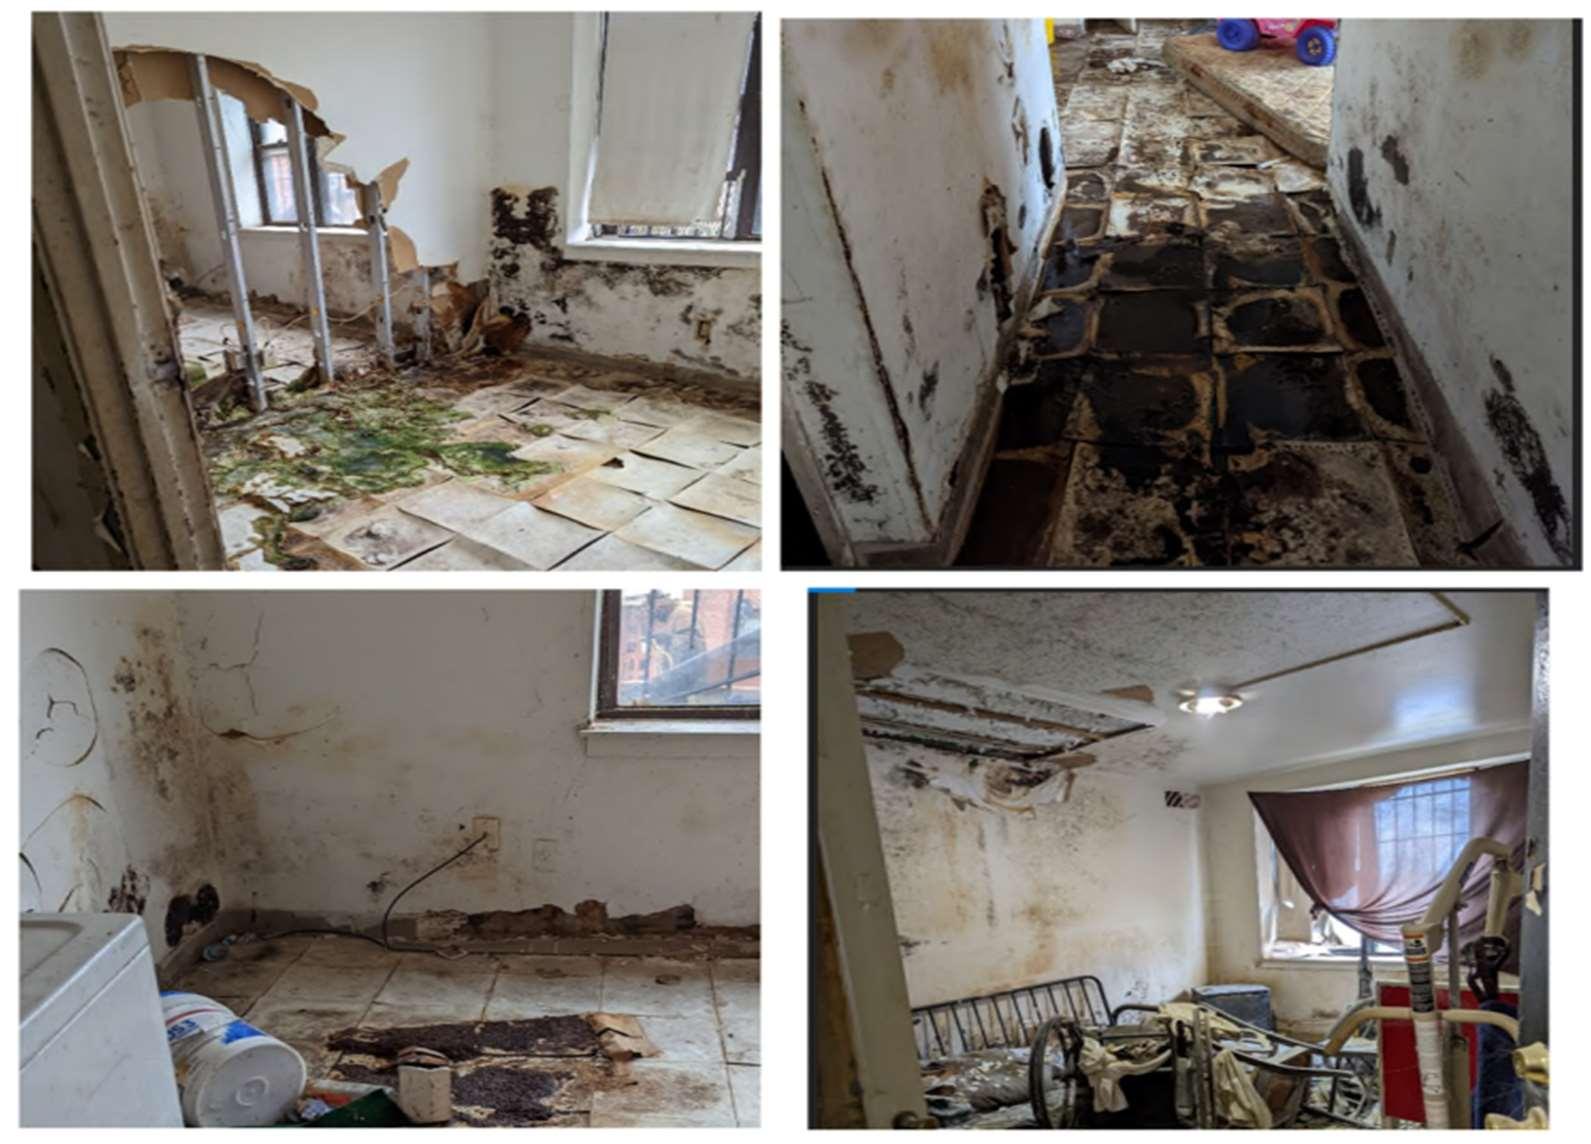
Vacant homes, U.S. Department of Housing and Urban Development.295
The poor housing stock compounded by the large waitlist for public housing led HUD to report that DCHA was not adequately serving low-income residents in the D.C. metro area.296
The treatment of low-income residents is particularly upsetting. Contrary to HUD regulations, DCHA does not offer tenants the choice of flat rents or income-based rents. The choice between a flat rate rent and a rent rate dependent on income provides low-income tenants options of affordability, whichever plan suits them best. Of the documents obtained by HUD, many tenants were paying a flat rate rent.297 However, the DCHA flat rate schedule has not been updated to meet Fair Market Rent298 indicating that residents of DCHA public housing were not provided an entirely affordable option. DCHA’s payment for flat rates are (as of 2022) 187% of the current HUD recommendations.299 Moreover, DCHA was not calculating Home Assistance
295 U.S. Department of Housing and Urban Development. 2022. District of Columbia Housing Authority assessment. Retrieved on September 19, 2023 from https://oag.dc.gov/sites/default/files/2022-10/DCReview_Final%209302022%20%281%29.pdf
296 U.S. Department of Housing and Urban Development. 2022. District of Columbia Housing Authority assessment. Retrieved on September 19, 2023 from https://oag.dc.gov/sites/default/files/2022-10/DCReview_Final%209302022%20%281%29.pdf
297 U.S. Department of Housing and Urban Development. 2022. District of Columbia Housing Authority assessment. Retrieved on September 19, 2023 from https://oag.dc.gov/sites/default/files/2022-10/DCReview_Final%209302022%20%281%29.pdf
298 U.S. Department of Housing and Urban Development. 2022. District of Columbia Housing Authority assessment. Retrieved on September 19, 2023 from https://oag.dc.gov/sites/default/files/2022-10/DCReview_Final%209302022%20%281%29.pdf
299 U.S. Department of Housing and Urban Development. 2022. District of Columbia Housing Authority assessment. Retrieved on September 19, 2023 from https://oag.dc.gov/sites/default/files/2022-10/DCReview_Final%209302022%20%281%29.pdf
Payments in accordance with HUD regulations.300 The HUD report provides substantial evidence that low-income residents residing in DCHA PH were provided poor housing and expected to pay incorrect and potentially financially damaging rent rates.
HUD also found that the Housing Choice Voucher (HCV) program was in complete disarray. DCHA closed their HCV waiting list in 2013 and ten years later, are planning on reopening 1,200 new units, previously left vacant.301 HUD found DCHA to be in noncompliance with current regulations surrounding HCVs.302 More frustratingly, DCHA was unable to provide a method of how applicants were selected to receive HCVs.303 The agency even failed to conduct quality control reviews of HCV participant files,304 adding further proof to overall mismanagement and agency disarray.
In response to the scathing critique of DCHA operations, the agency responded to the HUD report in November of 2022. In the response, DCHA admitted that the finding of the report was “not surprising.”305 By summer of 2023, of the 100+ issues identified in the HUD report, not even half have been resolved.306 However, DCHA has started to make some adjustments. For example, the staff has rewritten the current operating plans and has started to make tweaks to the HCV programs.307 Additionally, the District has selected a new executive director of the DCHA, Keith Pettigrew, the current CEO of Alexandria Redevelopment. He is slated to start November 1st, 2023.
DCHA’s Move to Work Plan
In a plan approved by Congress, DCHA’s 2025 fiscal year budget aims to:
Reduce costs and achieve greater cost effectiveness
300 U.S. Department of Housing and Urban Development. 2022. District of Columbia Housing Authority assessment. Retrieved on September 19, 2023 from https://oag.dc.gov/sites/default/files/2022-10/DCReview_Final%209302022%20%281%29.pdf
301 Cloherty, Megan. 2023. DC is ready to clear 20,000 names from waitlist, and reopen public housing applications. WTOPnews. Retrieved on September 19, 2023 from https://wtop.com/dc/2023/03/dc-is-ready-to-clear-20000-names-from-waitlist-andreopen-public-housing-applications/
302 U.S. Department of Housing and Urban Development. 2022. District of Columbia Housing Authority assessment. Retrieved on September 19, 2023 from https://oag.dc.gov/sites/default/files/2022-10/DCReview_Final%209302022%20%281%29.pdf
303 U.S. Department of Housing and Urban Development. 2022. District of Columbia Housing Authority assessment. Retrieved on September 19, 2023 from https://oag.dc.gov/sites/default/files/2022-10/DCReview_Final%209302022%20%281%29.pdf
304 U.S. Department of Housing and Urban Development. 2022. District of Columbia Housing Authority assessment. Retrieved on September 19, 2023 from https://oag.dc.gov/sites/default/files/2022-10/DCReview_Final%209302022%20%281%29.pdf
305 District of Columbia Housing Authority. 2023. Response to the U.S. Department of Housing and Urban Development’s March 2022 on-site assessment report. DCHA. Retrieved on September 19, 2023 from https://www.dchousing.org/wordpress/wpcontent/uploads/2022/11/DCHA-Response__U.S.-Department-of-Housing-and-Urban-Development-Assessment-Report.pdf
306 Barker, Eleanor. 2023. DCHA misses deadline on some HUD requirements. Greater Greater Washington. Retrieved on September 19, 2023 from https://ggwash.org/view/89847/breakfast-links-dcha-fails-to-met-hud-requirements-on-deadline
307 Baskin, Morgan. 2023. DCHA’s deadline to fix major problems has come and gone. Here's where things stand. DCist. Retrieved on September 19, 2023 from https://dcist.com/story/23/06/01/dc-dcha-deadline-hud-report/
Provide incentives to families with children to obtain employment to become self sufficient
Increase housing choices for low-income families.
Through Move to Work (MTW) plan, DCHA has the ability to waive parts of the US Housing Act of 1937 and some regulations to design and test approaches for providing housing assistance, that falls in line with the objectives above. Within the report, DCHA anticipates that the Park Morton, Kenilworth and Barry Farms homes will gain occupancy come 2025.
The 2025 MTW program moves to remove up to 7,937 units from the agency’s public housing portfolio for conversion to project-based vouchers, using the Faircloth-to-Rental Assistance Demonstration (RAD) conversion.
According to DCHA, the federal government does not provide enough funding to make the improvements that residents of public housing deserve. Therefore, RAD is used by DCHA to improve public housing properties by converting units to a Section 8 contract, without changing
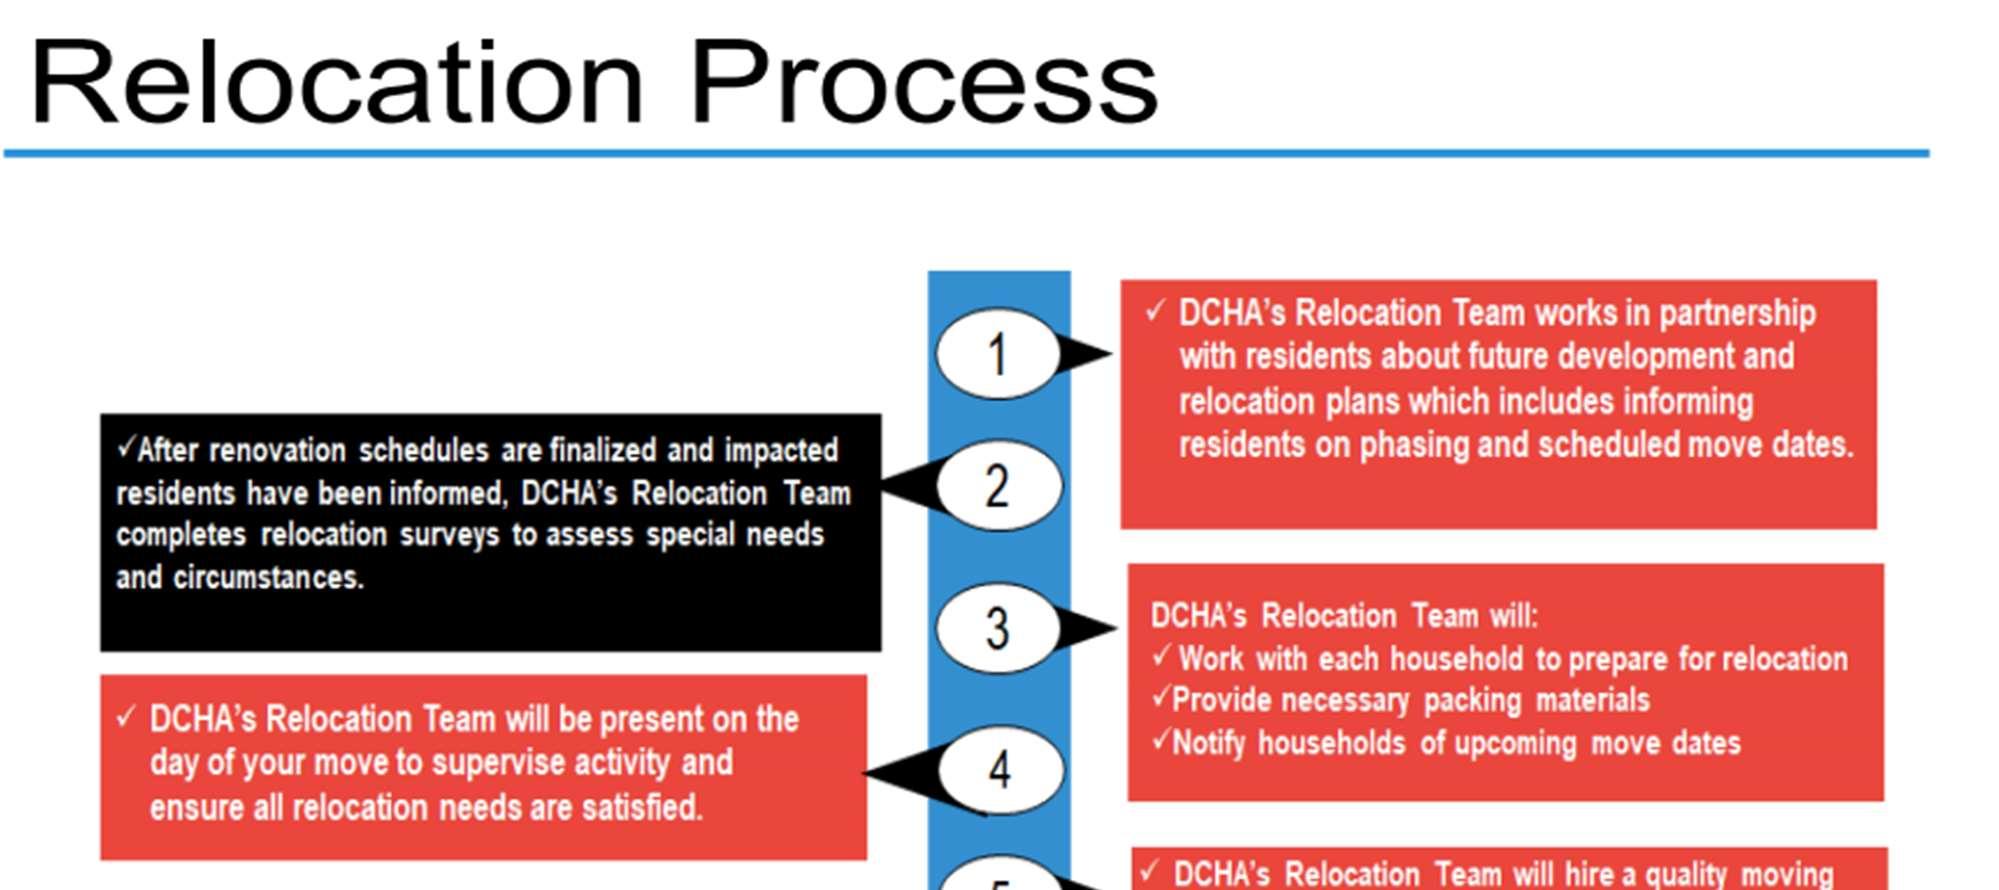
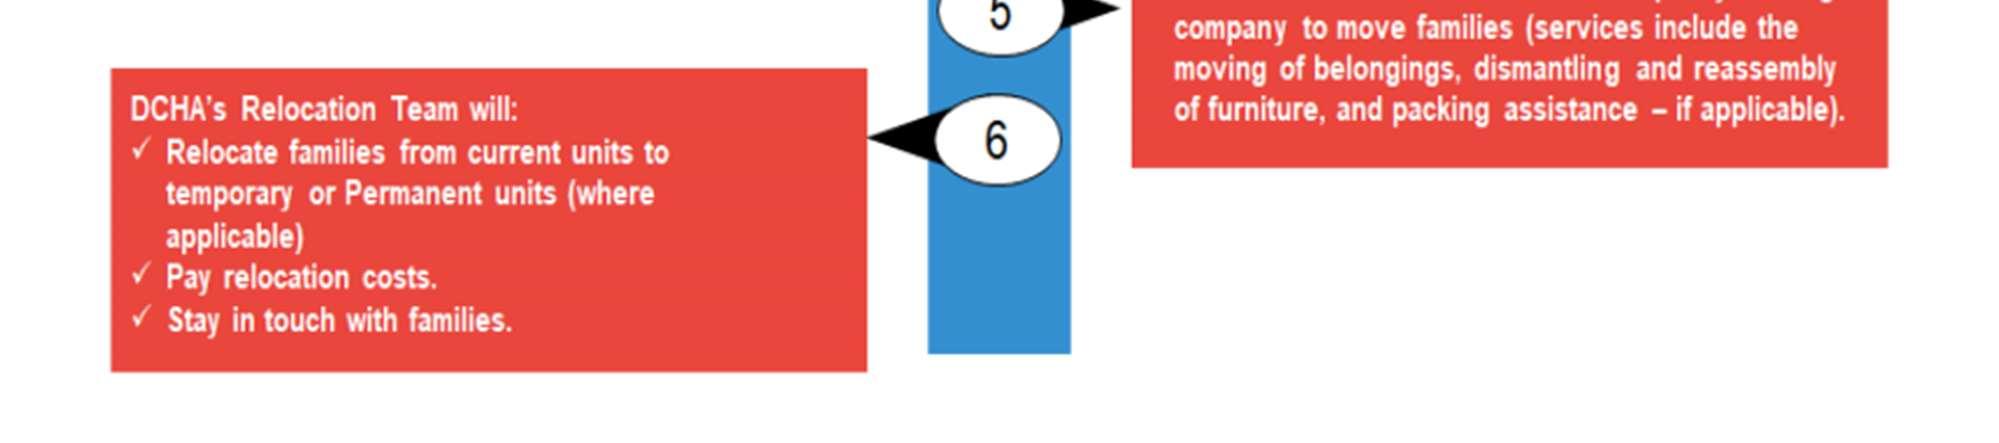
rent income, without displacing residents, or removing housing benefits. Residents will not have to rescreen under RAD conversion. Residents, however, will have to be relocated during the renovation process.
Even with the official end of the COVID-19 pandemic, working from home still remains popular for office workers, especially in Downtown DC. While work from home provides flexibility to workers, managers and owners of business now have little reason to own or rent expensive office buildings in one of the most expensive parts of the city. As of 2024, at least 22% of the office space in Downtown DC is vacant.308 The low occupancy rate has directly impacted the District’s property tax collection. For years, the District has relied on the property tax collections from downtown office buildings as a major source of revenue, but the well is running dry.
For that reason, the current administration has prioritized converting office buildings into residential units to bring needed tax revenue with the added benefit of revitalizing downtown. This also had the added benefit of providing more housing to the District. In 2024, the first of the converted buildings was completed, resulting in a new mixed-use 163-unit apartment building with 8,000 square feet of retail space.309 However, the apartments are deeply unaffordable. The rent can range from $2,100 to $6,000 depending on unit size.310 While the prices are exorbitant, only 10% of Downtown DC is residential.311 This means that an increase in number of units available will stabilize rent costs by increasing the supply of homes. Moreover, it bucks the trend of removing existing residents and instead coverts a space that was not being used efficiently. Though the units may be unaffordable, the addition of units in an area so close to Downtown will temporarily slow gentrification down, as upper-class residents will no longer have to look towards mixed-income or low-income neighborhoods to reside.
While overall successful, the addition of conversions may directly threaten tenants’ rights. As developers hold leverage over a city that is severely lacking in affordable housing options, there have been documented attempts to barter with the city. According to the existing landlord lobby, tenant rights and affordable housing are at odds with one another. For example, landlords have
308 Flynn, Megan. 2024. In its third life, D.C. office building becomes first housing conversion, The Washington Post. Retrieved on July 12, 2024 from https://www.washingtonpost.com/dc-md-va/2024/07/11/elle-office-housing-conversion-bowser-downtown-dc/
309 Flynn, Megan. 2024. In its third life, D.C. office building becomes first housing conversion, The Washington Post. Retrieved on July 12, 2024 from https://www.washingtonpost.com/dc-md-va/2024/07/11/elle-office-housing-conversion-bowser-downtown-dc/
310 Flynn, Megan. 2024. In its third life, D.C. office building becomes first housing conversion, The Washington Post. Retrieved on July 12, 2024 from https://www.washingtonpost.com/dc-md-va/2024/07/11/elle-office-housing-conversion-bowser-downtown-dc/
311 Flynn, Megan. 2024. In its third life, D.C. office building becomes first housing conversion, The Washington Post. Retrieved on July 12, 2024 from https://www.washingtonpost.com/dc-md-va/2024/07/11/elle-office-housing-conversion-bowser-downtown-dc/
argued that in order to build more homes in Downtown DC, they require the city to exempt conversion homes from the Tenant Opportunity to Purchase Act.
The Tenant Opportunity to Purchase Act (TOPA) is responsible for one of the most important tenant rights in the city. When a building is up for sale, the building must also go through the TOPA process. The building’s current residents have 45 days to formally organize a tenant’s association. From there, tenants are invited to the negotiating table, where they can either buy the building themselves, or collectively bargain for better living conditions with prospective buyers. In some cases, buyers offer tenants, a payment if they agree to move, allowing the new buyer to raise rents. For example, many buildings choose to collectively bargain with a new owner, demanding much needed amenities or living condition improvements.
The District has struggled to support buildings through the TOPA process. While there is a sizeable amount of money for the project, the District is hesitant to spend it.312 Part of this is due to the extremely high cost that many apartment buildings are worth, typically out of reach for most associations and governments to buy, but also due to the conservative nature of the board controlling the funds in the first place. The most recent high-profile TOPA purchase came from Buena Vista in Columbia Heights, which bought the building from a slum lord to create a building cooperative.
Moreover, landlords sometimes use loopholes and aggressive tactics to avoid negotiations with the city or a tenant’s association. For example, there have been recorded cases where tenants were not informed of their TOPA rights and were simply given compensation. Perhaps most infamously, some landlords declare bankruptcy, despite still owning the building, to avoid the negotiating table. These tactics are predominately used by slumlords, such as the case as the Marbury Plaza building in Southeast DC, a majority poor, Black apartment complex unit.
In 2018, landlords pushed successfully for the removal of TOPA rights in single family homes. After this success, landlords have recently attempted to exempt TOPA from rent controlled buildings and office to apartment conversions. Landlords argue that the TOPA process would slow down construction of additional units of housing. However, this goes against years of evidence that even with TOPA, DC has the capacity to build large, profitable luxury housing
312 Golding, Eliana. 2023. A holistic and reparative agenda for ending displacement in DC. DC Fiscal Policy Institute. Retrieved on August 28, 2024 from https://www.dcfpi.org/all/agenda-for-ending-displacement/
units. While this attempt was curbed by community activists, the sentiment from major city landlords still stands, affordable housing and tenant rights cannot co-exist. Yet, as outlined in this document, both affordable housing and tenant rights go hand in hand for creating a diverse, affordable city where anyone regardless of individual characteristics may thrive. It is imperative to protect, and strengthen, existing tenant rights within the District.
For buildings built before 1975, rent cannot increase by over 2% plus inflation a year, or only by inflation for seniors. (Legislation adopted in 2023 limited rent increases to 12% over two years, regardless of the rate of inflation). As a result, many of the older buildings in DC have remained affordable for long-term residents, despite rent increasing across the city at a breakneck pace. The rent control legislation, initially passed in the 1970s, has not been updated to include more recently constructed rental housing.
While renters are afforded strong rights within the District, those rights have come under attack in recent years. Moreover, much of the support from tax breaks directly benefits homeowners, rather than renters. As outlined in the previous sections, those who rent in the District tend to be less well off than homeowners. Thus, the structure of the current system incentives individuals and families to buy homes, but as it has been established, it is becoming increasingly more difficult to purchase an affordable home in the District. For this reason, both tenant rights and affordable housing are deeply intertwined.
The Office of the Tenant Advocate has developed a Tenant Bill of Rights. These rights apply to every tenant in the District.
1) A written lease is not required to establish tenancy. Certain lease clauses are prohibited, including landlord liability for failing to properly maintain the property.
2) The amount of the security deposit may not exceed the amount of 1-months rent.
3) Upon receiving your lease, the landlord must disclose your rent, any petition that could affect rent, surcharges, rent control, housing code violation reports, application fee, a three year history of mold, and the tenants right document
4) The landlord must provide receipts for rental payments
5) For buildings with rent control, landlords must inform tenants of the rent control policy
6) The landlord must ensure that your unit and all common areas as sanitary as of the first day of tenancy, known as the “warranty of habitability.” The landlord must maintain your apartment and all common areas of the building in compliance with the housing code; including keeping the premises safe and secure and free of rodents, pest, keeping the facilities in good repair, ensuring adequate heat, lighting and ventilation.
7) For properties built prior to 1978, the landlord must provide a current lead clearance report
8) Upon written notice from a tenant that mold or suspected mold exists in the unit, the landlord must inspect the premises with 7 days and remediate within 30 days.
9) The landlord may not unreasonably interfere with the tenant’s comfort, safety or enjoyment of a rental unit. The landlord may not retaliate against you for exercising any right of tenancy. Retaliation includes unlawfully seeking to recover possession of your unit to, to increase the rent, to decrease services or increase your obligations.
10)The landlord may not engage in discriminatory acts based on actual or perceived: race, color, religion, national origin, sex, age, marital status, genetic information, personal appearance, sexual orientation, gender identify or expression, familial status, family responsibilities, disability, matriculation, political affiliation, source of income, status as a victim of an intra-family offense, or place of residence or business.
11) The landlord may not interfere with the right of tenants to organize a tenant association, convene meetings, distribute literature, post information and provide building access to an outside tenant organizer.
12) Tenants must be given the opportunity to purchase an accommodation from before the landlord sells or demolishes the accommodation or discontinues the housing use.
13) Tenants have the right to receive relocation assistance from your landlord.
14) The landlord may evict tenants for only one of ten specific reasons set forth in Title V of the Rental Housing Act of 1985.
a. No tenant shall be evicted from a rental unit, notwithstanding the expiration of the tenants lease or rental agreement, so long as the tenant continues to pay the rent to which the housing provider is entitled to.
As shown the upcoming sections in this report, the fundamental tenant rights provided by the District of Columbia are routinely and deliberately broken by both public and private property management. The outright rejection of tenant rights disproportionately affects low-income residents, including residents of color. Strengthening and enforcing tenant rights is integral to protecting vulnerable and marginalized populations.


The Greenleaf Apartment Complex is located in the UPO designated Community Impact Zone (CIZ) of Buzzard Point, a low-income neighborhood located in Southwest DC. The public housing project at 1200 Delaware Ave SW primarily serves low-income, Black senior residents. Like all CIZs, Buzzard Point has serious issues dealing with crime, poverty and unemployment.
The Buzzard Point neighborhood was birthed from urban renewal projects of the late 1950s and early 1960s. From the very start, the neighborhood was boxed in the from the rest of DC due to highway development.313 Buzzard Point was selected for urban renewal development due to its proximity to the Capitol and the area’s reputation for being an “eyesore.”314 The word choice of “eyesore” is particularly salient, as before construction of major highways, the Southwest neighborhood was ethnically and
313 Malouff, Dan. 2011. Historica aerials show the disappearance of Southwest. Greater Greater Washington. Retrieved on July 16, 2024 from https://ggwash.org/view/7889/historic-aerials-show-the-disappearance-of-southwest.
314 Perry-Brown, Nena, 2020. Greenleaf Gardens was part of the birth of DC’s urban renewal projects. Greater Greater Washington. Retrieved on July 16, 2024 from https://ggwash.org/view/77050/greenleaf-gardens-was-part-of-the-birth-of-dcs-urban-renewalprojects
economically diverse, densely populated and housed many working-class Black folk (69% of the population was African American).315 As seen by the 1979 finished highway project, the Buzzard Point neighborhood had been effectively boxed in by the “Inner Loop” highway system.
While the highway was being built in 1959, the Greenleaf public housing complex, including Greenleaf Gardens, Greenleaf Senior, Syphax Gardens, James Creek and Greenleaf Flats, was built.316 Like many government-owned apartment complexes, Greenleaf Senior struggles to maintain habitable living conditions. Residents report issues of rats, mildew, mold and security issues. Some residents complain about the ease of access for family members to enter the building. In Greenleaf Senior, residents are only allowed to have two guests at a time and the guests must sign in every day. This is particularly difficult for seniors who rely on the support of family members. Structural issues also persist. Lead paint and plumbing concerns and complaints are frequent.317 In 2019 there were reports that sewage had leaked into resident’s apartments.318
Insulated from the rest of the city by the Inner Loop, residents at Buzzard Point and Greenleaf have seen little assistance to address structural concerns about the property. In 2020, the redevelopment of Greenleaf had stalled dramatically, with the U.S. Department of Housing and Urban Development rejecting proposals to have private companies invest in the project.319 In 2024, residents were informed of the impending redevelopment, where Greenleaf Senior will be the first building redeveloped. Residents fear potential displacement, as is what had happened in the surrounding neighborhoods of Navy Yard and Waterfront. DCHA has attempted to calm these fears through a “build first” model, where the new property is first built, and then residents may move into the new building.320 The area of Buzzard Point has largely been ignored by developers, meaning the DCHA complex remains affordable to both seniors and families.
315 Perry-Brown, Nena, 2020. Greenleaf Gardens was part of the birth of DC’s urban renewal projects. Greater Greater Washington. Retrieved on July 16, 2024 from https://ggwash.org/view/77050/greenleaf-gardens-was-part-of-the-birth-of-dcsurban-renewal-projects
316 Brown-Perry, Nena. 2020. DC’s Greenleaf public housing complex is set for redevelopment. We will cover what happens. Greater Greater Washington. Retrieved on July 16, 2024 from https://ggwash.org/view/76672/greenleaf-gardens-is-set-for-redevelopmentggwash-will-cover-what-happens
317 Brown-Perry, Nena. 2020. DC’s Greenleaf public housing complex is set for redevelopment. We will cover what happens Greater Greater Washington. Retrieved on July 16, 2024 from https://ggwash.org/view/76672/greenleaf-gardens-is-set-forredevelopment-ggwash-will-cover-what-happens
318 Baskin, Morgan. 2019. DCHA says thousands of units are nearly uninhabitable. Tenants want to know: what’s next?. Washington City Paper. Retrieved on July 16, 2024 from https://washingtoncitypaper.com/article/181681/dcs-public-housingauthority-says-thousands-of-units-are-nearly-uninhabitable-whats-next/
319 Ryals, Mitch. 2020. Greenleaf Gardens redevelopment stall early with failed resolution. Retrieved on July 16, 2024 from https://washingtoncitypaper.com/article/439578/greenleaf-gardens-redevelopment-stalls-early-with-failed-resolution/
320 Lightman, Andrew. 2024. ANC 6D hears Greenleaf redevelopment update. HillRag. Retrieved on July 16, 2024 from https://www.hillrag.com/2023/01/24/anc-6d-hears-greenleaf-redevelopment-update/
However, due to poor management from DCHA and a revolving cast of characters attempting to revitalize the community, residents have grown apathetic.
According to the Community Impact Facilitator of Buzzard Point, residents struggle to build an effective coalition to address building conditions. For example, recently the DCHA Director made attendance to Greenleaf, and attendance was described as “lackluster.” Despite building code violations, redevelopment and community violence, residents of Greenleaf have remained complacent whilst complaining about the situation behind closed doors.
Benning Terrace is a public housing project located between G Street SE and 46th Street SE. With over 274 available apartments and townhouses, Benning Terrace is one of the largest public housing complexes in the District. Also known as “Simple City,” Benning Terrace is infamous for its high concentration of violence, drug use and poverty.
The Benning Terrace property consists of 247 units, though these units are spread across townhomes, apartment units or walk-ups. Of the existing units, 216 units have three bedrooms or more.321 Therefore, Benning Terrace is perfectly suited to support low-income families across the District, which in 2024, is seldom seen.
Like many housing projects in the District, Benning Terrace was meant to house low-income Black residents during the urban renewal process. Benning Terrace is in constant need of additional repairs. In 2018, DCHA found that more than $33 million dollars was needed for repairs, with an additional $3 million dollars every year after that.322
There are severe structural issues with the Benning Terrace property, including:
Waste vent pipes that are deteriorated
Malfunctioning smoke and carbon monoxide detectors
Pest infestations
Cracked or raised concrete sidewalks
Lead paint has been used on balconies, walls, railings and common areas.323
321 District of Columbia Housing Authority. 2018. Benning Terrace. DCHA. Retrieved on August 28, 2024 from https://dcha.us/img/guest_uploads/temp_mP8UB4d5Wo1589636800H97c4xp8vaTyvscBiuDh.pdf
322 Falquero, Eric. 2021. “The reason for my participation is change:” demanding more at Benning Terrace. Street Sense Media. Retrieved on July 19, 2024 from https://streetsensemedia.org/article/demanding-more-at-benning-terrace/
323 District of Columbia Housing Authority. 2018. Benning Terrace. DCHA. Retrieved on August 28, 2024 from https://dcha.us/img/guest_uploads/temp_mP8UB4d5Wo1589636800H97c4xp8vaTyvscBiuDh.pdf
As of 2018, the DCHA has recommended completely demolishing Benning Terrace. In 2021, residents organized to present a demand letter to DCHA, asking for better housing.324 This is particularly impactful for low-income residents in the area, who continue to struggle with structural issues as well as crime in the area. The District should use its available resources to rebuild and repair current DCHA infrastructure.
Ward 8 contains some of the largest housing projects in the District, including Atlantic Gardens Apartments. Located in the Washington Highlands Neighborhood on 4319 3rd Street, Southeast DC, Atlantic Gardens was built in 1948 and consists of 108 apartments.325 WINN Management, the property owner since 1982, primarily serves low-income, Black and Brown residents. With apartments ranging from $305-$1300, Atlantic Gardens is one of the last bastions of affordable housing in the rapidly gentrifying Ward 8.326
Atlantic Gardens, like many other low-income housing complexes in the District, struggles to maintain a quality space for low-income residents. For example, in 2023, residents have reported mold in many of the buildings.327
Building Snapshot:
Located on 2423 14th Street NE in the Brentwood neighborhood, Brookland Manor is one of the largest privately owned housing complexes in the District. Part of the UPO’s Brentwood CIZ, Brookland Manor predominately houses low-income Black residents and faces issues surrounding crime and poverty. Recently the housing complex was centered for one of the largest redevelopment projects in the District, yet was indefinitely postponed after the pandemic. The saga between the tenants association (TA) and MidCity, the property owners, is one of the most well-documented disputes in DC tenant history.
324 Lang, Marissa. 2021. Benning Terrace residents demand action on long-deferred projects from new D.C. Housing Authority director. The Washington Post. Retrieved on August 28, 2024 from https://www.washingtonpost.com/dc-mdva/2021/11/06/benning-terrace-dcha-brenda-donald-demands/
325 U.S. Department of Energy. n.d. Atlantic Gardens Apartments. Better Buildings. Retrieved on July 17, 2024 from https://betterbuildingssolutioncenter.energy.gov/showcase-projects/atlantic-gardens-apartments
326 LowIncomeHousing. 2024. Atlantic Gardens. Retrieved on July 17, 2024 from https://www.lowincomehousing.us/det/200323325-atlantic_gardens
327 Flores, Christian. 2023. ‘I don’t want to have any long-term issues’: SE DC apartment resident says mold has caused health issues. ABC. Retrieved on August 28, 2024 from https://www.wjla.com/news/local/apartment-mold-issues-health-problemssoutheast-dc-bronchitis-hospital-atlantic-gardens-apartments-medical-tenants-management-daughter-mother-maintenancerequests
Plans to redevelop Brookland Manor began as early as 2016. In replace of the 535 units that are currently available at Brookland Manor, MidCity was set to tear down the existing structure and build 1,760 new units.328 Immediately, there was cause for concern as only 373 units were slated for remaining residents to move in. Moreover, many of the current residents remain on Section 8 or alternative housing assistance from the government. If MidCity were to switch to market rates, residents reliant on those services would be priced out.329 There were also some concern that MidCity would try to push people out of the building before demolition, so that they would not have to guarantee reintroducing current residents to the new housing complex.
In response, the Brookland Manor TA campaigned vehemently against the redevelopment project. The TA was particularly upset over the redevelopment plan’s lack of 3-, 4- and 5bedroom units and demanded that all residents had a guaranteed right of return.330 MidCity had argued
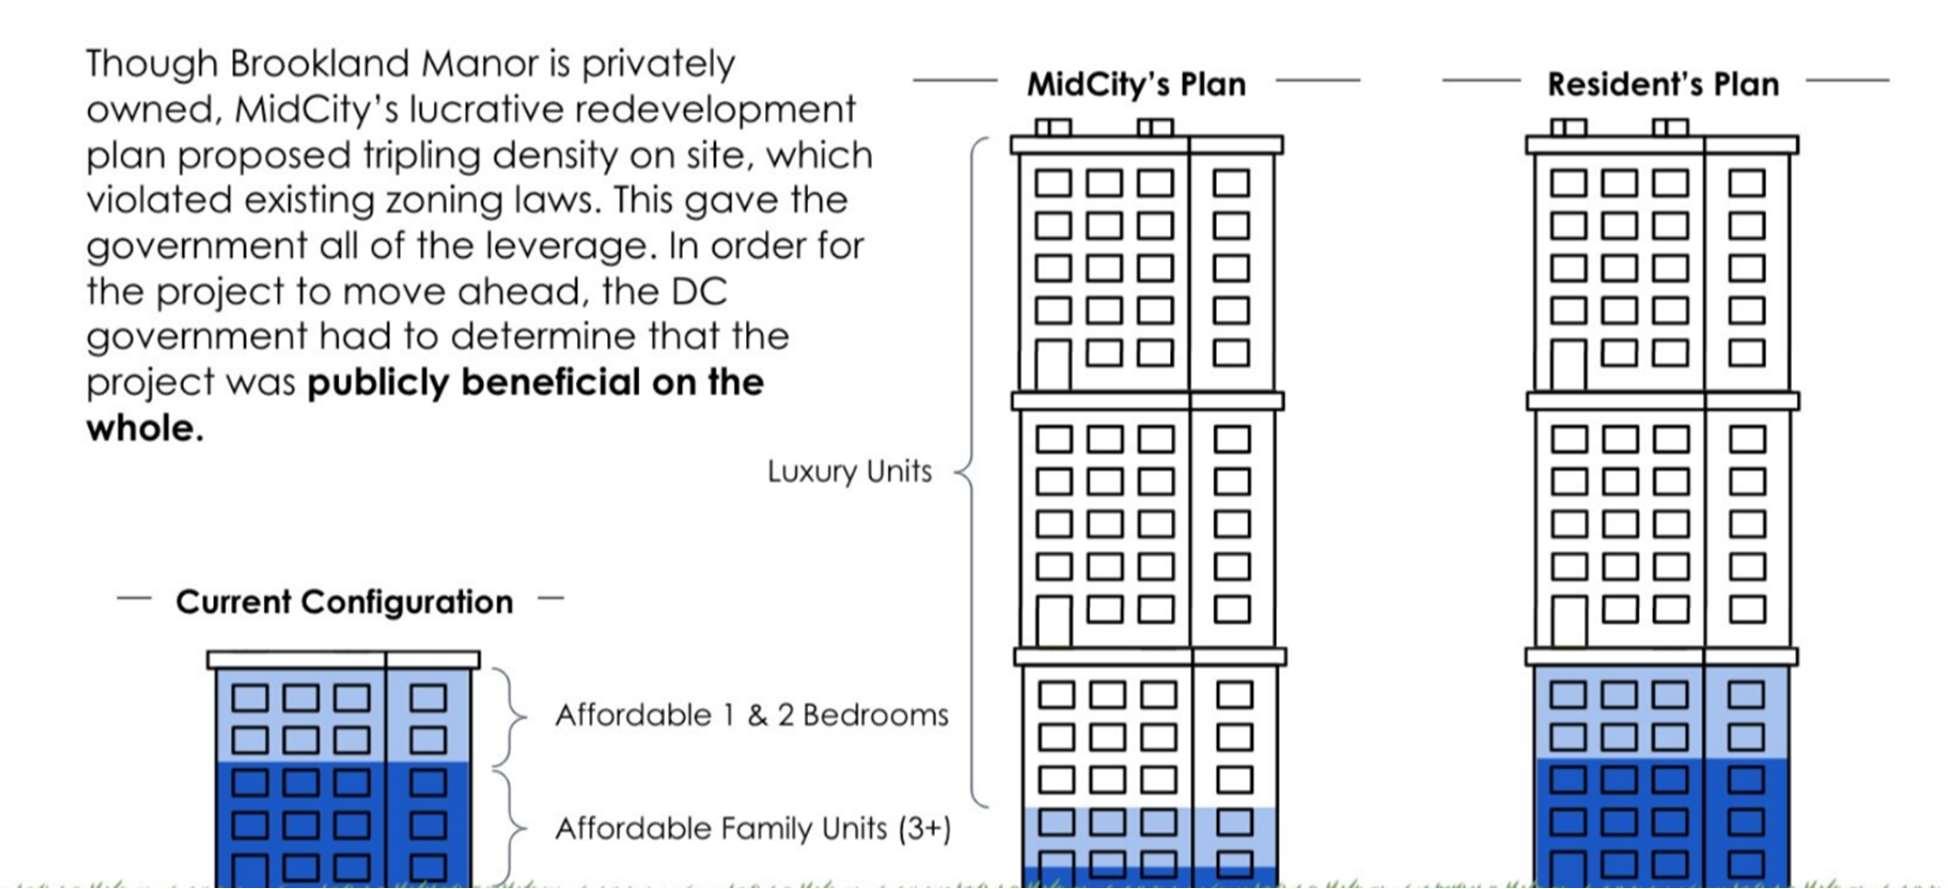
that 3-, 4-, and 5-bedroom apartments had limited occupancy and had alternative uses as a community room or summer camp facility. MidCity did not comment on the guaranteed return yet claimed that they were doing more than enough to address the city’s affordable housing crisis.
328 Neely, Jonahthan. 2017. Brookland Mnaor: A crash course in why housing in DC is so complicated. Greater Greater Washington. Retrieved on July 15, 2024 from https://ggwash.org/view/63156/brookland-manor-a-crash-course-in-why-housingin-dc-is-so-complicated.
329 Neely, Jonahthan. 2017. Brookland Mnaor: A crash course in why housing in DC is so complicated. Greater Greater Washington. Retrieved on July 15, 2024 from https://ggwash.org/view/63156/brookland-manor-a-crash-course-in-why-housingin-dc-is-so-complicated.
330 Brookland Manor Coalition. 2021. Brookland Manor Coalition. Retrieved on July 15, 2024 from https://www.brooklandmanorcoalition.org/
To prevent redevelopment, the TA had sued against MidCity over the zoning rules and regulations of the property. In order to complete the redevelopment, the zoning code would have needed to be overturned. However, in 2021 the Court of Appeals rejected the suit brought forth by the TA.331 While the tenants had fought hard in a difficult battle, they had ultimately come away with nothing. The MidCity redevelopment was underway. However, this ruling was made during the midst of the COVID-19 pandemic. In 2023, MidCity filed for a 2-year extension on the Brookland Manor redevelopment.332 So far, development has seemed to indefinitely stalled.
As tempers cool, Brookland Manor residents face an owner who refuses to fix the building’s many shortcomings. UPO’s Community Impact Facilitator reports that many units in Brookland Manor are infested with mold. Other parts of the building have been torn to pieces by bullet holes. Some residents have started to sleep away from their apartments as the heating system has broken down. By all accounts, the living conditions are deplorable. While there are 535 units, the building has been described as “half-empty” by residents. Both violence in the surrounding community and poor living conditions have exacerbated Brookland Manor’s poor living conditions. “You can tell when something has happened on the weekend, they’ll be sitting on the corner if it’s a good weekend, they’ll be inside if something went down” says the UPO Community Impact Facilitator.
Yet herein lies an issue as complex as the legal disputes between MidCity and the Tenant Association. Both the tenants’ association and MidCity have struggled to assist residents in escaping generational poverty while addressing immediate issues such as building conditions and community violence. “For those remaining at the building, it’s those who cannot afford to move or those who [have criminal affiliations]” says one UPO employee.
Despite having an active tenants’ association, many of the members are in their late 80s. This means that the TA has struggled to connect with younger generations on tenants’ rights. For this reason, TA meetings have limited turnout and therefore limited reach within the community. It has been assumed that the TA does not speak for the entire building community.
In tandem, MidCity has experienced intense turnover. In the past five years, MidCity has hired four property managers, indicating internal turmoil. For a property with 535 units, there are
331 Barthel, Margaret and Truong, Debbit. 2021. Appellate Court Rejects Legal Challenge to Brookland Manor Redevelopment Project. DCist. Retrieved on July 15, 2024 from https://dcist.com/story/21/03/05/appellate-court-rejects-legal-challenge-tobrookland-manor-redevelopment-project/
332 BLDUP. 2023. RIA update. Retrieved on July 15, 2024 from https://www.bldup.com/posts/midcity-files-for-2-year-extensionon-brookland-manor-redevelopment.
only five maintenance technicians, who are presumably overworked. Despite complaints from the tenants, MidCity has not addressed issues surrounding mold, flooding, heating and security.
Third-party resources have also been limited. In what has been described as a “cycle” by a longterm third-party coordinator, organizations attempt to aid tenants before “realizing this is all that they can do” and move out from Brookland Manor. The third-party coordinator fears that UPO may have fallen into the vicious cycle, “This is DC, there are all these resources, and no one uses them.” When prompted, the third coordinator claimed “they don’t trust [organizations like UPO].”
With limited outside help, a tenants’ association with limited reach and a property owner who solely seeks to maintain the status quo until redevelopment begins, the residents of Brookland Manor have developed a strong sense of apathy towards their issues. The Community Impact Facilitator notes that many residents have real, tangible problems that could be addressed, however they do not come forth about the issues. Despite many residents having similar issues, there have been few calls for mobilization and organization. This likely stems from years of disappointment and disgruntled opinion towards third-party organizations, management and the tenants’ association.
Economic opportunity and mobility are at the heart of many issues that UPO customers regularly face. Ideally, each individual born into poverty should be able to achieve economic security through their own successes. Despite this often-refrained concept, data shows that areas of the District experience intergenerational poverty, meaning that a child born into poverty will continue to live in poverty. Recent research has indicated that an individual’s capacity to escape poverty may not be as relevant in achieving economic security as thought. In fact, where an individual was raised may predict the likelihood of them escaping poverty at all.
Growing economic inequality has prompted discussion of an individual’s capacity to achieve economic security. In recent years, the District has seen historic economic growth. The median income within the city has risen each year, and in 2023, the median income increased nearly 11% from 2022. Despite the economic boom, those who fall below the federal poverty line have not seen any significant economic gains. As of 2023, economic mobility in the District is reserved for only the wealthiest residents. High income inequality can be attributed to the influx of wealthy residents, yet this on its own cannot explain the startling decline of economic mobility in the poorer areas of the District.
UPO envisions a city where all residents are self-sufficient and economically secure. However, the opportunities afforded to low-income communities within the District are rather limited without higher (bachelor’s and above) educational attainment. To counteract this trend, policy makers should implement solutions that directly target disparities in public institutions in lowincome areas.
In this report, economic mobility is defined as the capacity for an individual to, due to their own successes, or outside assistance, to see continuous increases in quality of life and income. The outcome of economic mobility is identified, ideally, as economic security—where an individual achieves a stable and satisfactory quality of life. This report seeks quantify the likelihood of achieving economic security if an individual was raised in poverty in the District, as this is often the situation for many UPO customers.
Without certain variables, measuring economic mobility has proved to be a challenge for researchers. Verifying household income across generations has proved near impossible as much of the data is locked behind federal agency privacy concerns. The existing research used in this report comes from the groundbreaking Raj Chetty report about economic mobility released in 2018, which taps into the blacklisted IRS data. Chetty’s research follows a birth cohort from 1978-1983 to 2015, examining their parent’s income as well as the birth cohort’s income at 3137. The data reported on the District of Columbia is sufficient to infer statistical significance.333 Updating the 2015 data is near impossible, as once again the data is behind privacy protection. Other methods will be used to reveal that economic mobility in the District has changed little since the 2018 study was released.
As of 2015 data, if a child was born into a family making less than the 20th percentile nationwide, the child would need to be brought up into a wealthy neighborhood to have a chance of escaping poverty. The graphic above demonstrates the claim that economic mobility is reserved for the wealthy in the District. If an individual was born into poverty (bottom 20th income percentile), they would only have a 11% chance of rising to a high income bracket (top 20th income percentile), if they were to reside in a historically poor area of the city such as Wards 7 and 8. However, if an individual was born into poverty (bottom 20th income percentile) in Wards 3 and 4, the chance they could climb to a high income bracket (top 20th income percentile) could be as high as 42%.
While economic mobility is still possible in poorer areas of the District, achieving economic security is statistically improbable.334 While the research does not account for personal experiences and individual capacity to succeed, controlling the area where an individual is raised offsets behavioral concerns. Panel data, or tracking a unit of observation overtime, has been proved to eliminate potential biases in research. Chetty uses this fact to create a robust dataset for the entire U.S., including the District. More information can be found in Figure 18 (low economic mobility highlighted in pink, high economic mobility highlighted in blue:
333 Chetty, et al. 2020. The opportunity atlas: mapping the childhood roots of social mobility. National Bureau of Economic Research. Retrieved on November 14, 2023 from https://www.nber.org/papers/w25147.
334 Chetty, et al. 2020. The opportunity atlas: mapping the childhood roots of social mobility. National Bureau of Economic Research. Retrieved on November 14, 2023 from https://www.nber.org/papers/w25147.
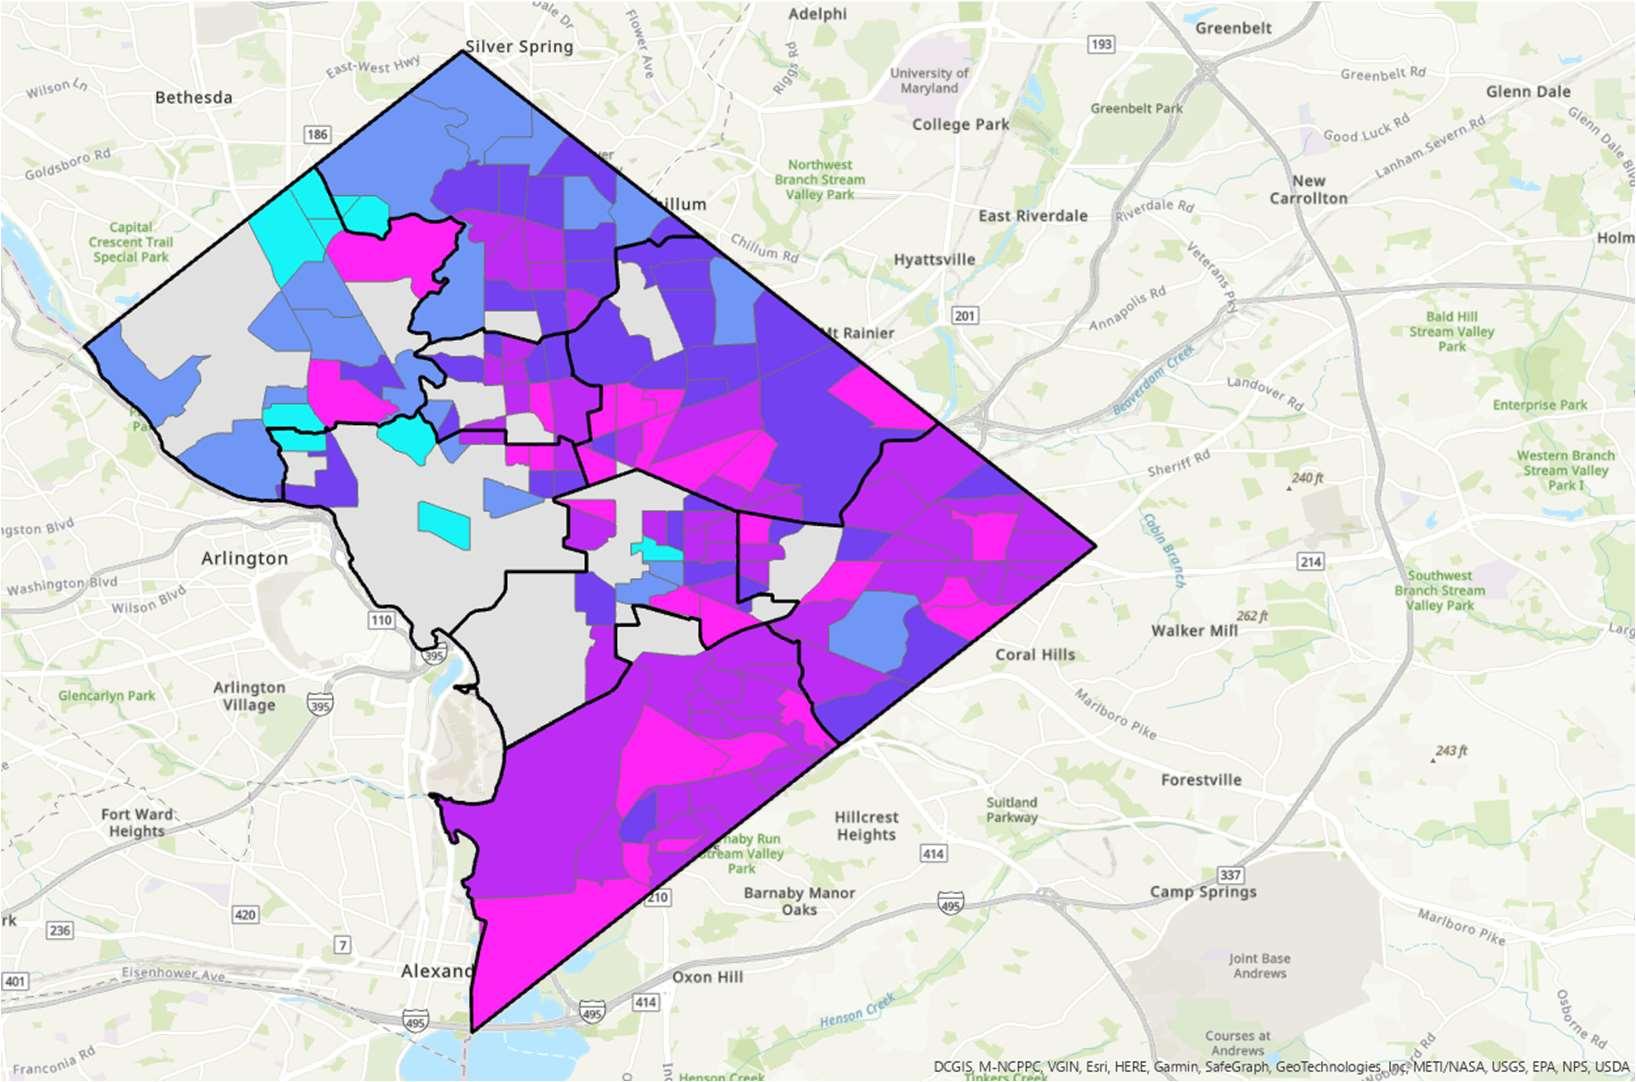
Figure 15: Likelihood of a child born into poverty entering the top 20% of income, Raj Chetty
As seen above, a distinct lack of economic mobility can be found
East of the Anacostia River. In areas of the Northwest, an individual born into poverty has a significantly higher chance than those born into poverty in the Southeast and Northeast. We find that areas of poor economic mobility represent nearly 40% of the District.
If an individual is born into the bottom 20% percentile of national income, there is only a 15% chance that individual will ascend to the top 20% of national income, if the individual was born in D.C. The median, which is the 50th percentile mark in the distribution, indicates that for 50% of the population in D.C., the likelihood of escaping poverty is only 13%.335 Outliers play a significant role in the distribution of the data, shown above. Though economic mobility does exist in wealthier areas of the District, the census tracts to where economic mobility is likely to occur are very rare. The histogram above reinforces the reality that economic mobility for lowincome individuals east of the river is extremely difficult and statistically unlikely, compared to those who were born west of the river.
Additional research was conducted to confirm the findings of this study. Though the likelihood of obtaining personal tax information is next to impossible, other methodologies for calculating economic mobility do exist. UPO currently does not have access to private data sets involving personal income, therefore the research conducted relies heavily on census data.
335 Chetty, et al. 2020. The opportunity atlas: mapping the childhood roots of social mobility. National Bureau of Economic Research. Retrieved on November 14, 2023 from https://www.nber.org/papers/w25147.
To verify that Chetty’s report was still accurate, 2015 ACS data and 2021 ACS data were collected and compared. First, the median income for each census tract in 2015 and 2021 was gathered. From the list of 206 current census tracts, 30 tracts with the lowest area median income were selected, adjusting for inflation. Of the poorest census tracts in the District. All tracts with significant gains to median income (30% or higher income increase from 2015 to 2021) saw significant increases in population growth, indicating economic gains derived from gentrification rather than genuine economic mobility. Census tracts with little population growth (-1% to 1%) saw no economic gains, indicating that economic mobility is still a challenge for many of the low-income residents within the area.336 For the purposes of this report, the research conducted by Raj Chetty remains relevant, though the data is not technically up to date.
The low economic mobility and limited economic opportunities reflect policy failures. Individuals in the Northwest have access to better public policy institutions than those in the Southeast and Northeast. Moreover, historical developments such as redlining and urban renewal directly impacted low-income areas in the Southeast, rather than the Northeast.
Economic mobility is hardest for those who have the fewest means. As demonstrated in the previous section, statistical evidence suggests that economic mobility is substantially harder for those growing up in poorer communities. Even if one were to leave their community, they would still face significantly more strife than those who grew up in well off communities. For this report's purposes, this section covers the historic and modern barriers to entry for economic mobility for low-income residents in the District of Columbia.
Research has shown that many factors inhibit one’s ability to climb the economic ladder: family environment, labor markets, and public policy institutions.337 For residents with low-income in the District, access to labor markets and quality public institutions are often limited. In a 2022 Upward Mobility Report conducted by the Urban Institute and the District government, researchers found that housing access, educational attainment, unemployment rates and labor force participation rates were responsibility for low economic mobility in low-income areas of the District, consistent with existing research.338
336 U.S. Census Bureau. 2015-2021. American community survey 5-year estimates. Table S1701.
337 Smeeding, Timoth. 2018. Multiple barriers to economic opportunity for the “truly” disadvantaged and vulnerable. PubMed Central. Retrieved on October 23, 2023 from https://www.ncbi.nlm.nih.gov/pmc/articles/PMC6095670/
338 Urban Institute. 2022. Upward Mobility Report. Retrieved on November 7, 2023 from https://upwardmobility.dc.gov/sites/default/files/dc/sites/ogag/page_content/attachments/2022-upward-mobility-reportfinal20220629.pdf
The labor market in the District is notoriously competitive. Every year, the Department of Employee Services (DOES) releases “Hot 50 Jobs” or in-demand services in D.C. Of the top 50 jobs, only 7 do not require a bachelor’s or master's degree.339 There are no current occupations on the top 50 list that do not require a high school degree. Of the top 50 high demand jobs for those without a high school diploma or GED, there is no occupation that makes more than $60,000 a year (excluding athletes and artists).340 While the District does offer some programs for adults to achieve their high school education, more often than not, vocational training is necessary for low-income individuals without a GED to achieve economic security. The cost of living in the District continues to rise yearly (evidenced by the growing mean and median income) and for those who have a low-educational attainment, then continuing to live in the District will become increasingly difficult.
These conditions are especially problematic for low-income residents in the District. Of the estimated 13.3% of individuals experiencing poverty in the District and are 25 years or older, only 4.6% have a bachelor’s degree or higher. Those who have not completed a high school education make up 37% of the individuals experiencing poverty.341 The D.C. Public Schools system is ranked 27th, nationally.342 However, poorer performing schools are concentrated in lowincome areas. In 2017, the District Public School System utilized a “star rating”, one star being the poorest performing schools, five stars being the highest. Of the 46 four- and five-star schools, 30 were in located
Figure 16: Number of One Star Ratings, DCPS
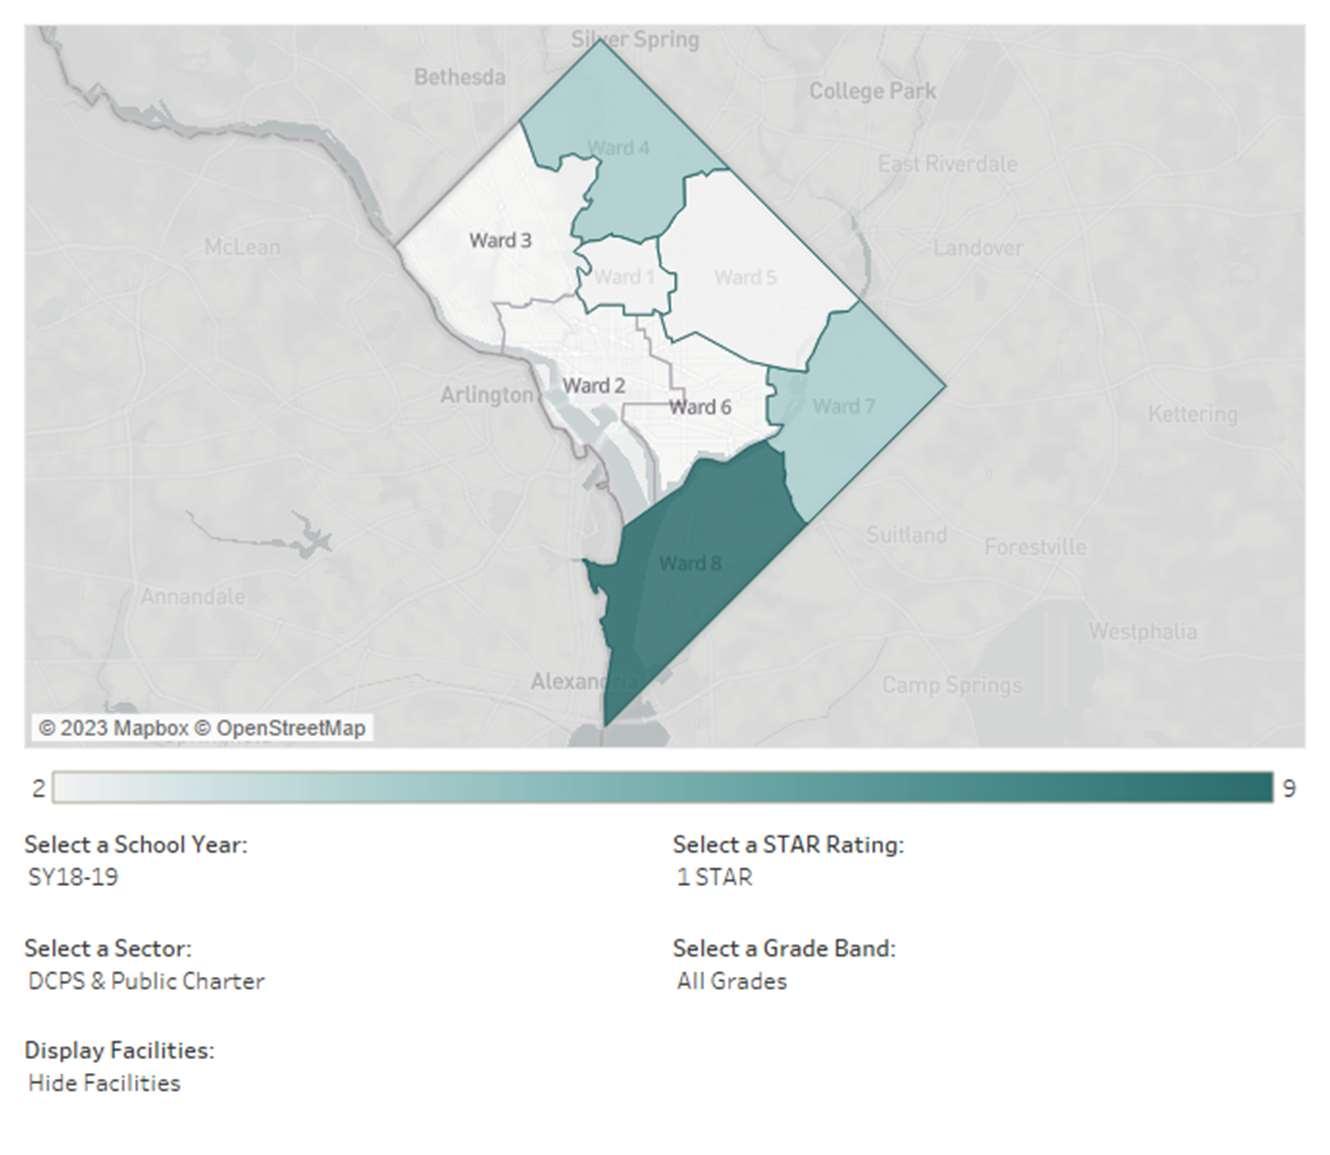
339 Department of Employee Services. 2023. The top 50 high demand occupations. Retrieved on November 14, 2023 from https://does.dc.gov/page/washington-dcs-hot-50-jobs
340 Department of Employment Services. 2023. The top 50 high demand occupations requiring less than a high school diploma. Retrieved on November 14, 2023 from https://does.dc.gov/page/washington-dcs-hot-50-jobs
341 U.S. Census Bureau. 2022. American community survey 1-year estimates. Table S1701.
342 Fredrickson, Sarah. 2023. Maryland, Virginia rank in top 10 best public school systems across US in new report. WUSA9. Retrieved on November 14, 2023 from https://www.wusa9.com/article/news/education/report-top-public-schools-in-unitedstates-maryland-virginia-top-10-wallethub/65-2e547e48-a510-456b-bddec0e724d8f4a1#:~:text=Overall%2C%20Virginia%20public%20schools%20ranked,data%20about%20DC%20Public%20Schools.
Wards 3 and 4.343 Seen in the image below, the highest concentration of “one star” schools are located in Wards 7 and 8. If the best education is in the wealthiest areas, low-income students will continue struggling. If they struggle, low-income students may become disillusioned with education as a pathway to success, limiting their potential income gained in the District.
Moreover, low-income students often struggle to find a stable environment at home. As Chetty’s research indicates, a child born into a low-income neighborhood will struggle escaping poverty. Poverty itself can be emotionally taxing on a child, which may limit their success in school.
Economic inequality is often cited as a significant factor for limiting potential economic opportunities (and thus economic mobility). In 2022, it was reported that nearly 1,500 households in the District held 46% of the wealth.344 Moreover, of the families that hold this level of wealth, 92% are white.345 As mentioned in this report, the District has a significantly large Gini coefficient, which reveals the levels of income inequality within an area. Research has shown that high levels of income inequality have a negative relationship with economic mobility, or in other words, increased income inequality does not lead to higher levels of economic mobility.346 Much of the economic inequality stems from historical developments such as redlining, Jim Crow Laws, and urban displacement. Building intergenerational wealth is directly tied to building economic opportunity and mobility. If wealth cannot be passed down, it is more difficult to provide essential services such as education and healthcare to the younger generation.
The aforementioned historical developments have severely limited the ability for low-income residents to climb the economic ladder. D.C., like many other states in the U.S., has a longstanding history of enforcing structural racism that has led to limited opportunities for lowincome Black residents to enter the middle and upper class. In the previous section, this report outlined that most of the public housing units, historically catering to low-income residents of color, color, were purposely concentrated east of the Anacostia River. This de-facto segregation resulted in high concentrations of low-income residents with limited economic opportunity, a
343 District of Columbia Public Schools. 2019. SY2018-2019 STAR ratings: bringing accountability, demonstrating improvement in DC public schools. Retrieved on November 14, 2023 from https://dcps.dc.gov/sites/default/files/dc/sites/dcps/page_content/attachments/DCPS%20STAR%20Ratings%20for%20School%2 0Year%202018-2019.pdf
344 Williams, Erica. 2022. DC’s extreme wealth concentration exacerbates racial inequality, limits economic opportunity. DC Fiscal Policy Institute. Retrieved on November 11, 2023 from https://www.dcfpi.org/all/dcs-extreme-wealth-concentration-exacerbatesracial-inequality-limits-economic-opportunity/
345 Williams, Erica. 2022. DC’s extreme wealth concentration exacerbates racial inequality, limits economic opportunity. DC Fiscal Policy Institute. Retrieved on November 11, 2023 from https://www.dcfpi.org/all/dcs-extreme-wealth-concentration-exacerbatesracial-inequality-limits-economic-opportunity/
346 Bertotti, Maria, et al. 2017. Correlation between Gini index and mobility in a stochastic kinetic model of economic exchange ScienceDirect. Retrieved on November 14, 2023 from https://www.sciencedirect.com/science/article/pii/S2211379717303236
phenomenon that would reinforce itself over the years. Moreover, federal practices such as redlining have been identified by the Office of Planning as a key contributor to limited economic and wealth-building opportunities within the District. These practices, known in the real estate as “steering” have segregated D.C. by race and income, which further exacerbates the differences in economic opportunities.
Areas that were found to be experiencing “persistent poverty” or a poverty rate above 20% over 20 years according to the U.S. Census Bureau, were found to have elements of real estate steering in the past. Racial steering has increased segregation within cities and has further execrated issues facing low-income communities, as economic opportunities lie elsewhere in the city. According to research conducted by a UPO intern, areas with lower rates of segregation tend to have higher rates of economic mobility. This discovery is consistent with current research about the subject topic.
Economic growth and economic opportunity are directly linked with where an individual is raised and thus the environment that they are raised in. If the resources are not put into aiding low-income families, then these communities will continue to struggle.
For elderly and poor residents in the District, digital literacy and broadband internet access is not always a given. Despite the rapidly increasing pace of technologic innovation in the past decade, many residents, particularly those without consistent broadband internet access, are increasingly left behind. According to Pew Research, an estimated 95% of Americans have broadband internet access.347 While a majority of the District has access to Broadband internet, some demographics still struggle to acquire highspeed internet connections. Broadband access is not distributed evenly within the District. In 2022, an estimated 25% of households do not have broadband internet connections.348 This disproportionately effects Black households located in Wards 5, 7 and 8.349 As of 2022, 22% of District residents making under than $20,000 a year do not have broadband internet access.350
347 Pew Research. 2024. Internet, Broadband Fact Sheet. Pew Research Center. Retrieve on July 24, 2024 from https://www.pewresearch.org/internet/fact-sheet/internet-broadband/
348 Montomery-Patt, Joshua. 2022. Local and federal efforts aim to address the digital divide in the Washington region. Greater Greater Washington. Retrieved on July 24, 2024 from https://ggwash.org/view/83538/local-and-federal-efforts-aim-to-addressthe-digital-divide-in-the-washington-region
349 Montomery-Patt, Joshua. 2022. Local and federal efforts aim to address the digital divide in the Washington region. Greater Greater Washington. Retrieved on July 24, 2024 from https://ggwash.org/view/83538/local-and-federal-efforts-aim-to-addressthe-digital-divide-in-the-washington-region
350 US Census Bureau. 2022. Table S2801.
Unreliable access to broadband internet impedes the ability of some District residents to become digitally literate. According to The Benton Institute for Broadband & Society, there are three primarily factors preventing individuals from obtaining broadband: affordability, infrastructure, device access.351 Without proper internet access and infrastructure, poorer residents may never develop the necessary digital literacy skills to further improve their economic security.
As of June 1st, 2024, an important resource for helping individuals access broadband internet speeds was taken away. Within the District, an estimated 105,000 households are eligible for the Affordable Connectivity Program (ACP), which provides important subsidies for low-income residents to access the internet. Of those eligible, 51,000 people enrolled in the program.352 ACP provided a $9.25 benefit to low-income households across the country. Unfortunately, ACP has ended due to a lack of federal funding and the future of the program is up in the air. A recent survey found that only 30% of District residents are willing to pay over $50 a month for internet access, indicating that 70% of the District is looking for cheaper prices when it comes to internet access.353 Moreover, for about 12% of DC households, $30 a month for broadband is above the affordability threshold set by the National Governor’s Association. For 22.5% of households, $50 a month is above the affordability threshold.354
Though infrastructure is still a primary hurdle for many low-income residents to access the internet, the District has made strides to address the issue. With funding from the Bipartisan Infrastructure Bill, DC has invested over $100 million in addressing infrastructure inequities. The funding provided to the city is meant to address the digital divide and provide low-income communities a pathway to highspeed internet access, increasing their digital literacy to become productive members of the workforce.
The United Planning Organization (UPO) and other organizations offer digital literacy classes for low-income residents, particularly seniors. These digital literacy classes are meant to aid residents in acquiring the tools necessary to achieve economic security.
351 Tepper, Grace. 2023. Working towards digital equity in DC. The Brenton Institute for Broadband & Society. Retrieved on August 5, 2024 from https://www.benton.org/blog/working-towards-digital-equity-dc
352 Tepper, Grace. 2023. Working towards digital equity in DC. The Brenton Institute for Broadband & Society. Retrieved on August 5, 2024 from https://www.benton.org/blog/working-towards-digital-equity-dc
353 Taglang, Kevin. 2024. Eliminating the digital divide in the District of Columbia requires a focus on affordability. Benton Institute for Broadband & Society. Retrieved on August 5, 2024 from https://www.benton.org/blog/eliminating-digital-dividedistrict-columbia-requires-focus-affordability
354 Taglang, Kevin. 2024. Eliminating the digital divide in the District of Columbia requires a focus on affordability. Benton Institute for Broadband & Society. Retrieved on August 5, 2024 from https://www.benton.org/blog/eliminating-digital-dividedistrict-columbia-requires-focus-affordability
Public benefit programs–such as income, food, housing, childcare or healthcare assistance provide vital resources to support the economic security of households with low incomes. These programs are essential given that living-wage jobs –that pay enough to make ends meet--are not available to all, and because many people are not in a position to work at a given time. These essential benefit programs can become a challenge, however, when household income rises due to improved employment or other reasons. That’s because these benefits often phase out quickly, and the combined phaseout of multiple programs can offset a large share of an increase in income, leaving households barely better off. This is known as a “benefits cliff.”
Understanding and addressing the benefits cliff is important to improving the economic security of District of Columbia residents.
Mostpublicbenefitsphaseoutentirelywellbeforefamilieshaveenough incometomeettheirbasicneeds. For example, a family of three receiving TANF income assistance loses eligibility completely when their monthly income reaches just $2,400 a month.355
Benefitreductionsactlikeasubstantialtaxonaddedincome. If a DC family receiving TANF and SNAP benefits increases their earned income from $2,000 to $2,500 a month, the combined impact of payroll taxes and the loss of SNAP and TANF leaves the family just $40 better off. That means that these programs’ rapid phaseouts impede efforts to support economic mobility.356
Someprogramsresultinsuddenlossesofeligibilitywhenincomerises. A parent remains eligible for Medicaid in DC until their income equals 227% of the federal poverty line, or about $59,000 for a family of three. Under Medicaid in DC, recipients pay no premiums or out-of-pocket expenses. Once a parent’s income rises above 227% of poverty, they can get health insurance through DC Health Link, but even with various
355 This is a UPO calculation. The maximum DC TANF benefit for a family of 3 is $751 in FY 2024, retrieved on September 10, 2024 from https://dhs.dc.gov/service/tanf-district-families. The DC TANF benefit formula disregards $160 and two-thirds of any remaining earnings for TANF recipients. Retrieved on September 10, 2024 from the Urban Institute Welfare Rules Database, https://wrd.urban.org/policy-tables
356 This is a UPO calculation.
subsidies, that health insurance could take up as much as 9% of income. 357 That means a family with a modest increase in income could face a big jump in expenses.
Some aspects of the benefits cliff stem from federal policies that the District cannot control. But there are many steps the District can take to re-shape policies and reduce the impact of the benefits cliff, including:
Taking advantage of options within federal programs.
Modifying DC programs that contribute to the benefits cliff
Implementing policies to intentionally offset the federal policies that affect the benefits cliff.
Improving the administration of programs to ensure families get all they are eligible for in a timely manner, including when their circumstances change
These are discussed in more detail below.
Consider a parent with two children who is unemployed and receives TANF cash assistance and SNAP food assistance. If the parent finds a job earning $1,000 a month (essentially half-time at the minimum wage), they will face a reduction in TANF and SNAP benefits and also pay payroll tax on their earnings. However, the new earnings also qualify the family for the federal and DC Earned Income Tax Credit, a tax benefit for workers with low incomes. The combined effect would leave the family with $1,080 more.358 A family in this situation retains all of the impact of their higher earnings because reductions in TANF and SNAP benefits are offset by an increase in the EITC.
However, if the same parent moves from earning $2,000 a month to $3,000, the family’s net income rises just $189, with $811 lost to payroll taxes, declining SNAP and TANF benefits, a decline in EITC benefits, and a requirement that the family pay a share of childcare expenses. If families are able to take advantage of more benefits, the combined impact of the phaseout can be more extreme. Consider a family of three that receives TANF, SNAP, housing assistance, and childcare assistance. If the family earnings rise from $2,000 a month to $3,000 a month, the family’s net income after taxes and benefits would be $126 lower, meaning that the new taxes and loss of benefits was greater than the added earnings.
357 Parents in DC are eligible for Medicaid in DC if their income is below 216% of poverty after a disregard of 5% of their income. This works out to effective eligibility of 227% of poverty. Retrieved on September 10, 2024 from https://dhcf.dc.gov/node/892382
358 The calculations in this section were conducted by UPO based on program eligibility and benefit rules.
These examples are not uncommon experiences for families with low incomes seeking to do better through a job. It highlights the importance of understanding the eligibility rules and benefit formulas in key public benefits and how they affect recipients.
MostPublicBenefitProgramsPhaseOutBeforeFamiliesHaveEnoughtoSupport Themselves
Public benefits are intended to support the economic security of people with low incomes, and it makes sense that program benefits phase out as a household’s income rises and gets closer to being enough to fully meeting their basic needs. However, most assistance programs phase out before families get to that point.
One estimate of the income a family needs to meet its needs is the “household survival budget” from United for ALICE, a project led by the United Way of Northern New Jersey. United for ALICE estimates that a single parent with two school-aged children in DC needs $87,000 to cover its basic expenses.359 By contrast, the federal poverty guideline for a family of three is $25,800 in 2024. That means a DC family of three needs an income close to 350% of poverty to cover basic needs.
Yet nearly all means-tested programs phase out well before that level.
TANF eligibility phases out at $2,413 in monthly earnings, or $29,000 annual income.360
SNAP eligibility ends when a family reaches 200% of the federal poverty line, or $51,860 annual income.361
Medicaid eligibility is limited to parents with income below 227% of the federal line ($59,000 annually), and to children with income below 335% of poverty (86,500 annually).362
The Earned Income Tax Credit for a family with two children phases out when earnings reach $52,900.363
359 United for ALICE Research Center, retrieved on September 10, 2024 from https://www.unitedforalice.org/householdbudgets/dc-metro
360 This is a UPO calculation. The maximum DC TANF benefit for a family of 3 is $751 in FY 2024, retrieved on September 10, 2024 from https://dhs.dc.gov/service/tanf-district-families. The DC TANF benefit formula disregards $160 and two-thirds of any remaining earnings for TANF recipients. Retrieved on September 10, 2024 from the Urban Institute Welfare Rules Database, https://wrd.urban.org/policy-tables
361 DC uses “Broad-based Categorical Eligibility” to determine eligibility for SNAP. Under this policy, the SNAP income eligibility level is 200% of poverty. Retrieved on September 10, 2024 from https://www.fns.usda.gov/snap/broad-based-categoricaleligibility#:~:text=Broad%2Dbased%20categorical%20eligibility%20(BBCE)%20is%20a%20policy%20in,effort%20(MOE)%20fund ed%20benefit.
362 362 Parents in DC are eligible for Medicaid in DC if their income is below 216% of poverty after a disregard of 5% of their income. This works out to effective eligibility of 227% of poverty. Retrieved on September 10, 2024 from https://dhcf.dc.gov/node/892382. Children are eligible if family income is under 319% of poverty after a 5% disregard, which works out to an effective eligibility limit of 335% of poverty. Retrieved on September 10, 2024 from https://dhcf.dc.gov/service/infants-children-0-20
363 Congressional Research Service, The Earned Income Tax Credit (EITC): How It Works and Who Receives It, retrieved on September 10, 2024 from https://crsreports.congress.gov/product/pdf/R/R43805
There are many affordable housing programs, with varying eligibility rules. Under the federal housing choice voucher program, a family of three in DC loses eligibility at $69,650.
A DC family of three must have income below $77,500 to qualify for childcare assistance, or 300% of poverty. Once a family becomes eligible for subsidized childcare, they remain eligible until their income reaches $107,000.364
The phase out of public benefits at relatively modest income levels often reflects a benefit formula that reduces benefits quickly as earnings rise. Researchers sometimes refer to the phaseout as an “effective marginal tax rate,” because the loss of benefits tied to an increase in income has the same effect as an income tax. For example, federal SNAP benefits phase out at a rate of between 24% and 36% of earnings. This means that an extra $100 in earnings would result in a $24-$36 reduction in SNAP benefits, leaving the recipient $64-$76 better off. This is the same as if the income were subjected to an income tax rate of 24%-36%.
In many cases, the phaseout rates of public benefit programs are far higher than federal income tax rates. For example, a single parent faces a federal income tax rate of 12% for income between $16,000 and $63,000, and a rate of 22% for income between $63,000 and $100,000.365
By contrast, public assistance programs in DC often phase out in ways that create much higher effective tax rates.
In DC, the formula for TANF phases out benefits at a rate of $1 for every $3 of earnings above $160 a month.366 For families with earnings in the phaseout range, that is a 33% rate.
Federal SNAP rules allow recipients to keep the maximum benefit as income rises, in part based on whether they have expenses such as childcare that can be deducted from their countable income. Once income reaches the phaseout point, SNAP benefits phase out at either 24% or 36% of earnings. (The actual rate depends on whether the recipient is able to claim a deduction for high housing costs.)
The Earned Income Tax Credit benefit formula has a little more complexity. Families with no earnings do not qualify for any EITC benefit. Then as their earnings rise, the
364 Retrieved on September 10, 2024 from https://osse.dc.gov/childcaresubsidyfaq
365 Federal income tax rates for a head of household for tax year 2023, retrieved on September 10, 2024 from https://www.irs.gov/filing/federal-income-tax-rates-and-brackets
366 The DC TANF benefit formula disregards $160 and two-thirds of any remaining earnings for TANF recipients. Retrieved on September 10, 2024 from the Urban Institute Welfare Rules Database, https://wrd.urban.org/policy-tables
EITC equals a specified percentage of earnings – such as 40% of earnings for a family with two children. This is a rare instance where the size of a means-tested benefits gets larger as earnings rise, rather than phasing down. As earnings continue to rise, the EITC starts to phase out at a specified level.
For a family with two children, the federal EITC equals 40 percent of earnings from $0 to $16,510, resulting in a maximum credit of $6,604. A family with two children remains eligible for the maximum credit until earnings reach $21,560, and then the credit amount phases out at a rate of 21% of earnings above that. For families with earnings in the phaseout range, this is the same as a 21% income tax rate.367
Note that DC has an Earned Income Tax Credit that is being expanded over the next few years, when it will be 100% of the federal EITC. For the 2024 tax filing season, the DC EITC equaled 70% of the federal credit.368 While this provides an important benefit, it also means that the federal and DC EITC alone result in a 36% loss of benefits as earnings rise in the phaseout range.
In subsidized housing programs for residents with very low incomes, their rental contribution is set at 30% of their income. This means that a $100 increase in income results in a $30 rent increase. This is the same as a 30% phaseout of the housing subsidy.
The DC childcare subsidy program charges a co-pay on a sliding scale fee. For example, a parent with two children in care pays about $25 a month if their income is just above 100% of poverty, and $125 a month if their income is just above 200% of poverty. The increase in co-pay between these two income levels works out to about 5% of the earnings increase between 100% and 200% of poverty.369
This suggests that the phaseout rate of multiple programs – TANF, SNAP, housing, and the EITC – is higher than the income tax rate a family at the same income level would pay. When
367 Congressional Research Service, The Earned Income Tax Credit (EITC): How It Works and Who Receives It, retrieved on September 10, 2024 from https://crsreports.congress.gov/product/pdf/R/R43805
368 Retrieved on September 10, 2024 from https://eitc.dc.gov/#:~:text=The%20District%20of%20Columbia%20Earned%20Income%20Tax%20Credit%20(DC%20EITC)&tex t=For%20tax%20year%202023%2C%20the,70%25%20of%20the%20federal%20EITC.
369 DC Office of the State Superintendent of Education, Fiscal Year 2023 Slide Fee Scale. Retrieved on September 10, 2024 from https://osse.dc.gov/sites/default/files/dc/sites/osse/publication/attachments/FY23%20Sliding%20Fee%20Scale.pdf
families receive multiple benefits that have notable benefit phaseout rates, the full impact of the benefits cliff described in the examples above is understandable.
In some cases, families receiving public benefits can lose benefits in a substantial way when income reaches a certain threshold, rather than phasing out slowly. This is truly a benefit “cliff,” while benefit phaseouts are often a steep slope
Medicaid: This cliff effect happens most notably under Medicaid. When DC residents are eligible for Medicaid, they receive free health insurance and have no co-pays or other expenses for their health care. When their income rises above the eligibility threshold –227% of poverty for parents, for example – they lose their health insurance entirely. At that point, they can seek health insurance through DC Health Link, the healthcare exchange, and they can qualify for financial assistance for both premiums and co-pays or deductibles, but the subsidies do not fully cover those costs. The tax credits and costsharing are intended to limit health expenses to 9% of income. While this is substantial help, it still means that families can face a sudden transition from having no health expenses to having health insurance expenses that take up a notable share of their budget. For a family of three, this affects parents when income rises above $55,000.
SNAP: In DC, SNAP eligibility ends at 200% of poverty. (This is the highest possible level under federal law.) For many families, SNAP benefits would phase down to zero by this income level. However, for some families with large housing or childcare expenses, which are deducted from income when counting income for SNAP benefit determinations, they can still be eligible for SNAP at income just below 200% of poverty. They lose all of their benefits if their income rises above 200% of poverty.
Childcare: Families in DC do not lose eligibility for child care until their income reaches $107,000, for a family of three, more than four times the poverty line. While a family at this income level may still be challenged by the high cost of childcare, this phaseout happens after a family’s income is above the “household survival budget” amount.
HousingAssistance: A family of three becomes ineligible for a housing voucher when their income reaches roughly $70,000. At that income level, the family’s subsidized rent expense would be $1,750. It is likely that a family needing to find new housing would face a large jump in combined housing and utility costs.
TIMINGCLIFF:TaxCreditsCanPartlyOffsettheLossinPublicBenefitsbutOften AreNotAvailableuntilMonthsafterTheyAreNeeded
Most public benefits are provided in an ongoing way – such as monthly – at the time that a family is eligible and in need. Tax credits, on the other hand, are paid out when a family files a tax return in the next year after. For example, families eligible for the EITC based on their 2024 income will get the benefit in 2025 when they file a tax return. This means that tax credits are not fully able to offset the loss of other public benefits, such as SNAP, that can happen fairly quickly after a family’s income rises. At that point, they can get the 2024 benefit in one lump sum or have it spread out over the following 12 months. In either case, the EITC is not immediately available when a family’s earnings rise and other benefits start to phase out.
The benefits cliff is a complex issue: it reflects the combined impact of multiple benefit programs, some defined entirely by the federal government and some under control of the DC government. More generally, public benefit programs typically have been designed to phase out entirely at income levels when families are still not able to meet their basic needs on their own.
The District already has taken many to reduce the impact of the benefits cliff and support the economic security of families with low incomes.
The District has eliminated asset limits in SNAP, which means families cannot be cut off simply because they have a modest amount of savings.
Within SNAP, DC has taken options that enable recipients to be eligible until their income exceeds 200% of poverty, while in some states, SNAP eligibility ends when income exceeds 130% of poverty. DC also has taken the federal SNAP option to extend a family’s SNAP benefits for 5 months – with no reduction – when they leave TANF due to higher earnings.
DC’s Medicaid eligibility is high – 227% of poverty for adults and 335% of poverty for children and people who are pregnant, the highest in the nation.
As noted, the childcare subsidy program is open to families with income below 300% of poverty, and families remain eligible until their income reaches over 400% of poverty.
FurtherStepsDCCanTaketoAddresstheBenefitsCliff
TANF: The District has broad latitude to set the benefit level and phaseout formula in TANF. Currently, DC’s TANF program disregards the first $160 in earned income and then
1/3 of earnings above that. This results In TANF benefits phasing out for a family of three with monthly earnings of $2,400.
DC could modify the TANF program to disregard more than $160 of earnings completely, and to reduce the phaseout rate below 33%.
DC also could provide a transitional grace period when a parent gets a job where there is no reduction in benefits. The transition period could be up to a year to enable parents to adjust to their job before facing a loss of benefits.
The District could use TANF to provide periodic payments to all families, such as an annual payment in July or August for back-to-school expenses. These one-time payments are not counted as income toward other benefits. The District has done that in the past but does not currently do so. These one-time payments would not specifically address a benefits cliff, but they would support the overall well-being of TANF families, including those whose basic benefits are falling due to higher employment income.
ChildCare: The co-pays that DC requires parents to pay are low relative to the cost of child care, but for a parent going to work, they can take up to 5% of their new earnings. At a time when other public benefits are phasing out, and when overall family income is still too low to meet all basic needs, DC could eliminate co-pays for families. The co-pays currently start when a family’s income exceeds 100% of poverty, a very low level.
Healthcare: One of the largest cliffs in DC is when a parent transitions from Medicaid to DC Health Link due to higher employment, with families going from no health care expenses to expenses that equal 9% of income. The District could consider subsidies to help cover health care costs for people who lose Medicaid eligibility – covering the gap between federal subsidies available to people in this situation and the full costs of health insurance -- and it actually has a recent model for doing so. In 2024, the District used funds for its childcare Pay Equity Fund to cover the health insurance premium costs for childcare teachers who lost Medicaid eligibility and seek health insurance through the DC Health Link Exchange.
The District could apply this approach as a time-limited transitional benefit when parents lose Medicaid.
The District could also maintain it as a permanent subsidy for families with incomes above Medicaid eligibility – 227% of poverty – and an income level sufficient to meet a family’s basic expenses
TaxCreditre-design: Currently, the DC Earned Income Tax Credit is administered as a match of the federal EITC. This makes it easy for the DC EITC to operate, but it also means that the phase-out rate for the federal EITC – up to 21% -- is nearly doubled when the DC EITC is considered. To address this, the District could re-design its EITC so that the DC credit starts phasing out only after the federal credit has fully phased out.
ChildSupport: Under current law, if a family currently receives TANF assistance – or has received it in the past – any child support they receive is kept by the District and federal governments to effectively repay any TANF benefits the family receives. In the District, a family can keep $150 of monthly child support, but only if it is paid in the month it is due.370 Beyond that, the IRS captures tax refunds for any tax filer who has child support debt, but rather than passing it on to families, the tax refund is returned to the District and federal government for families currently or previously on TANF.
Some states have started to take a different approach. Most notably, Illinois adopted legislation to ensure that 100% of child support payments and tax refunds intercepted for child support debt are passed on to families.371 The District could also take this approach. While this reform does not address how a public benefit phases out, it is a change in public benefit rules that help families keep more of their benefits.
370 Office of the Attorney General of the District of Columbia, retrieved on September 10, 2024 from https://oag.dc.gov/150-passthrough#:~:text=When%20a%20parent%20makes%20payments,the%20custodial%20parent%20(CP).
371 Southern Illinois Now, Illinois child support pass-through payment rule change takes effect this month, retrieved on September 10, 2024 from https://southernillinoisnow.com/2024/07/24/child-support-pass-through-payment-rule-change-takes-effect-thismonth/#:~:text=All%20families%20who%20are%20currently,passed%20through%20to%20the%20family.
For the 2024 Community Assessment Survey, UPO utilized mail-in surveys, flyer distribution and email survey distribution. Survey results collected through flyers and email distribution are not statistically representative of the District of Columbia. Instead, it primarily comprised former UPO customers and individuals living in communities where UPO has a strong presence. The mail-in survey is the most statistically representative sample of the District.
The average respondent to UPO’s 2024 Community Assessment survey is an unemployed single Black female between the ages of 35 and 44, making less than $10,000 a year. The typical respondent has completed their high school diploma or GED. A majority of survey respondents are living alone and are paying rent, with the average cost of rent being less than $800 a month. Of the total respondents, 32% had utilized UPO services in the past.


18: Survey Response: Gender

Figure 19: Survey Response: Gender by Age
The Community Assessment results skewed heavily towards female respondents. In all wards, except for Ward 3, individuals identifying as female responded at a much higher rate than identifying males. This is partially explained census data. In 2022, there were more female identifying persons in the District than identifying males.372 The reason for the disparity between females and males responding to the survey could be that older females were more likely to respond to the survey than older males. Moreover, as 1/3 of the respondents used the mail-in option, the survey distribution method could have self-selected older identifying females in the District.


Figure 21: Survey Response: Marital Status


The marital status of UPO survey respondents was predominately single. While married individuals made up a strong minority of respondents, the vast majority of residents indicated that they are currently out of relationships.


Figure 22: Survey Response: Race
While the total percentage of the Black population in the District continues to fall year after year due to systemic issues surrounding housing, UPO was still able to reach a majority of Black respondence rate. UPO mainly targeted areas experiencing high levels of poverty, indicating that
poverty and race are directly correlated. The Literature Review performed in this report indicates as much.

LESSTHANHIGHSCHOOLGRADUATE
EARNEDMASTER'SDEGREE
EARNEDBACHELOR'SDEGREE
EARNEDASSOCIATE'SDEGREE


CompletedHighSchoolDiploma


CompletedTechnical/Vocational School

Earnedassociate'sdegree

Earnedbachelor'sdegree

Earnedmaster'sdegree

LessthanHighSchoolGraduate
A majority of survey respondents have attainted their high school diploma or GED. Even though Wards 7 and 8 residents primarily responded to the survey inquiry, they are overrepresented in achieving their high school diploma. For example, a greater number of residents in Ward 5 noted they had achieved their bachelor’s degree, despite responding at a slower clip than Ward 8 residents.
$150,000-$199,999$200,000+


Black respondents comprised the vast majority of respondents in the 2024 Community Assessments. However, even though they responded at a much higher rate than white individuals, white individuals were overrepresented in higher brackets of annual income. For example, there were more white individuals making over $200,000 a year than Black
individuals. White and Black individuals who made between $100,000 and $149,999 a year responded at an equivalent rate.
26: Survey Response: Income by Ward
Lessthan$10,000
$75,000-$99,999
$50,000-$74,999
$35,000-$44,999
$25,000-$34,999
$200,000+
$150,000-$199,999
$15,000-$24,999
$100,000-$149,999
$10,000-$14,999
While the District has seen great increases in wealth over the last two decades, poverty is still a systemic and major problems in Wards 5, 6, 7 and 8. This is reflected in the graph above, as
Wards 1, 2, 3, and 4 have a more uniform distribution, even as the survey primarily focused on past UPO customers and areas experiencing high levels of poverty.

$150,000-$199,999$200,000+
$100,000-$149,999
$75,000-$99,999
$50,000-$74,999
$35,000-$49,999
$25,000-$34,999
$15,000-$24,999
$10,000-$14,999
EMPLOYEDFULL-TIME
EMPLOYEDFULL-TIME
UNEMPLOYED
EMPLOYEDFULL-TIME
EMPLOYEDFULL-TIME UNEMPLOYED
UNEMPLOYED
EMPLOYEDFULL-TIME
UNEMPLOYED
EMPLOYEDFULL-TIME
UNEMPLOYED
EMPLOYEDFULL-TIME
UNEMPLOYED
EMPLOYEDFULL-TIME
UNEMPLOYED
EMPLOYEDFULL-TIME
UNEMPLOYED
EMPLOYEDFULL-TIME
UNEMPLOYED LESS THAN$10,000
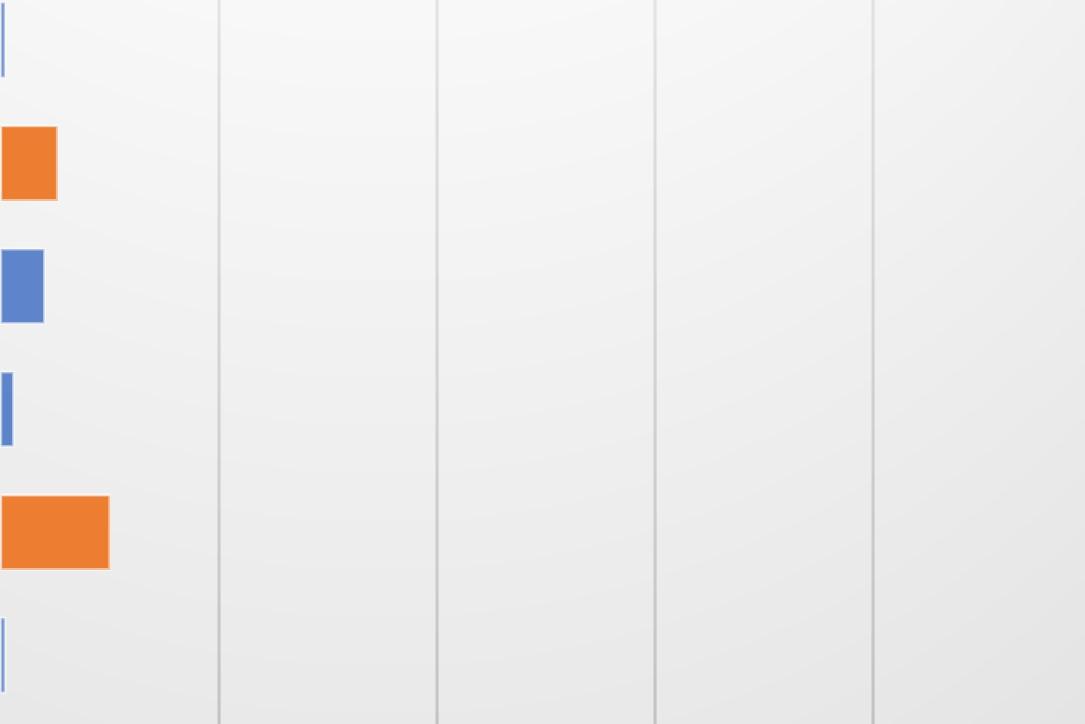


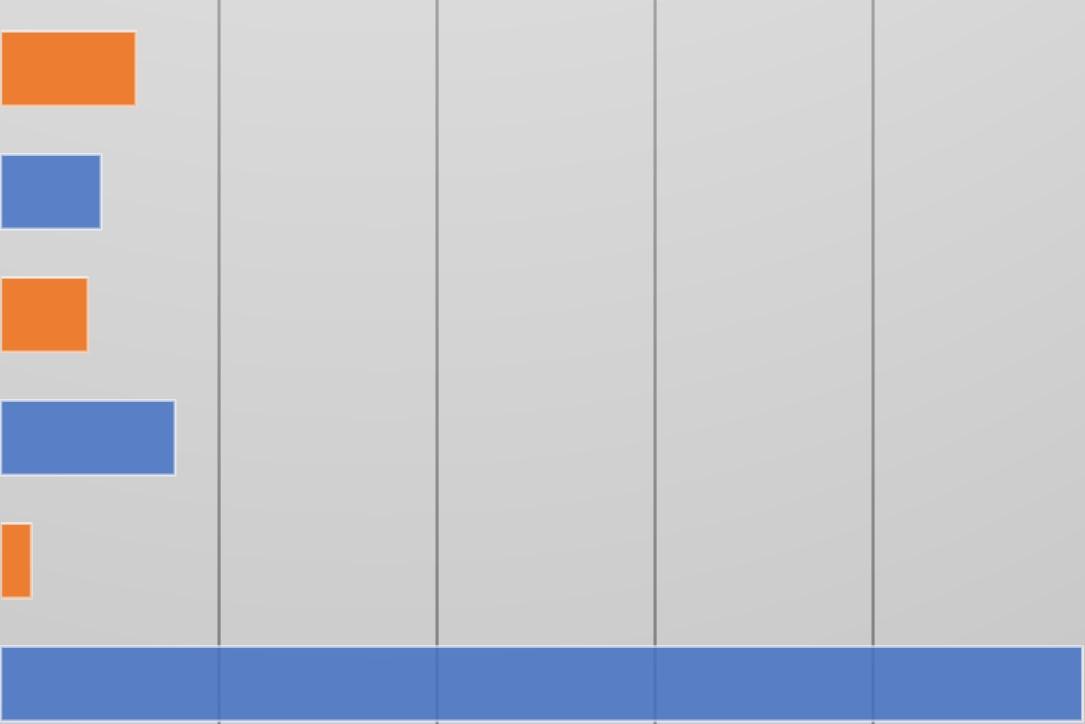


27: Survey Response: Income by Employment Status
As expected, those who are employed tend to take more home in annual income than their unemployed counterparts. However, a surprising number of individuals are employed full time yet still make less than a livable wage in DC (a livable wage defined by the estimated $70,000 required a year to afford a studio apartment in DC using only 30% of annual income). There were also a surprising number of responses indicating that an individual was employed full time and was making less than $35,000 a year. For reference, an individual making minimum wage in the District and working 40 hours a week, for 52 weeks, is expected to make $36,400 before tax. To make less than this wage implies that some DC residents are stretched for time with other responsibilities. It would be difficult, for instance, for a single mother raising children in the District would be able to work 40 hours a week for 52 weeks straight.
The correlation between income level and education level has been well documented. The 2024 Community Assessment confirms this, as a majority of the respondents who have an income level of less than $10,000 a year had achieved their GED or high school diploma. Not a single
individual who solely achieved this feat was making more than $100,000 a year, according to the survey.
Less than High School Graduate
Earned master'sdegree
Earnedbachelor'sdegree
Earnedassociate'sdegree
CompletedTechnical/VocationalSchool
Completed High School Diploma


28: Survey Response: Education by Race
Despite Black respondents making up a majority of the results in the 2024 Community Assessment, Black respondents, by proportion, are less likely to have a masters degree than white individuals. This reflects a major disparity in both education and individual economic security.

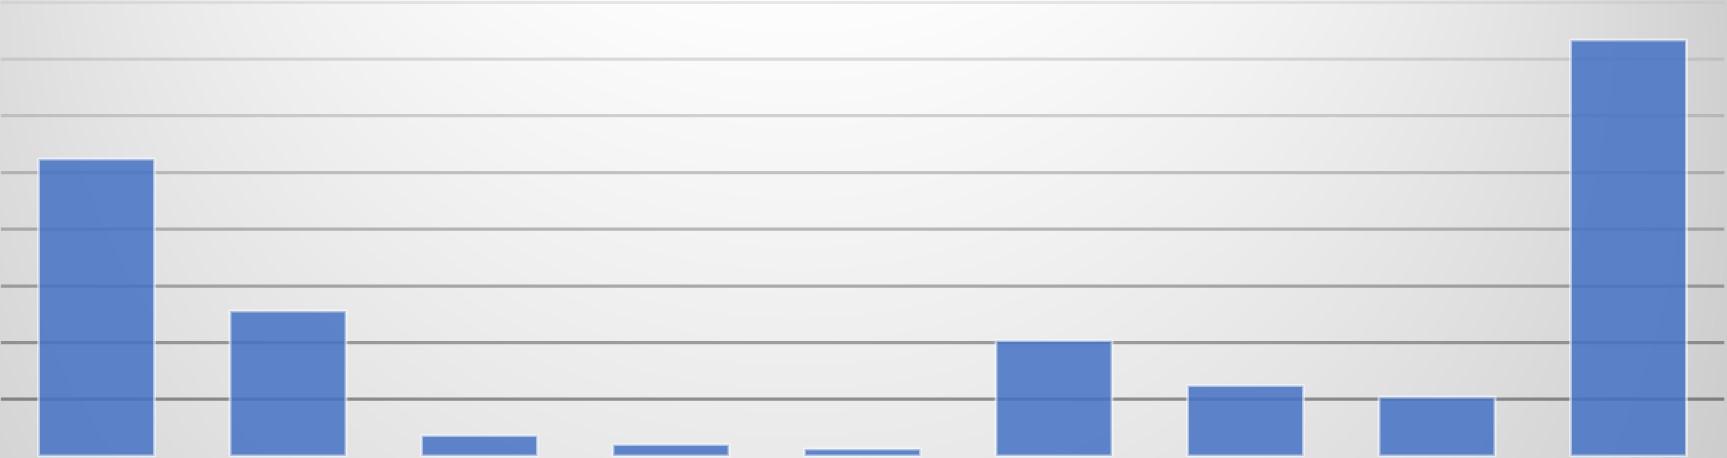

31: Survey Response: Household Situation
The vast majority of respondents have been living alone and paying rent. This is result is consistent with other large surveys conducted in the District. By and large, DC is primarily inhabited by renters. Through further analysis, UPO has found that homeowners without a mortgage and homeowners paying a mortgage are significantly more likely to have higher annual incomes than renters. This too, is consistent with other national and local studies. It should be highlighted the importance of affordable housing options for renters. For example, of the 362 individuals living alone and paying rent, 150 individuals were making less than $10,000 a year. Moreover, of the 266 individuals who earn less than $10,000 a year, 191 pay somewhere between $0-$799 in rent per month. With rents increasing across the District, it is important to maintain and improve affordable housing supply for low-income residents.

$10,000-$14,999$15,000-$24,999$25,000-$34,999$35,000-$44,999LESS

$800-$999
$2,000+
$1,800-$2,000
$1,500-$1,799
$1,200-$1,499
$1,000-$1,199
$0-$799
$800-$999
$2,000+
$1,800-$2,000
$1,500-$1,799
$1,200-$1,499
$1,000-$1,199
$0-$799
$800-$999
$2,000+
$1,800-$2,000
$1,500-$1,799
$1,200-$1,499
$1,000-$1,199
$0-$799
$800-$999
$2,000+
$1,800-$2,000
$1,500-$1,799
$1,200-$1,499
$1,000-$1,199
$0-$799
$800-$999
$2,000+
$1,800-$2,000
$1,500-$1,799
$1,200-$1,499
$1,000-$1,199
$0-$799
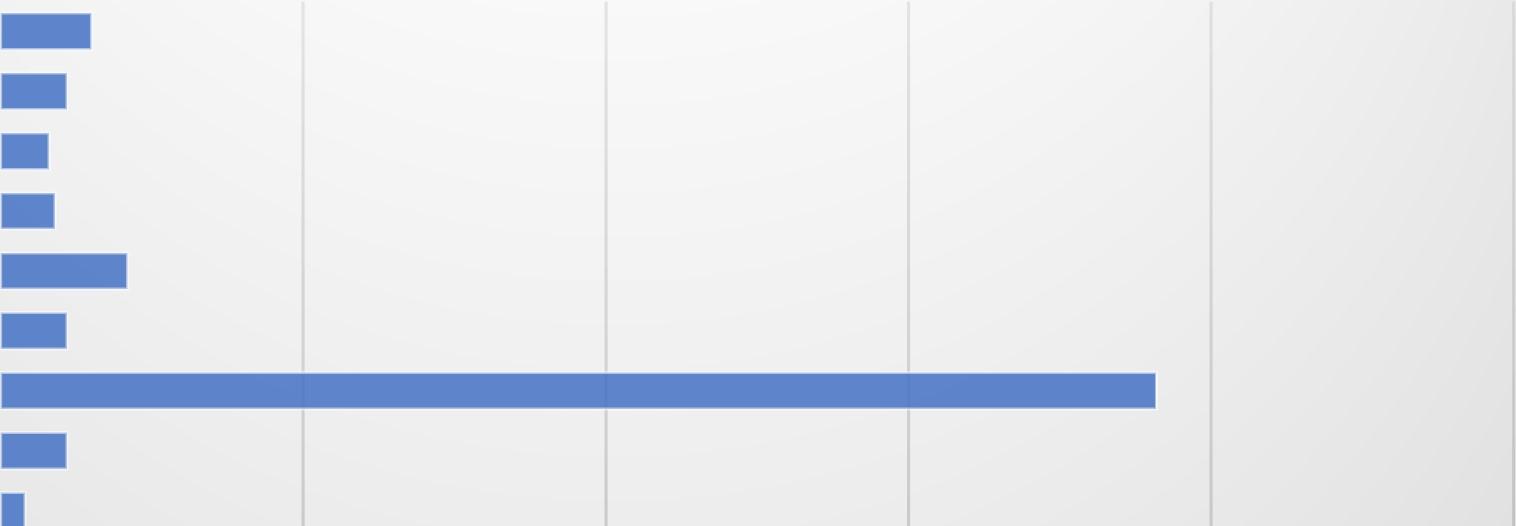


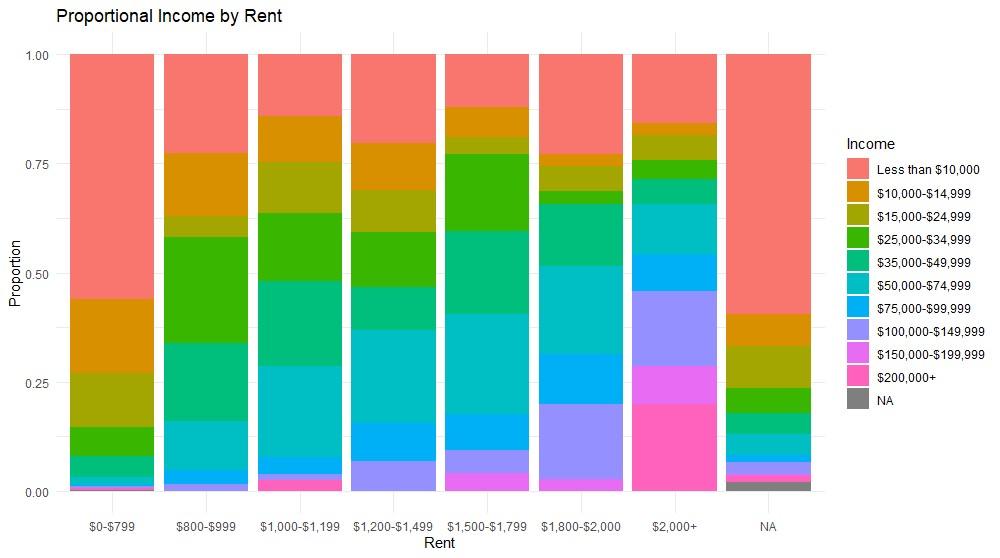
Figure 34: Survey Response: Rent by Income
Paying rent at the end of every month continues to be a major struggle for low-income residents residing in the District. Not only is the ongoing housing crisis a failure of maintaining the housing supply, but a failure of resource allocation where low-income residents are the biggest victim. Despite this, the 2024 Community Assessment Survey indicates that for individuals making less than $10,000 a year, just over 50% are paying less than $800 a month in rent. Why is this? The large percentage of individuals making less than $10,000 a year paying less than $800 a month is likely due to the high number of individuals surveyed living in public housing. Wards 7 and 8, which are overrepresented in UPO’s survey sample, have 28,152 units owned by the District Housing Authority.373 Moreover, UPO was able to survey many unhoused individuals, who often have low-incomes and do not pay rent.
In addition, there is a large proportion (25%) of individuals making less than $10,000 are paying $1,800-$2,000, which is unsustainable for low-income residents. While many of the respondents are able to pay cheap rents through public housing support, a large minority of
373 Housingdc. 2024. A message from directors Polly Donaldson & Andrew Trueblood. DCHA. Retireved on September 4, 2024 from https://housing.dc.gov/page/about-initiatives
individuals do not have the income to continue to live in their homes. Thus, the District government should allocate more resources
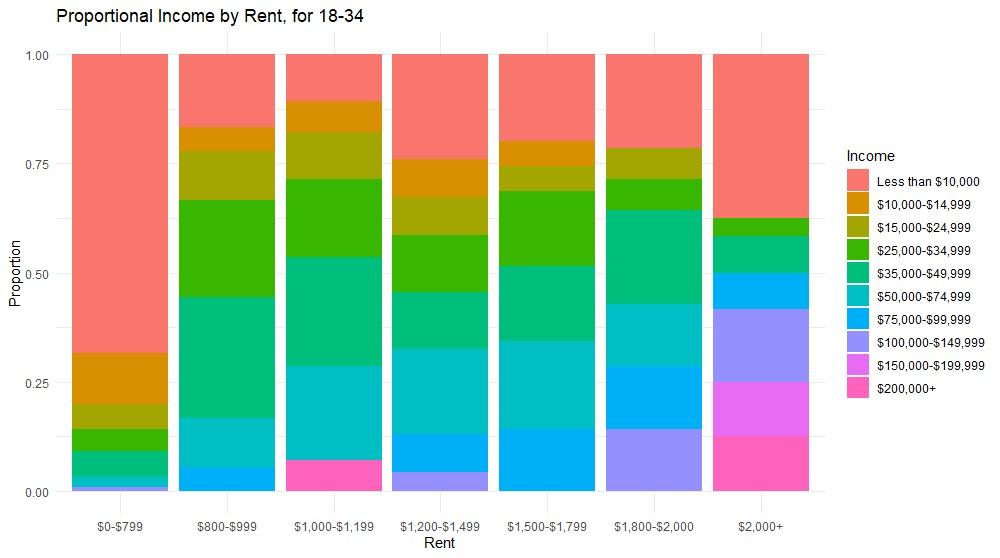
If older adults (35 years and above) are removed from the survey response, the proportion of rent payments varies. Young adults (18-34) that are making less than $10,000 a year are far more likely to pay $2,000 a month in rent payments. While the proportion of individuals making less than $10,000 a year, paying less than $800 dollars a month does increase, the increase in $2,000 monthly rent payments is cause for alarm. This increase is likely due to the District’s inability to provide affordable housing for low-income residents, where individual resources do not match the current state of the rental market stock. There is an evident mismatch between who is able to secure affordable housing, and who isn’t. This is especially damaging for young adults, who already struggle to achieve economic stability.


Yes,throughhealthcare.govorDC HealthLink
Yes,throughMedicaid/Medicare
Yes,throughmyemployerormy spouse'sorrelative'semployer (blank)


Other ComplicationsduetoLongCOVID-19

Cancer

HIV+/AIDS

Alcohol/SubstanceAbuse

VisionImpairmentorBlind

HearingImpairmentorDeaf

PhysicalDisability

LearningDisability

MentalIllness

Diabetes

Asthma

HighBloodPressure

"Ifeelincludedinthedecisionsofwhatmy neighborhoodwouldlooklikeinthefuture"


Agree
Disagree
StronglyAgree
StronglyDisagree
Uncertain
Figure 38: Survey Response: Future of the Neighborhood Residents across the District were more or less uncertain about their voice in future neighborhood developments. While 34% of residents indicated that they did not feel included, 35% of residents felt they were. The resulting statistics may be a reflection of the current split between white and Black residents.
While both white and Black residents were likely to indicate that their perceived future involvement in neighborhood decisions is negative, Black residents are far more likely to reveal a stronger negative sentiment about the future of their communities. There many factors that disproportionately impact Black residents, including homelessness, crime and poverty, which may alter residents’ perceptions of the future.

"IfeelsaferinmyneighborhoodthanIdida


Agree
Disagree
StronglyAgree
StronglyDisagree
Uncertain
39: Survey Response: Safety
Based on the responses of the Community Survey, residents least likely to feel safer in their neighborhood today compared with a year ago are those who are Black, live in Ward 8 or are between 45-84 years of age. Younger persons are more likely to indicate that they feel safer than they did a year ago.

"Fromyourobservationsandinteractionswith D.C.police,howrespectfulwerepolicein
interactingwithyouorwithothers?


Disrespectful
Ididnotinteractwithorobserve police
Neutral
Respectful
VeryDisrespectful
VeryRespectful
Figure 40: Survey Response: Interaction with Police

VERYRESPECTFUL
VERYDISRESPECTFUL
NEUTRAL RESPECTFUL
IDIDNOTINTERACTWITHOROBSERVEPOLICE
DISRESPECTFUL
VERYRESPECTFUL
VERYDISRESPECTFUL
NEUTRAL RESPECTFUL
IDIDNOTINTERACTWITHOROBSERVEPOLICE
DISRESPECTFUL
VERYRESPECTFUL
VERYDISRESPECTFUL
NEUTRAL RESPECTFUL
IDIDNOTINTERACTWITHOROBSERVEPOLICE
DISRESPECTFUL


Agree
Disagree
StronglyAgree
StronglyDisagree
Undecided
Figure 42: Survey Response: Home Affordability
Figure 44 illustrates that perceived neighborhood affordability is correlated with race. Black residents are much more likely to claim that they cannot continue to afford their neighborhood in the upcoming years. White residents are much less likely to report a negative sentiment about affording to live in their neighborhood.
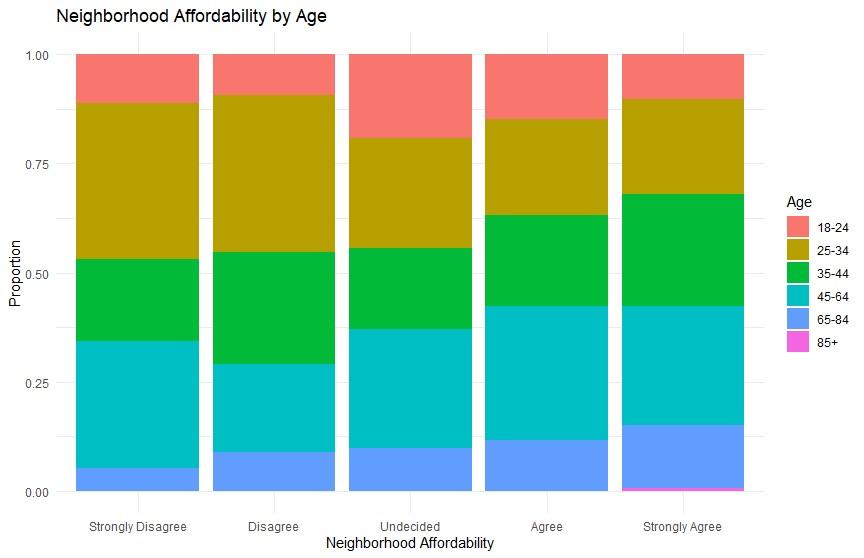
43: Survey Response: Neighborhood Affordability by Age
Age is also a major factor in perceived affordability. Young adults between the age of 25-34 were more likely to report that they believe that they could not afford to continue to live in their neighborhood. Older adults aged 65-84 were more likely to report that they could afford their apartment or mortgage in the next year. The discrepancies between older and younger adults reflect a growingly precarious economic situation for low-income residents entering their thirties and forties.


Agree
Disagree
StronglyAgree
StronglyDisagree
Undecided
Figure 44: Survey Response: Schools in the Neighborhood
A majority of UPO respondents had achieved their high school diploma or GED, while a smaller percentage had completed their bachelor’s degree. Both groups felt that there were fewer educational opportunities near their neighborhood than a year ago. However, an overwhelming number of individuals indicated that they were unsure of the educational opportunities altogether.

"Whatisyourlevelofconfidenceinyourability toobtainajob,orahigherpayingjob,orreceive araise,withinthenextyear?"


Confident
Notveryconfident
Somewhatconfident
Uncertainofmyconfidence
Veryconfident

Figure 45: Survey Response: Job Confidence
UPO found that individuals who were not very confident in finding a job, a better paying job, or a raise within the next year were predominately unemployed or had associate’s degrees. This information is particularly important for UPO, as the organization has several services to help individual obtain employment. If perceived confidence in the job market is a strong indicator for an individual pursuing a job, the organization may need to offer supportive services beyond job placement programs.
Toomuchtrouble
Servicesavailableduringlimitedhours
Noteligible/didn'tqualify
None
Lackofchildcare
Lackofchildcare
Inadequatetransportation
Inadequatetransporation
Ididn'tknowwheretogoforhelp
Health/disabilitiesmadeitdifficultto…
Hadapriorbadexperience
Didn'twanttoaskforhelp
Concernaboutconfidentiality
Can'tread
Figure 46: Survey Response: Roadblocks to Needs and Needs Requested Overall, DC residents reported that they did not know where to go for help meeting their needs, suggesting a need for greater access to information on services provided at the community-level and at the government level. Navigational services provided by UPO and other providers help residents whom are referred to them or who visit them by connecting customers to service providers (at UPO) or at other service providers throughout the District. The second most often challenge cited to getting help is health or disability issues that hinder some residents’ ability to obtain the help they need followed by residents not being eligible to receive services. These may include residents who earn slightly above at the cusp of income requirements for certain benefits.
In addition to questions about needs and services provided, the 2024 UPO Community Assessment included four questions about UPO customer experience, if they had ever received services from the organization. Out of the 1,012 respondents, there were 322 individuals who indicated they had used UPO services in the past. 050100150200250300
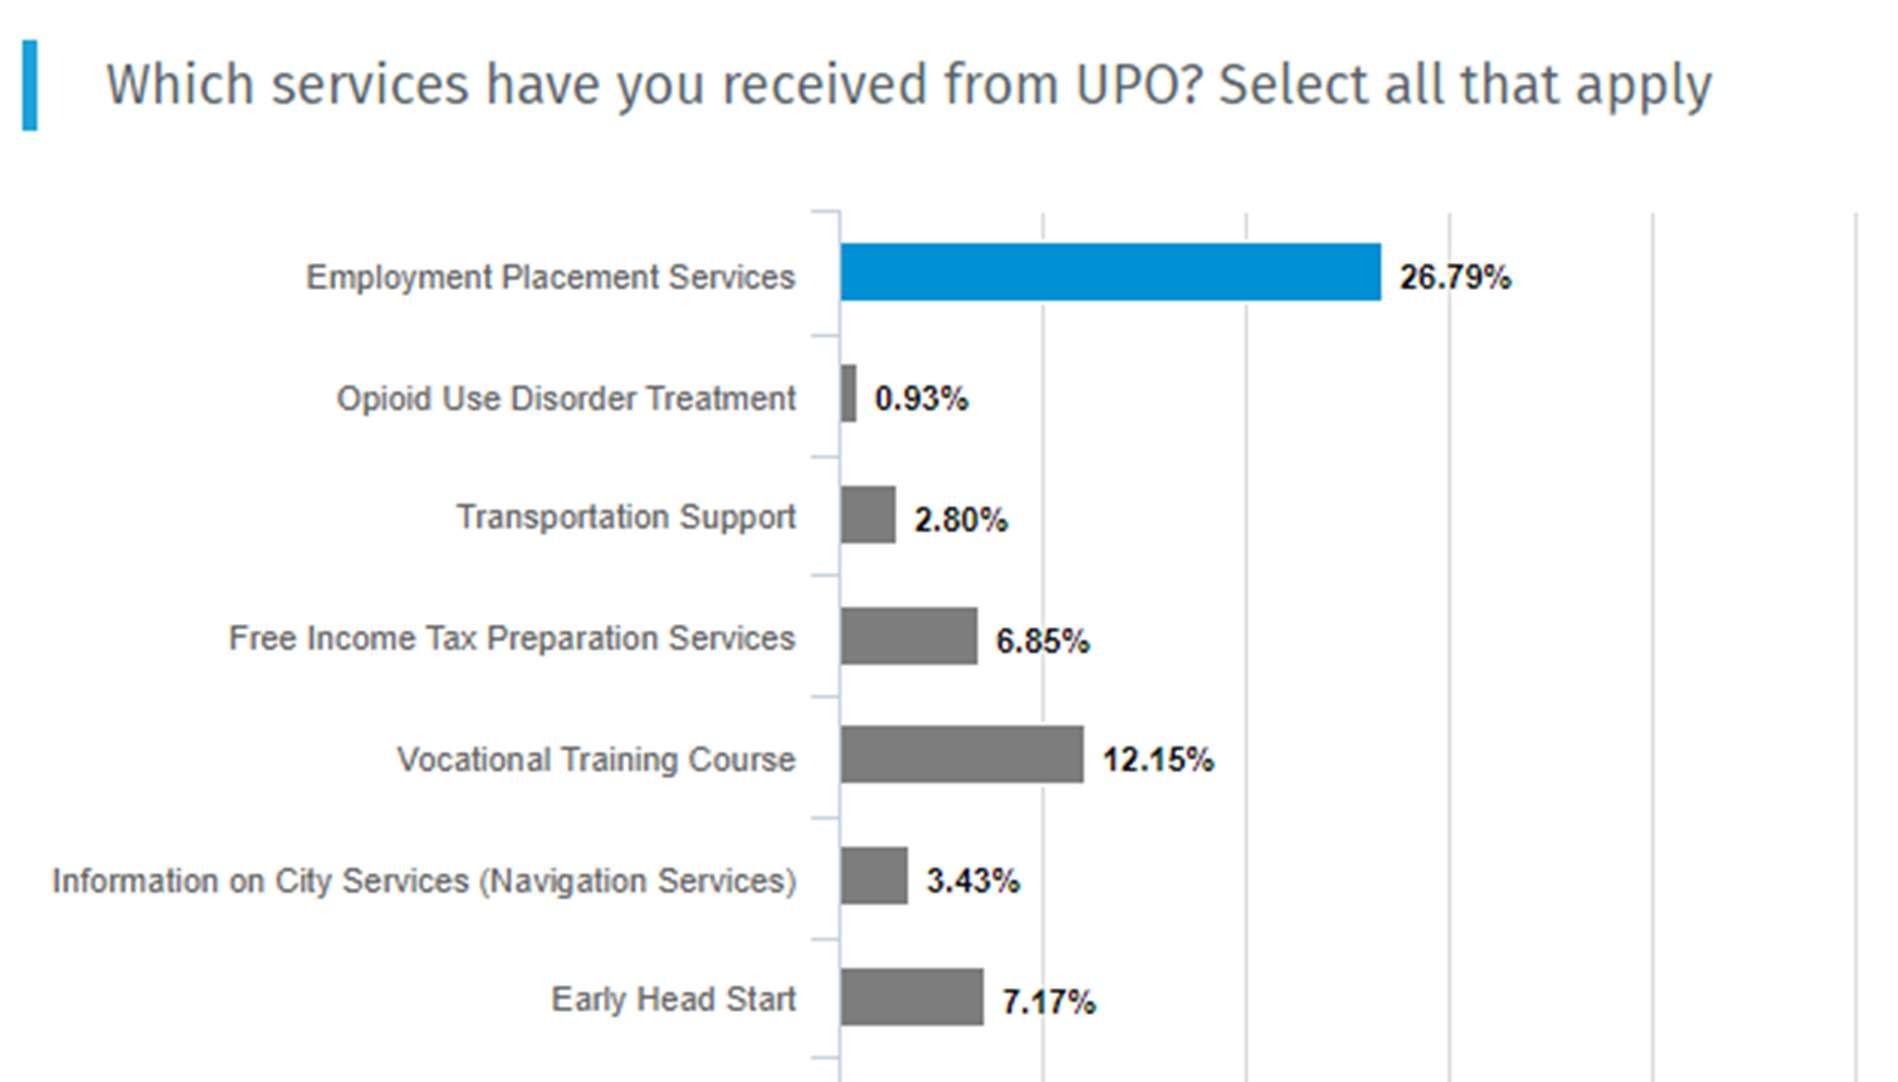
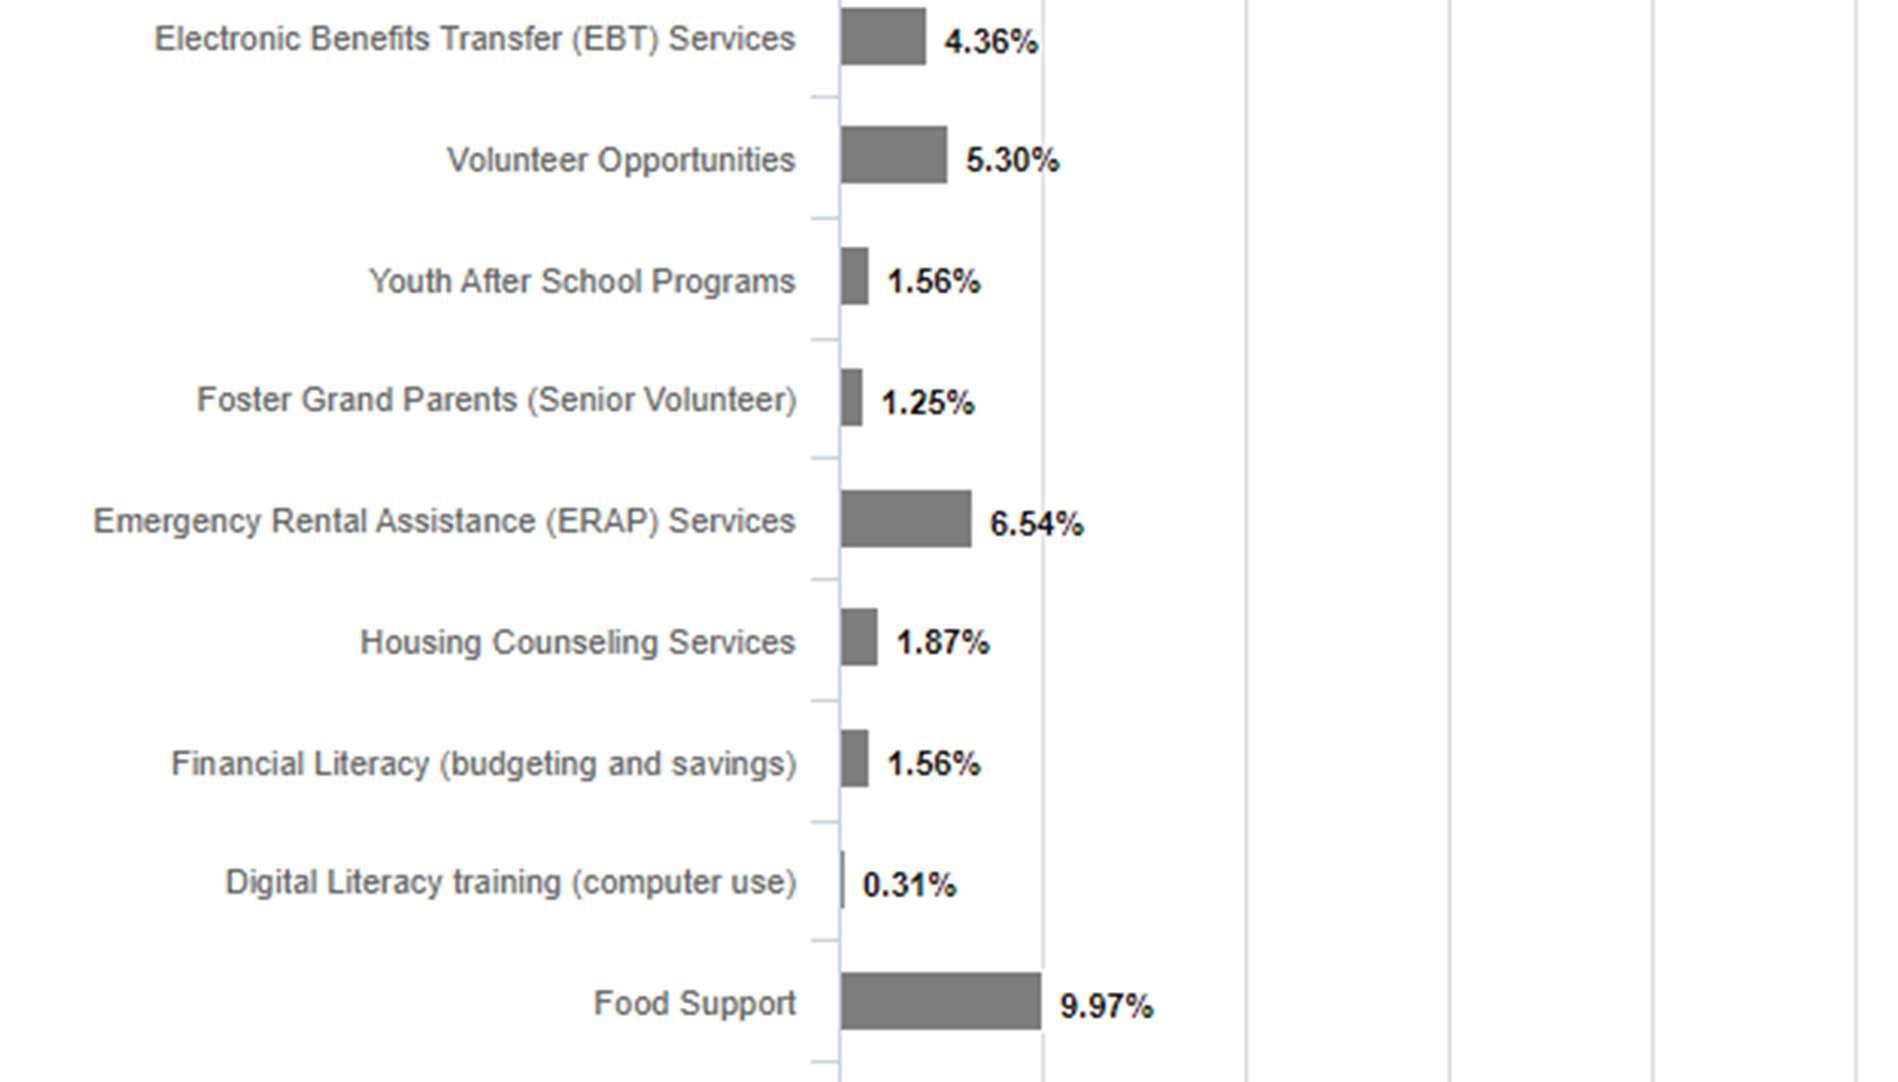
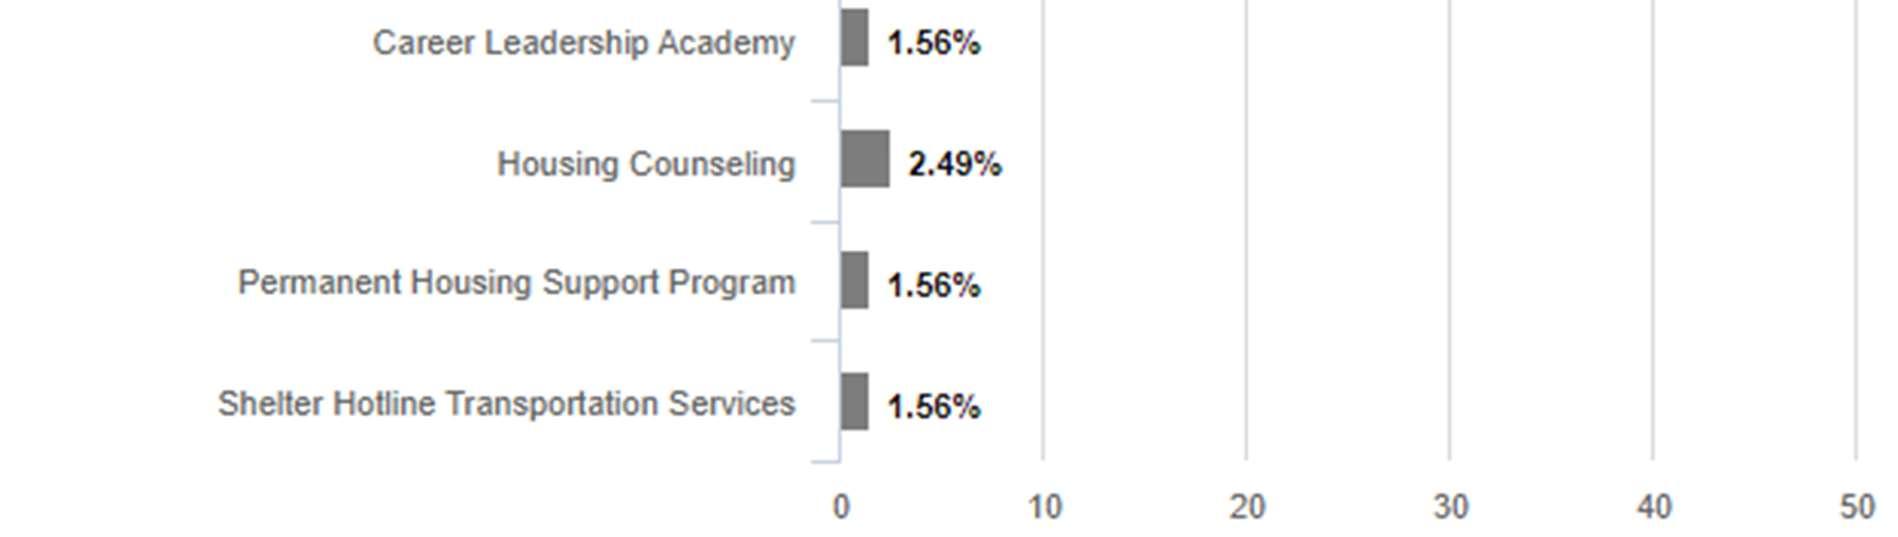
Employment Placement Services were by far the most used service by previous UPO customers who completed the survey, followed by. Vocational Training Courses The responses of the Community Assessment Customer Satisfaction survey, however, do not accurately reflect the distribution of services requested by UPO customers. A large number of UPO customers utilize UPO’s EBT, for example. Therefore, the people most likely to respond to the survey were individuals who utilized more intensive UPO services.
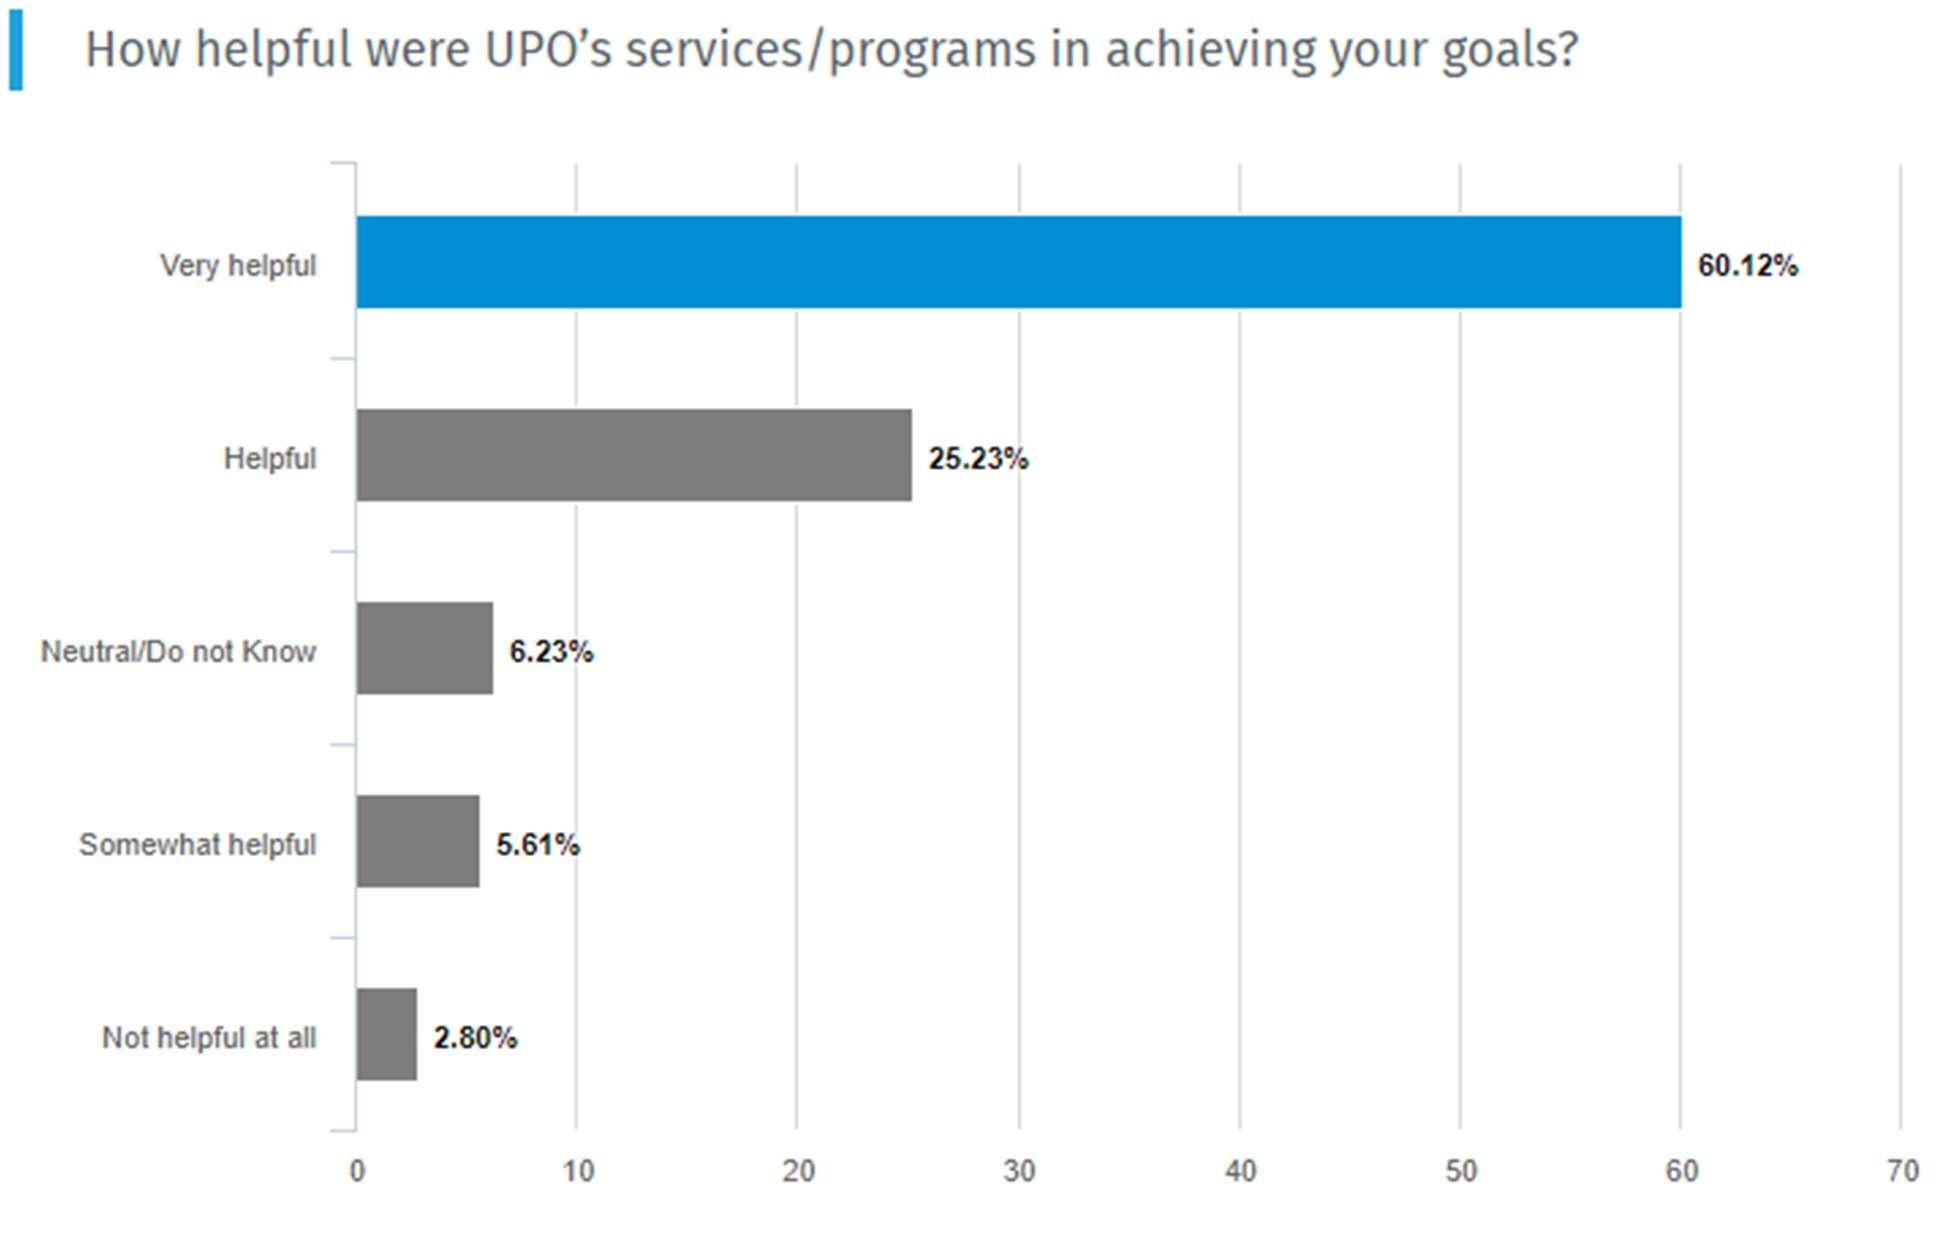
Figure 50 illustrates that UPO’s programs and services were well received by former customers. Only 3% of total respondents indicated that the services were not helpful in achieving their goals.
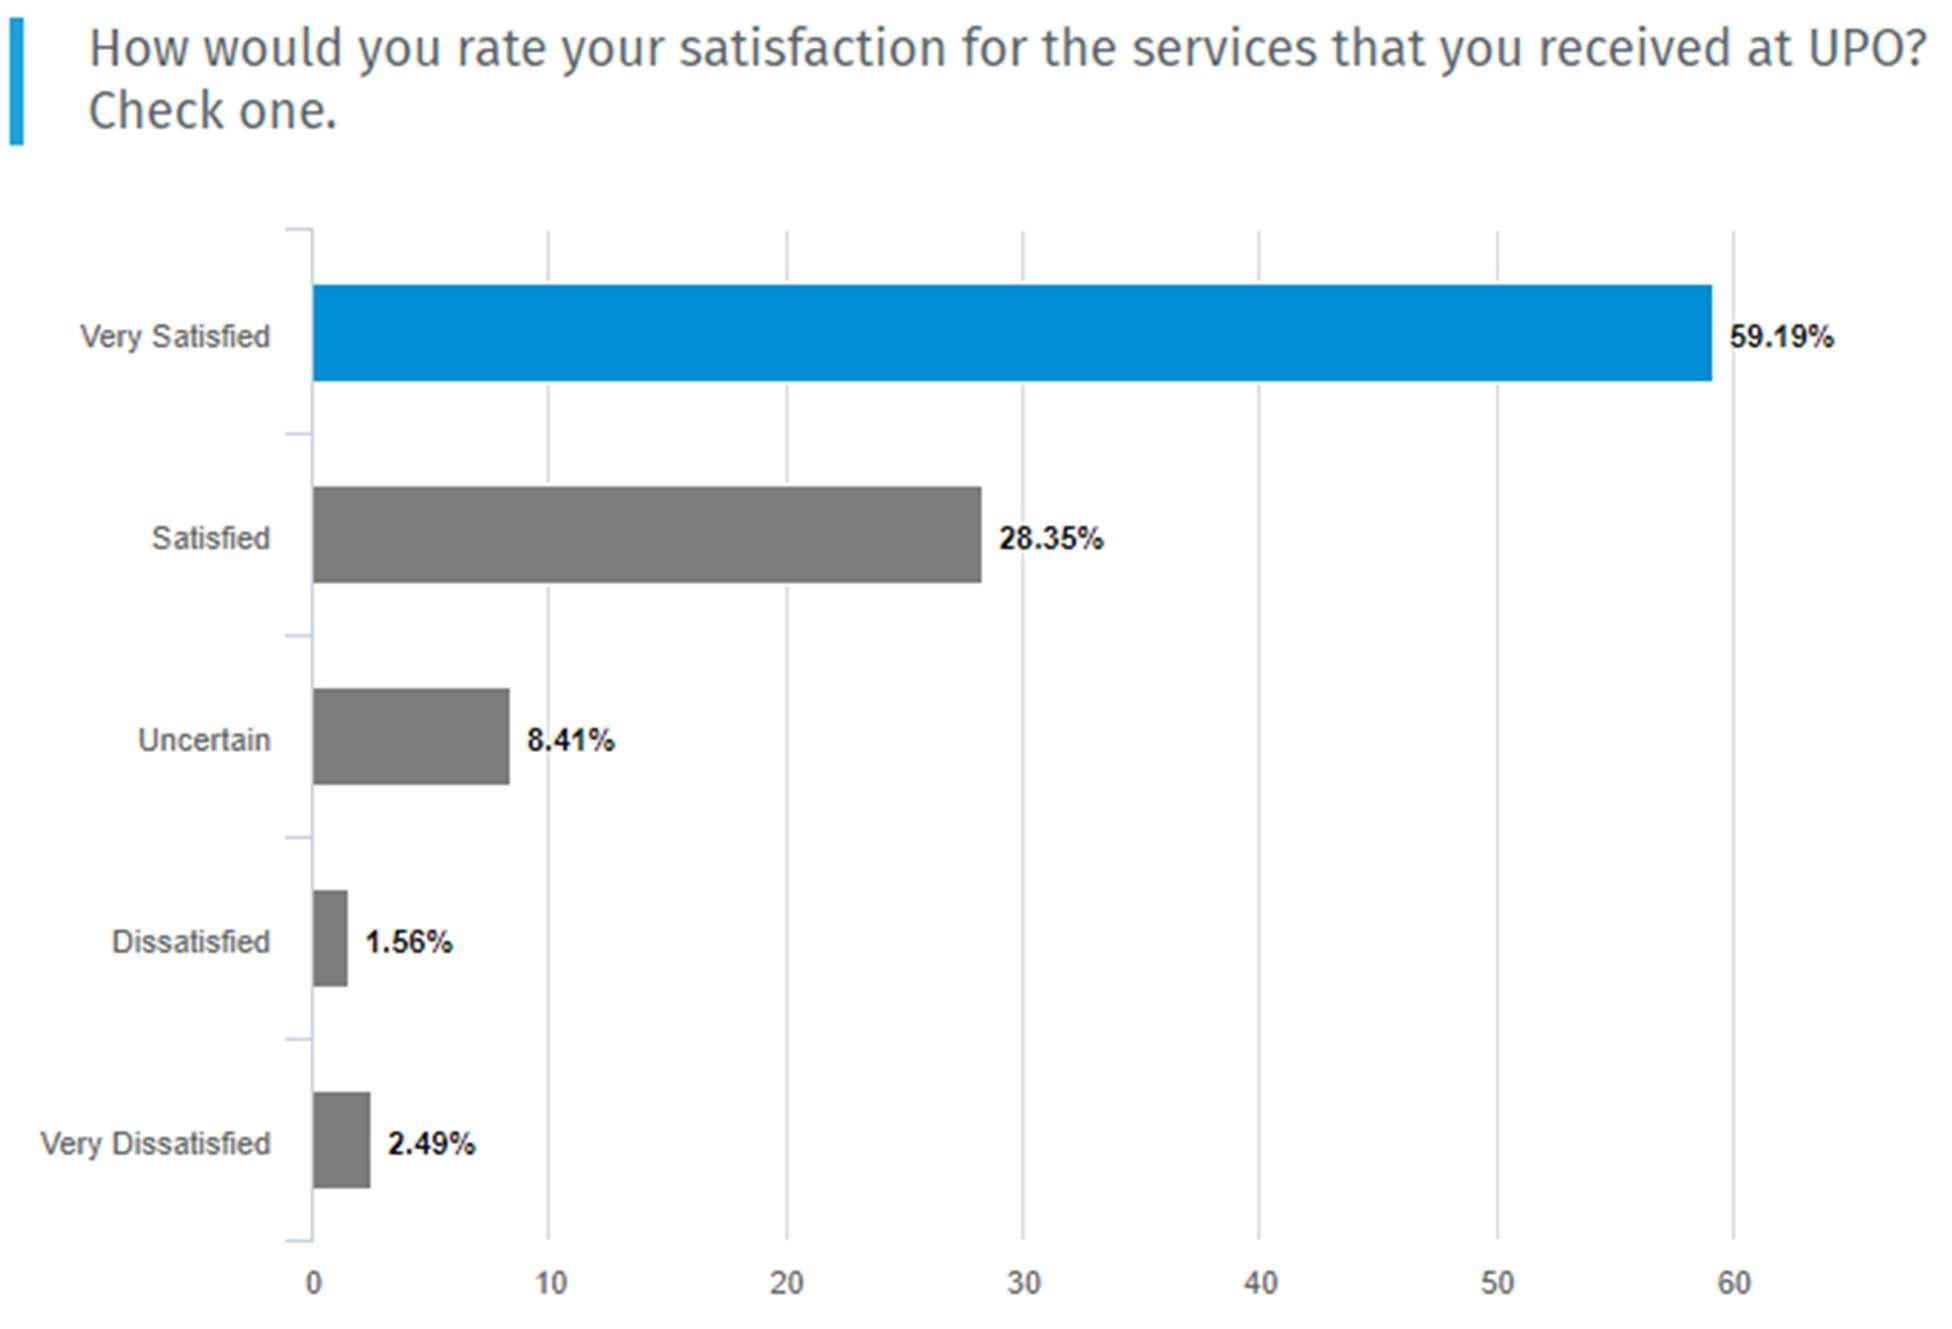
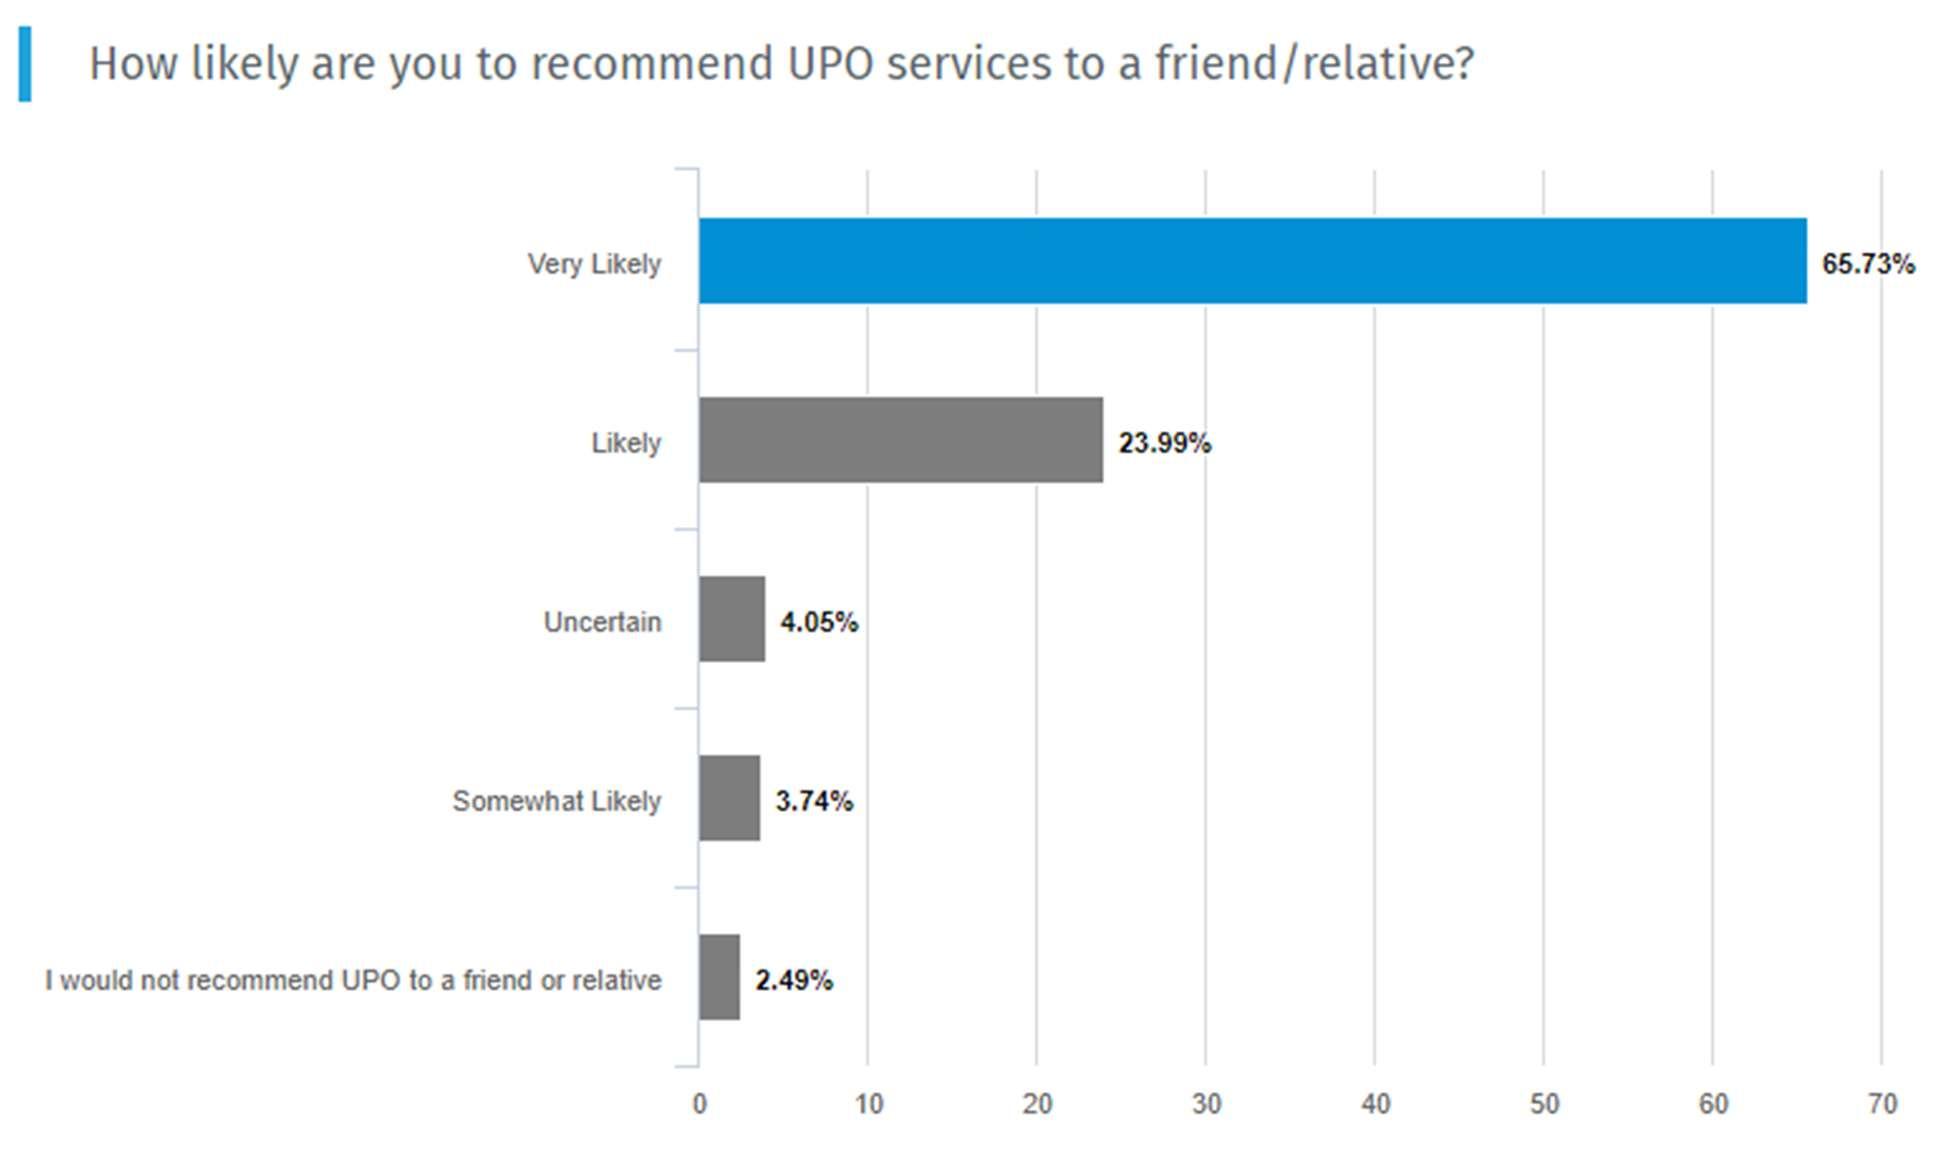
Former UPO customers indicated that they were very satisfied with UPO services and that they were very likely to recommend the services to a peer or friend, revealing that UPO is held in high regard by many former customers of the organization.
The following recommendations include considerations based on information and input gathered from the literature review, focus group discussions and responses to the UPO Community Assessment Survey.
Category NeedIdentified
Economy
Low-income District
residents lack the skills to obtain a living wage job.
Reasoning
Low-income residents are more likely to have less educational attainment and limited vocational training.
Recommendations
Increase the number of vocational training opportunities in high demand sectors that pay a living wage.
Systemic
Barriers
Low-income residents have a high-opportunity
cost associated with programming.
If a resident pursues an activity that may increase their economic security, they may lose the immediate benefit associated with their wages.
Subsidize programs that increase a resident's ability to obtain economic security, by providing lowincome residents a living wage stipend.
Systemic
Barriers
Low-income
residents require a myriad of servicesnot just one - to address the systemic barriers they face.
Historical and discriminatory systemic barriers reinforce generational poverty.
Emphasize organizational wrap around services, connecting residents to different programs and resources, in and out of the organization.
Governance Struggling communities’ express distrust with current political institutions.
Low-income residents question the effectiveness of organizations at reducing generational poverty.
Build, support and maintain grass roots connections to low-income communities by investing in case workers, impact facilitators and relationships with partners.
Governance Low-income residents express frustration with policies prioritizing wealthier residents. Low-income residents recognized change within their communities often favored the wealthy. Through grass roots movements, support and advocate for progressive policies in the District.
Governance Residents are often not aware of the programs available. There is poor communication about where to participate in programming and confusion around eligibility.
Neighborhood Safety Communities are struggling to prevent violence in their neighborhood. Juveniles have recently been responsible for one of the greatest increases in crime the District has seen since the turn of the decade.
Living Conditions Poorer residents struggled with neighborhood cleanliness. Issues surrounding trash pick up, pet droppings, mice, mosquitos and flies have induced poor living conditions for
Promote and market existing opportunities through grass roots campaigns.
Enroll juveniles into mental health programming while providing their parents the resources to give their children the necessary tools to reach economic security.
Direct street clean up initiatives through local partners or government agencies, also encourage residents to use the 311 line.
low-income residents.
Health Many residents struggle with high blood pressure.
Housing Residents have grown frustrated at the increasing gentrification of the District.
Older residents are more likely to have complications regarding their blood pressure.
Many residents feel as if the new luxury apartments are benefitting the wealthy, while pushing out lowincome residents.
Housing District residents would like to see more locally owned businesses in their neighborhoods. Gentrification has also brought an influx of corporate businesses, in which people feel detached from.
Housing For all District residents, there is a crisis of affordability.
Many residents indicated that living in the District was too expensive.
Provide local clinicians the resources to address the substantial need for medical resources in lowincome communities.
Build and connect lowincome communities with quality affordable housing, while increasing the housing supply in wealthier areas of the District.
Support District residents and their entrepreneurial spirit, and advocate for legislation that makes it easier to build and operate a locally owned business.
Promote higher paying jobs, while advocating for policies that limit the growth of rent prices and daily necessities.
Housing Residents struggle to connect with affordable housing.
Over the past three years, the number of affordable units in the District has decreased drastically.
Advocate for increasing the stock of affordable housing units, while preventing displacement of lowincome residents.
Childcare For families, childcare in the District is too expensive.
Education Test scores in poorer communities are still behind the District average.
There are limited slots for families seeking childcare. Moreover, the cost of childcare is the most expensive in the country.
Many schools in poorer communities struggle to maintain appropriate budgets for their student population sizes.
Provide free childcare for seeking families whilst providing support for parents.
Advocate for increases in public school budgets while providing youth after school activities and parents supportive resources.
There is an underlying throughline throughout all recommendations to UPO, partners, and the District government: that low-income residents are not being provided the necessary resources to overcome their systemic barriers. UPO can alleviate this issue by providing holistic wraparound services, including stipends, to low-income customers.
As part of the Community Assessment, UPO conducts internal analysis of the ongoing needs of staff, directors and executives to help provide customers economic security through uniting people with opportunities. Three focus groups were held for all staff, directors and executives. Through the three focus groups, UPO asked individuals about the individual necessities for themselves, as well as their department. The focus groups attempted to identify operational needs, program needs, and communication needs.
Staff Needs
When discussing operational needs, UPO staff indicated that more bilingual forms, fliers and other distributed goods were necessary to reach the growing number of Spanish speaking residents found in the District. Furthermore, updated fliers, forms, and websites were identifiable issues that many frontline staff persons faced. Staff also identified benefits and pay as issues.
Staff stated that wrap-around services were essential to the organization, but the organization lacks the necessary tools to refer individuals to other services both internally and externally. Frontline staff also said it was important for the organization to have a cohesive transfer and referral process, while providing wrap around care for all individuals involved in UPO’s programs. One staff person commented that UPO needed to do more “boots on the ground” work, interacting with the community, and attempting to solve issues surrounding poverty systemically.
Communication was a major concern for all staff persons in the focus group. Several staff persons indicated that the organization lacked direction. Additionally, many staff persons shared the perceived isolation between departments (referred to as silos). Even with the all-day staff event detailing what each department does, staff persons mentioned not knowing what the other departments within the organization do.
There were several different operational challenges identified in the Directors focus group. One of the most relevant criticisms of the organization was the lack of available staff. One director recognized the work of their staff but mentioned that they could be more productive if they had additional staff. “Our workload increases, and you know we are the same amount of people.”
Directors also noted the organization’s lack of technological use. For example, one director mentioned that their department would be better off with additional technological capacity support. One director offered a solution of moving all the paper forms that UPO utilizes into digital tools. Other operational challenges exist in how the organization conducts wraparound services. Many directors noted that it was difficult to tell when other departments were holding events across the city with the removal or lack of use for the online calendar. The directors were in agreement that there should be a Statement of Purpose for every department on UPO’s website.
Directors echoed sentiments shared by staff, that additional bilingual support is needed for all programs across the organization. Some individuals mentioned that there is not much incentive for residents to attend UPO programming. While there are incentives in the form of transportation stipends, not all programs have access to this, or the budget. One director commented that in order for UPO to maintain a consistent customer base, there need to be services that directly address their economic security, dealing with both immediate problems as well as providing customers the tools to succeed themselves. All directors called on third parties to confirm follow-ups and referrals.
Communication was a major issue for directors. Directors noted that many people do not end up reading their emails, both within their department and outside their department. One director wished for the organization to hold people accountable for when they do not respond to emails. There were also comments made that promoted notifying all directors when an individual enrolls into UPO programming.
The primary operational challenge facing the organization according to the executive team is money. As a Community Action Agency (CAA), UPO struggles to collect unrestricted funding to help currently ineligible persons over the 200% of the Federal Poverty Line. Moreover, unrestricted funding would provide UPO the ability to address operational expenses without clashing with Community Service Block Grant funding. Another major operational challenge was UPO’s lack of customer online resources. One executive claimed that UPO has struggled with maintaining contact with previous customers of the organization and that additional resources should be used for follow-ups. One executive recommended a “catch-all” system, where UPO customers would enter information on a portal, and then the organization would determine what services the customer would need.
In terms of program support, one executive called for additional stipends for customers utilizing UPO services. These stipends would not only act as incentives for new customers, but also provide economic stability for current customers. Some executives oversaw internal departments. Of these executives, one claimed that connecting with UPO employees should be easier.
To prioritize the needs identified in this Community Needs Assessment, stakeholders (including UPO staff) were asked to complete a short survey prioritizing Individual and Family Level Needs, Community Level Needs, and Agency Level Needs. The results are displayed in the tables below by category. A full ranking of all city-wide needs, regardless of category, is available in the appendix.
Rank
Individual and Family Level Needs. Renters, especially low-income young families are at risk of being priced out of the DC housing market when rent rates increase from year to year. 1
Individual and Family Level Needs. Low-income individuals/families require multiple services to address the systemic barriers they face. 2


The typical Ward 1 resident who completed UPO’s survey is a Black female, lives alone, and completed their high school education. They have health insurance from Medicaid or Medicare and are between the age of 34-44. In addition, the typical Ward 1 resident has little confidence that their neighborhood has gotten safer over the past year.
ImprovedCommunityEngagement: Increased interaction and trust-building between residents and local government.
EnhancedPublicSafety: More police presence and community safety initiatives to address rising crime.
Career-PreparednessEducation: Expanded access to educational programs that prepare residents for in-demand job markets.
AffordableHousingSolutions: Development of more affordable housing options and improvement of current living conditions.
AccesstoLiving-WageEmployment: Increased job training and employment services tailored to community needs
$25,000-$34,999
$35,000-$49,999
$50,000-$74,999
$75,000-$99,999
$100,000-$149,999
$150,000-$199,999


$10,000$10,000-$14,999$15,000-$24,999$25,000-$34,999$35,000-$49,999$50,000-$74,999$75,000-$99,999$100,000-$149,999$150,000-$199,999$200,000+
While UPO primarily works with individuals who fall significantly below the poverty line, Ward 1 survey respondents report a diverse range of incomes. Over the past decade, Ward 1 has been championed as a mixed-income area of the District.

$200,000+
$100,000-$149,999
$75,000-$99,999
$50,000-$74,999
$35,000-$49,999
$10,000-$14,999
$150,000-$199,999
$100,000-$149,999
$50,000-$74,999
$25,000-$34,999
$10,000-$14,999
LESSTHAN$10,000
$100,000-$149,999
$75,000-$99,999
$50,000-$74,999
$25,000-$34,999
$15,000-$24,999
$10,000-$14,999
LESSTHAN$10,000


Many of the low-income residents of the area identify as Black or Hispanic. Based upon the responses from Ward 1 residents, both Hispanic and Black residents are more likely to report that they earn less than $10,000 a year than white residents.


CompletedHighSchoolDiploma
CompletedTechnical/Vocational School
Earnedassociate'sdegree
Earnedbachelor'sdegree
Earnedmaster'sdegree
LessthanHighSchoolGraduate
Like its varied income levels, Ward 1 survey respondents also reflect a diversity of education levels, with relatively even distribution across educational categories. As the city continues to be attractive to college-educated professionals, UPO expects Ward 1 to lose some of its diversity in both income and education.

EARNEDMASTER'SDEGREE
EARNEDBACHELOR'SDEGREE
EARNEDASSOCIATE'SDEGREE
LESSTHANHIGHSCHOOLGRADUATE
EARNEDMASTER'SDEGREE
EARNEDBACHELOR'SDEGREE
EARNEDASSOCIATE'SDEGREE
COMPLETEDHIGHSCHOOLDIPLOMA
LESSTHANHIGHSCHOOLGRADUATE
EARNEDMASTER'SDEGREE
EARNEDBACHELOR'SDEGREE
EARNEDASSOCIATE'SDEGREE
COMPLETEDHIGHSCHOOLDIPLOMA
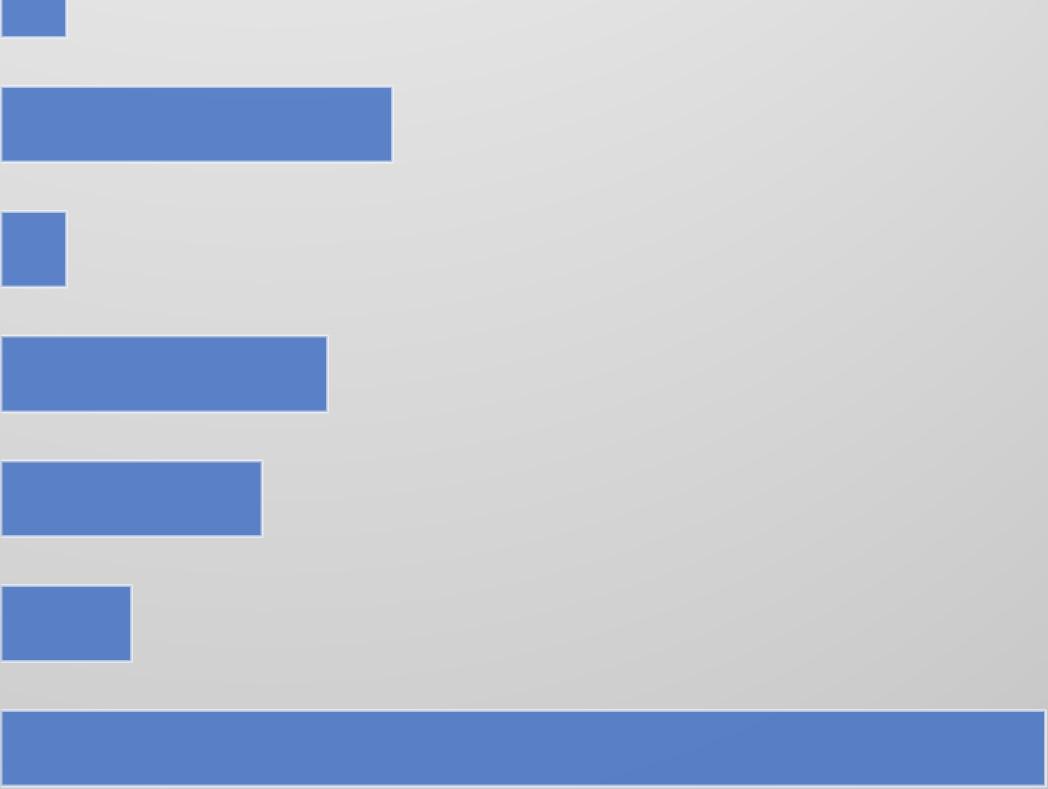
57: Ward 1 – Education by Race
Disparities in education also exist by race in Ward 1. For example, Black and Brown residents are less likely to complete higher educational attainment than white respondents, all of whom in Ward 1 had pursued higher education.


There are also disparities in education based on age. For example, younger residents were more likely to report that they had master’s degrees or bachelor’s degrees, compared to older residents. While a majority of residents aged 45-64 indicated that they had completed high school or a GED equivalent, more residents 18-24 had completed their bachelor’s than 18-24
who had completed high school. The trend is indicative of young, often white, professionals moving into mixed-income neighborhoods. As this trend directly impacts Black and Brown residents, the District should consider providing services to help older residents obtain higher education opportunities.

Ward1:Whatbestdescribesyouremployment status?


Ward1:Whichofthefollowingbestdescribesyour householdsituation?


The vast majority of Ward 1 respondents are renters. Ward 1, unlike wealthier wards, has a varied housing stock, including public housing units, townhomes and market-rate apartments. Unfortunately, many of the townhomes in the area have become unaffordable for many, as prices of housing units continues to increase. Therefore, the city must provide more affordable housing units to prevent the displacement of low-income residents from their apartments.
Ward1:Ifyoupayarentormortgage,howmuch doyoupaypermonth?

$2,000+
$1,800-$2,000
$1,500-$1,799
$1,200-$1,499
$1,000-$1,199
$1,800-$2,000
$1,200-$1,499
$1,000-$1,199
$800-$999
$0-$799
$2,000+
$1,800-$2,000
$1,500-$1,799
$1,200-$1,499
$1,000-$1,199
$800-$999
$0-$799


Based upon the survey results, an increase in rent is most likely to displace Black and Brown residents. While white residents in Ward 1 are likely to pay at least $1,000 in rent or mortgage a month, Black residents are more likely to pay between $0-$799 a month in rent costs. This is likely due to the number of public and other subsidized housing units in Ward 1.


Yes,throughhealthcare.govorDC HealthLink
Yes,throughMedicaid/Medicare
Yes,throughmyemployerormy spouse'sorrelative'semployer

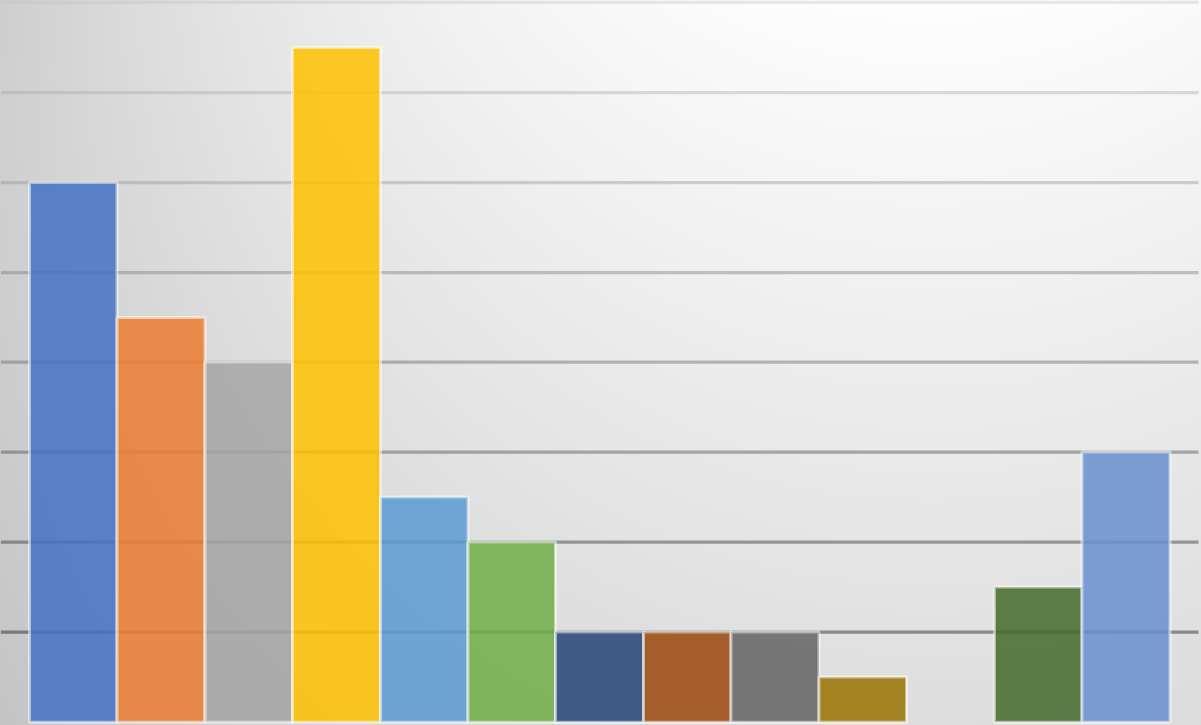

HighBloodPressure

Asthma

Diabetes

MentalIllness

LearningDisability

PhysicalDisability

HearingImpairmentorDeaf

VisionImpairmentorBlind

Alcohol/SubstanceAbuse

HIV+/AIDS

Cancer
Ward 1 survey respondents had a negative sentiment towards their inclusion in the decisions of their neighborhood’s future. Few indicated that they feel positively about the future of the neighborhood and their ability to change it. This is likely due to the increasing rents in the area as well as the spike in crime during 2023.


Agree
Disagree
StronglyAgree
StronglyDisagree
Uncertain


Ward1:Fromyourobservationsand interactionswithD.C.police,howrespectful werepoliceinteractingwithyouorothers?
Disrespectful


Ididnotinteractwithorobserve police
Neutral
Respectful
VeryDisrespectful
VeryRespectful


Agree
Disagree
StronglyAgree
StronglyDisagree
Undecided
Despite rising rents from across the Ward, Ward 1 survey respondents noted that they are positive about their ability to continue to afford in the neighborhood. As mentioned previously, Ward 1 has some of the largest number of housing units in the District. This includes older buildings built in the 1920s, that are now subject to rent control. Rent control directly prevents buildings from increasing rent by more than 2% plus inflation5% during a 12-month lease period, meaning rents are stabilized for many individuals.

Ward1:"Therearestrongeducational opportunitiesinmyneighborhood"


Agree
Disagree
StronglyAgree
StronglyDisagree
Undecided
47% of survey respondents said that they were uncertain of the educational opportunities in the neighborhood. This may be indicative of the ward’s increasingly transient population who may not be familiar with the educational options in the area.

Ward1:Whatisyourlevelofconfidenceinyour akbilitytoobtainajob,orahigherpayingjob,or receivearaise,withinthenextyear?


Confident
Notveryconfident

Somewhatconfident
Uncertainofmyconfidence
Veryconfident


EarlyHeadStart
EmploymentPlacementServices
FoodSupport
FreeIncomeTaxPreparationServices
ShelterHotline
TransportationSupport
VocationalTrainingCourse

NOTELIGIBLE/DIDN'TQUALIFY
LACKOFCHILDCARE
INADEQUATETRANSPORTATION
HEALTH/DISABILITIESMADEITDIFFICULTTOGETTHERE IDIDN'TKNOWWHERETOGOFORHELP
HADAPRIORBADEXPERIENCE
DIDN'TWANTTOASKFORHELP
CONCERNABOUTCONFIDENTIALITY
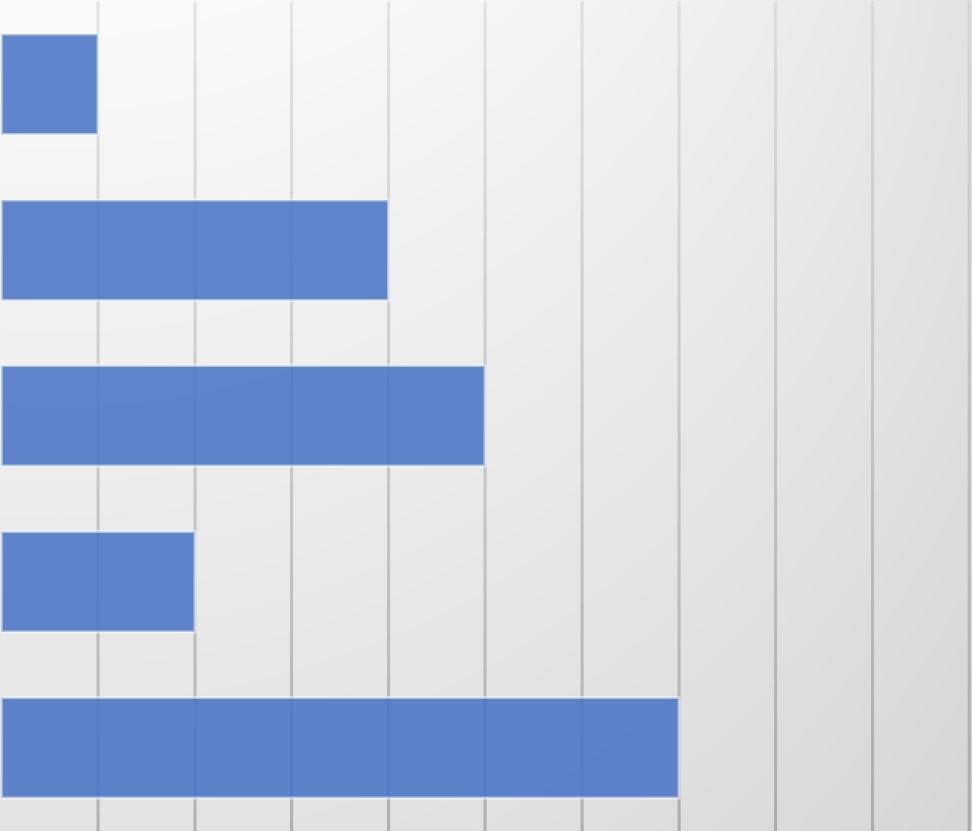
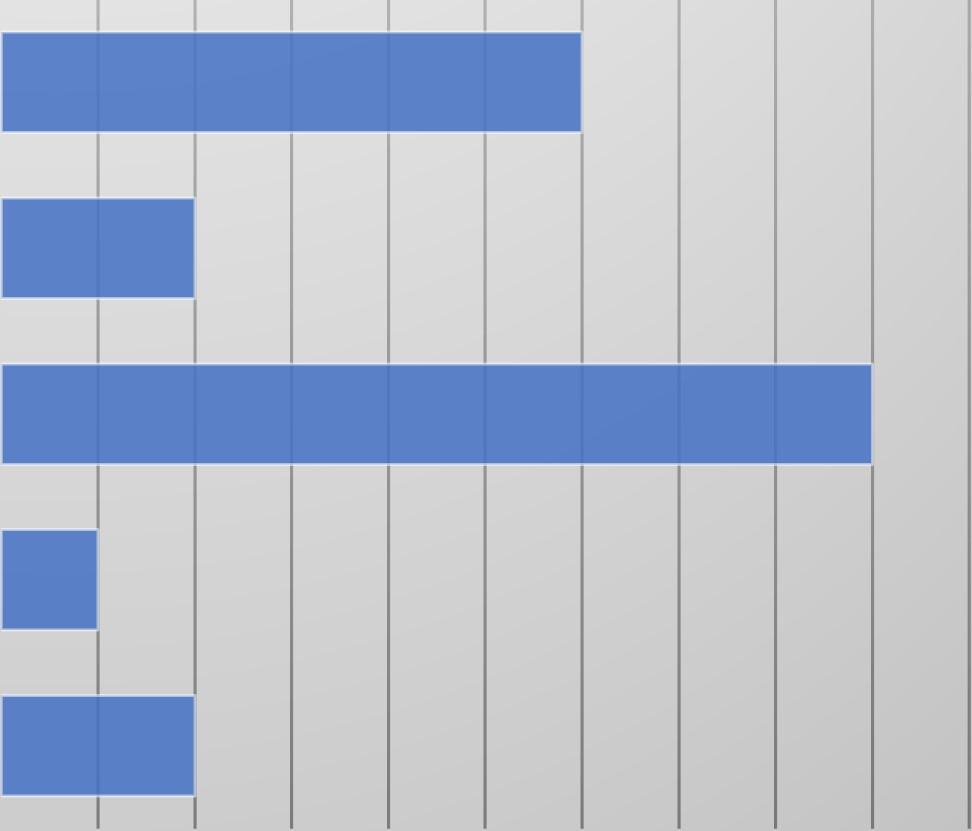
The Ward 1 focus group was held in the Mount Pleasant Neighborhood Library and had a total of four attendees. While Ward 1 has some areas with a high level of poverty, the area is rapidly gentrifying resulting in many low-income residents being displaced from the area.
When discussing if politicians were addressing their concerns, residents noted that they do not see many politicians in the area that they live. They didn’t believe that they were doing enough for the city and would like to see more focus on issues such as education.
Two residents noted that they felt connected to their neighborhood through the education system. Another resident claimed that there weren’t many ways that they were able to connect with the community.
When discussing safety, all participants believed that the police did not make them safer. One resident claimed that the police unnecessarily harassed them when “they weren’t even doing anything wrong.” They wished for there to be a diminished police presence.
Residents complained about the number of rats that they see in the city on a day-to-day basis. Otherwise, participants believed that the living conditions in their neighborhoods were satisfactory.
Participants believed that the educational opportunities in the area were holding other residents back from success. They believed that there was not much significance to what was being taught, or that teachers were not properly explaining themselves. One resident believed that adult education was difficult to access for people who needed it.
When discussing the housing situation in DC, one resident said that it was so expensive they believed they would have to move out of the area soon. Other residents agreed and feared that their homes would be replaced by developers.
Category Need Identified
Education Students in Ward 1 do not feel as if the education they are receiving is relevant to their future careers.
Childcare Ward 1 residents require cheaper access to childcare
Reasoning
Students participating in the UPO Ward 1 Focus said they want more relevant education to their career endeavors
Recommendations
Coordinate with local education leaders and teachers to discuss a plan of action that students would participate in.
Low-income Hispanic mothers, who reside in Ward 1, look for cheap alternatives to childcare
Housing Ward 1 residents struggle to acquire affordable housing
Housing Ward 1 residents live face issues with pests, rats and decrepit housing conditions
Systemic Barriers
Ward 1 lowincome residents lacked the skills to obtain a living wage job
Low-income residents they will be displaced by the rapidly gentrifying area of the District
Expand the number of childcare slots available and promote residents to achieve their CDAs
Provide immediate relief to residents with low incomes through rent subsidizes, while strengthening the existing stock of affordable housing
Governance Low-income residents feel left behind by their local agencies and government
Much of the affordable housing stock meant for low-income residents has been ignored by property managers
Low-income residents in Ward 1 reported not having the necessary qualifications to obtain a living wage job to continue to live in the District
Residents reported they rarely see politicians, except when it is time for election season
Enforce existing tenant protections and demand action by landlords to provide services to ensure clean living conditions
Provide educational and vocational opportunities, support residents in their pursuit of improving their human capital
Increase the trust between residents and local government through community events and town halls
Governance Ward 1 residents noted that they did not know where to go for help
Neighborhood Safety Ward 1 residents felt more unsafe than they did a year ago
Residents felt left behind by systems such as 311 or even 911
Residents felt scared by the increase in crime that took place in 2023
Ensure improved communication from local agencies through events, fliers and other means of communication
Improve alternative policing methods such as violence interrupters, as well as increased police presence (particularly near the Columbia Heights Metro Station)


The typical Ward 2 resident who responded to UPO’s survey is single, Black and, and is between the ages of 18 and 24. Typically, they earn less than $10,000 a year and have completed high school. A significant number of the survey respondents are college students. This likely stems from the influence of The George Washington University campus, located in the Foggy Bottom neighborhood.
TrustandCommunicationinGovernance: Strategies to build trust with local officials and inform residents about available services.
CrimePreventionandSafetyMeasures: Programs to address crime concerns and improve public security.
EducationalSupport: Greater resources for schools and vocational training programs to support low-income residents.
AffordableRentalOptions: Policies and programs to mitigate the high cost of rent and expand affordable housing
$15,000-$24,999
$75,000-$99,999
$100,000-$149,999
$150,000-$199,999


Compared to other wards, the response rate for Ward 2 skewed towards residents aged 18-24. This is likely due to the presence of the George Washington University and Georgetown University, which houses college students who are often of this age demographic. As a result,
UPO may have received responses from residents who do not represent the demographics or opinions of long-term residents


Figure 74: Ward 2 – Marital Status


Figure 75: Ward 2 - Race


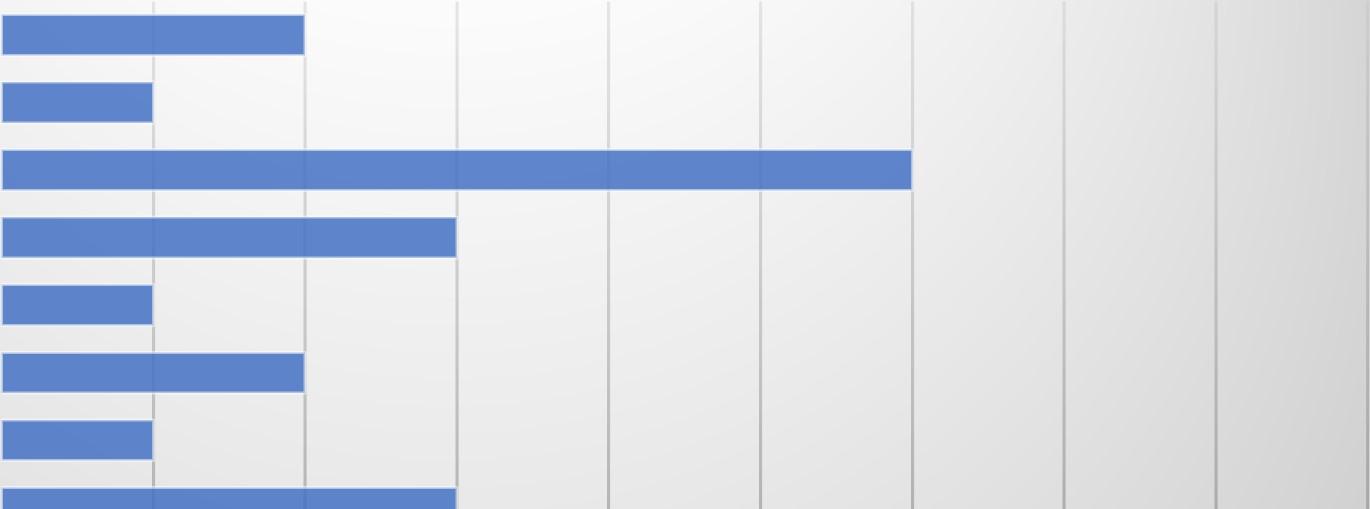
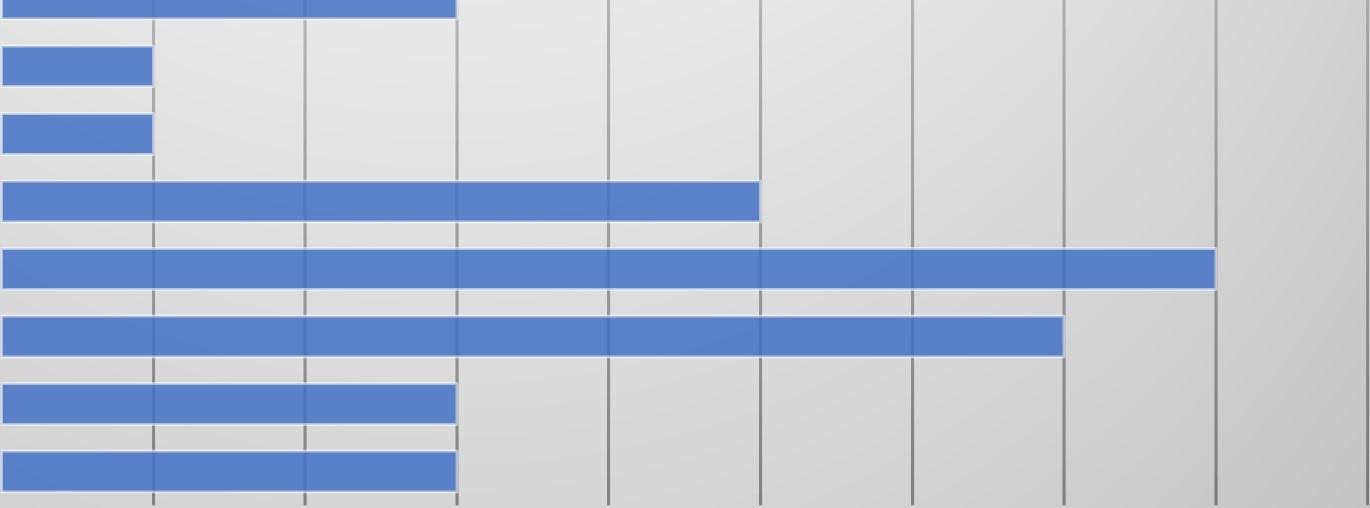
Figure 76: Ward 2 – Age by Race
Evidence of universities’ impact on the UPO survey can be found in the age distribution based on race. For example, the only senior respondents were Black, whereas white and Hispanic respondents tended to be younger. It may also be indicative of the high cost of rents in Ward 2.

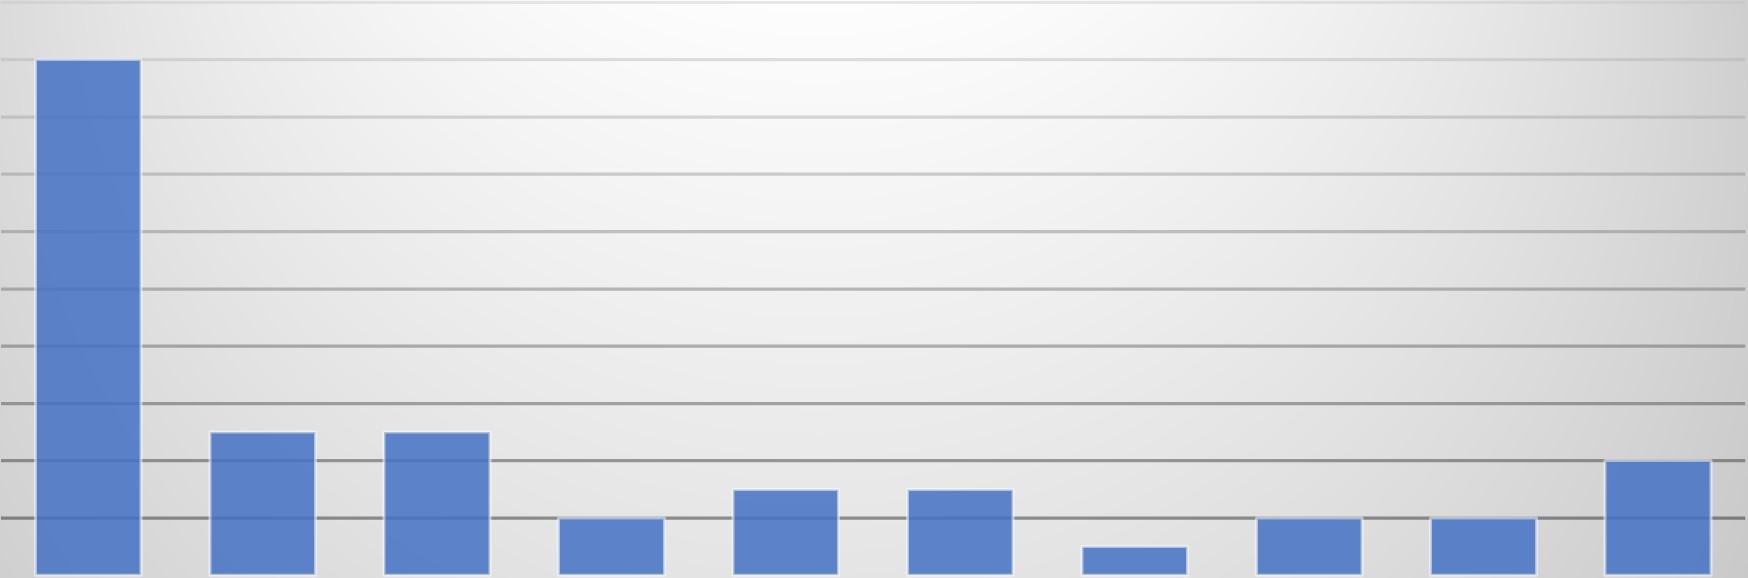
$200,000+
$150,000-$199,999
$100,000-$149,999
$50,000-$74,999
$35,000-$49,999
$15,000-$24,999
$10,000-$14,999
LESSTHAN$10,000
$50,000-$74,999
$35,000-$49,999
$25,000-$34,999
$15,000-$24,999
$10,000-$14,999

LESSTHAN$10,000


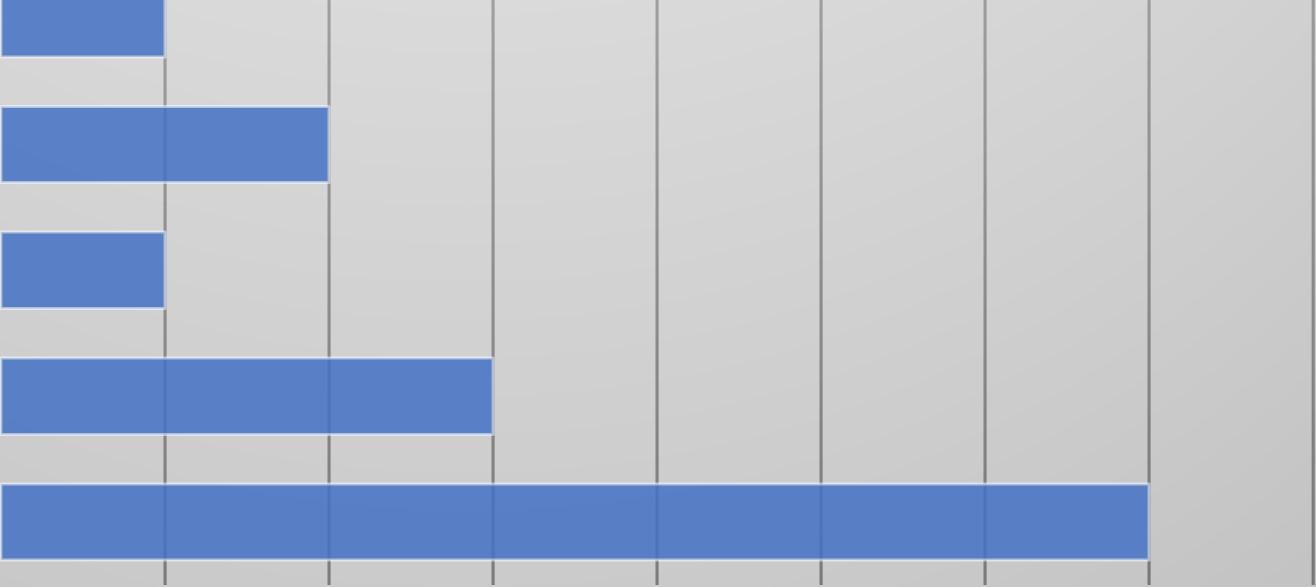
There is a large disparity between Black residents and white residents in Ward 2. While white residents tend to be economically secure, with several white residents making over $100,000 a year, Black respondents were more likely to have lower incomes. While Ward 2 is seen by some to be f a wealthy ward, poverty still exists within the ward.


CompletedHighSchoolDiploma
Earnedassociate'sdegree
Earnedbachelor'sdegree
Earnedmaster'sdegree
LessthanHighSchoolGraduate

LESSTHAN$10,000
$200,000+
$100,000-$149,999
$50,000-$74,999
$15,000-$24,999
LESSTHAN$10,000
$200,000+
$150,000-$199,999
$100,000-$149,999
$50,000-$74,999
$35,000-$44,999
$15,000-$24,999
LESSTHAN$10,000
$150,000-$199,999
$75,000-$99,999
$35,000-$44,999
$25,000-$34,999
$15,000-$24,999
$10,000-$14,999
LESSTHAN$10,000


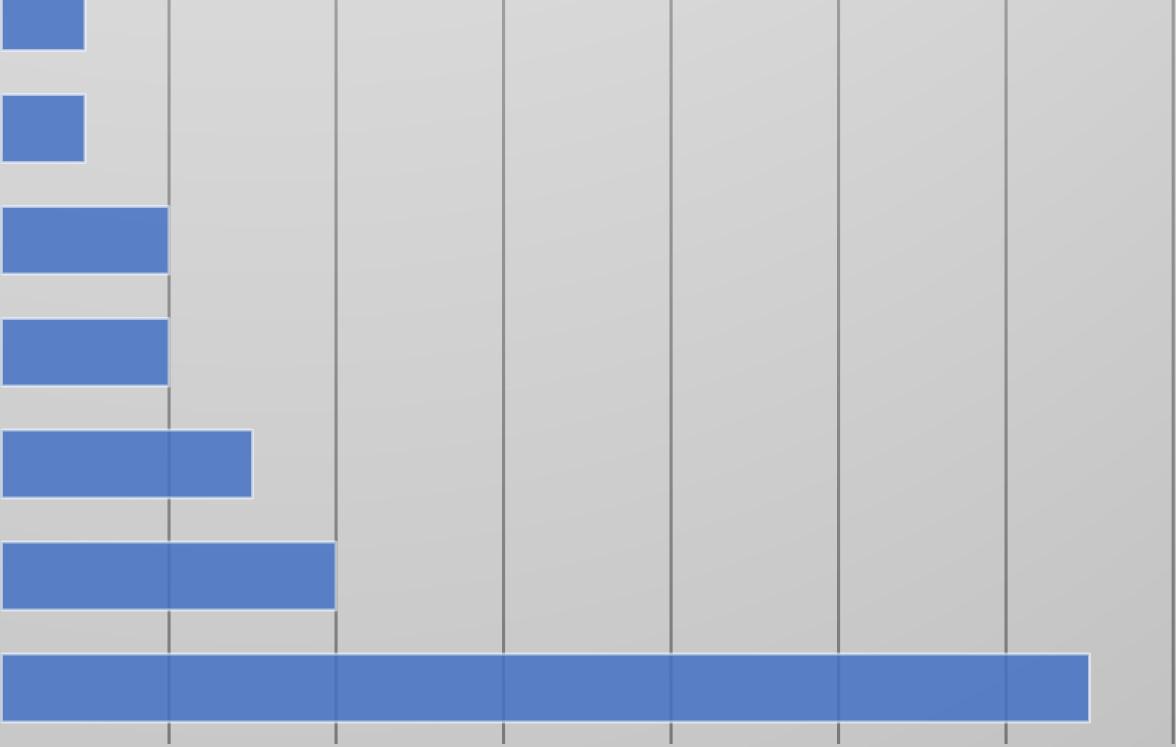
Survey respondents from Ward 2 were more likely to have achieved economic security if they have completed a bachelor’s degree or master’s degree. Only one resident who completed their high school education was making over $100,000 a year, compared to seven residents who had completed higher education.

Ward2:Whichofthefollowingbestdescribes yourhouseholdsituation?


Currentlyexperiencinghomelessness
Currentlylivingonacollegecampus
Homeownerpayingamortgage
Livingaloneandpayingrent
Livingwithothersandpayingrent
Livingwithothers,norent
Ward2:Ifyoupayarentormortgage,howmuch


Livingaloneandpayingrent
Livingwithothersandpayingrent
Livingaloneandpayingrent
Currentlyexperiencinghomelessness
Livingwithothers,norent
Livingwithothersandpayingrent
Livingaloneandpayingrent
Homeownerpayingamortgage
Currentlyexperiencinghomelessness
Livingwithothersandpayingrent
Livingaloneandpayingrent
Currentlyexperiencinghomelessness
Livingwithothers,norent
Livingwithothersandpayingrent
Livingaloneandpayingrent
Currentlylivingonacollegecampus
Figure 83: Ward 2 – Household Situation by Age For younger residents of Ward 2, many rely on living with others while also paying rent. This is indicative of the growing cost of rent in Ward 2, where there are few affordable housing opportunities.


84: Ward 2 – Health Insurance


HighBloodPressure

Asthma

Diabetes

MentalIllness

LearningDisability

PhysicalDisability

HearingImpairmentorDeaf

VisionImpairmentorBlind

Alcohol/SubstanceAbuse

HIV+/AIDS

Cancer

ComplicationsduetoLongCOVID-19

Other

85: Survey Response: Ward 2 – Health Conditions

myneighborhoodwouldlooklikeinthefuture"


StronglyAgree
StronglyDisagree
Uncertain
86: Survey Response: Ward 2 –
Ward2:Howrespectfulwerepolicein interactingwithyouorothers?


Figure 87: Survey Response: Police, Ward 2

Disrespectful
Ididnotinteractwithorobserve police
Neutral
Respectful
VeryDisrespectful
VeryRespectful


Agree
Disagree
StronglyAgree
StronglyDisagree
Uncertain
88: Survey Response: Safety, Ward 2


Agree
Disagree
StronglyAgree
StronglyDisagree
Undecided
89: Survey Response: Affordability, Ward 2

Ward2:"Therearestrongeducational opportunitiesintheschoolswhereIlive"


Agree
Disagree
StronglyAgree
StronglyDisagree
Undecided
90: Survey Response: Educational Opportunities, Ward 2
Ward 2 survey respondents held positive opinions on the educational opportunities in their neighborhood. This is likely due to the presence of world-famous universities and nationally recognized public schools, such as the School Without Walls.

Ward2:Levelofconfidenceinyourabilityto obtainajob,orahigherpayingjob,orreceivea raisewithinthenextyear


Confident
Notveryconfident
Somewhatconfident
Uncertainofmyconfidence
Veryconfident
Ward2:ServicesRequested


EarlyHeadStart
EmergencyRentalAssistance(ERAP)
EmploymentPlacementServices
FreeIncomeTaxPreparationServices
VocationalTrainingCourse

TOOMUCHTROUBLE
NOTELIGIBLE/DIDN'TQUALIFY
LACKOFCHILDCARE
INADEQUATETRANSPORTATION
INADEQUATETRANSPORATION
IDIDN'TKNOWWHERETOGOFORHELP
HEALTH/DISABILITIESMADEITDIFFICULTTOGETTHERE


Ward 2 is an area of the District that does not request many UPO services. As a result, only three people participated as part of the focus group in the MLK Library in Chinatown. All participants were people experiencing homelessness.
When asked if politicians were addressing their concerns, one resident claimed that there was a natural distrust of politicians. Other residents agreed, saying that politicians are people, and people are difficult to trust. One resident believed that the politicians were giving fake responses.
When talking about communities, Ward 2 focus group participants feel alienated by other residents. One resident wanted to tell people benefits of “exercise, instead of smoking and drinking all day.” One resident tries to be, but they are not involved in anything, though they do try to volunteer by giving out food. One resident claimed that they were too busy to be involved in the neighborhood, but they have been in the past. They claimed that they knew how it feels to
be out in the community, though prefer to be by themselves. One resident claimed that the part of the neighborhood is now “hustle and bustle” and they didn’t want to speak about it because “they don’t want to speak about their situation.”
When discussing safety, all residents agreed there were safe and unsafe elements about living in Ward 2. One resident believed that people had the option of intervening but choose not to. One resident believes they feel completely safe, because of the police presence and “nobody says stuff to you” and you are able to do what you would like to do. Another resident believed that they felt safe in the library, but something could “pop off” anywhere.
Governance Ward 2 residents believe they could not trust politicians
Governance Ward 2 residents did not know where they could go for services
All residents who participated in the Ward 2 focus group felt a distrust of politicians
Ward 2 responses in the 2024 Community Needs Assessment survey indicated that they did not know where to go for help
Increase trust between local leaders and residents through community events, follow ups and personal connections
Increase communication from District agencies through grassroots mobilization
Systemic Barriers Low-income residents did not have the educational attainment or training to acquire a living wage job
Systemic Barriers Ward 2 homeless residents were limited by transportation
Safety Ward 2 residents feared increasing crime in the District
Homeless Ward 2 residents did not have the educational background to compete in a highly competitive labor market
Transportation for lowincome individuals was seen as expensive
Criminal activity, particularly carjackings, made media headwinds in 2023
Provide services that increase the human capital or residents through vocational training
Provide transportation stipends to low-income residents
Increase safety protocols through alternative policing methods
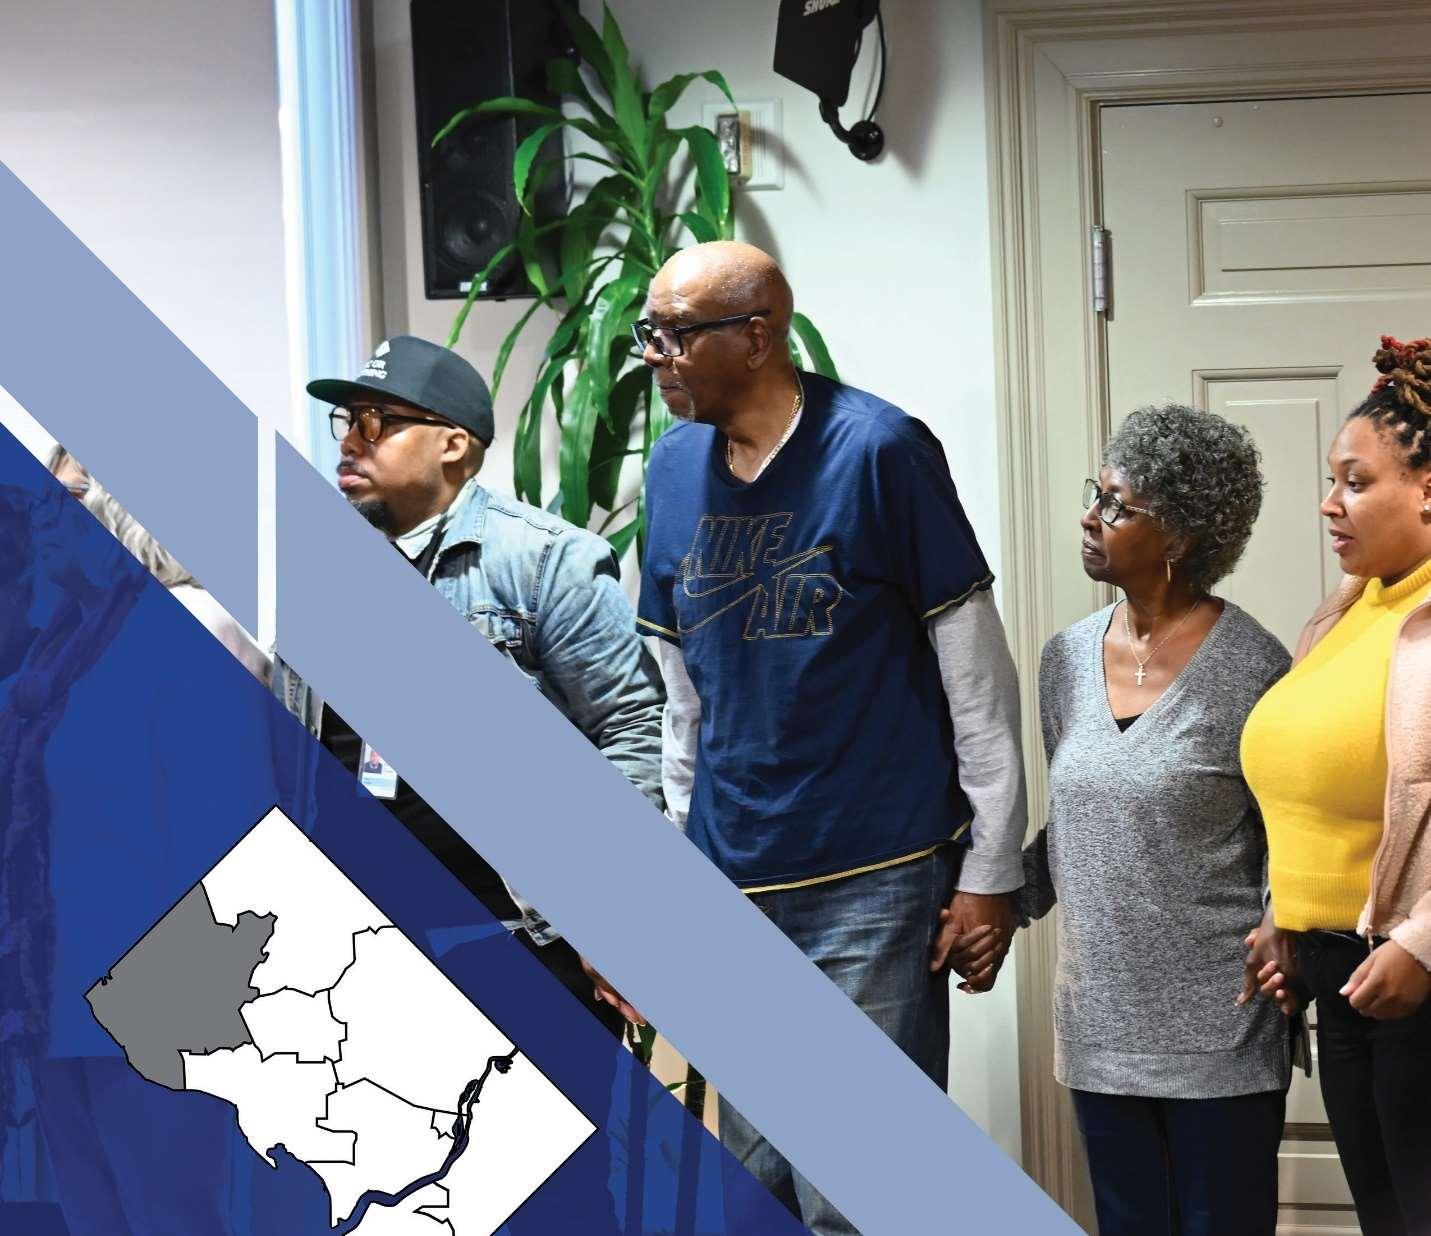

UPO did not receive a significant number of survey responses from Ward 3 residents. This is likely due to the UPO’s limited reach in this area of the District. The average Ward 3 resident is a Black female between the age of 25 and 34. Even with Ward 3 being considered the richest area of the District, many survey respondents indicated they were making less than $10,000, which may indicate a substantial number of respondents with incomes up to this amount.
PoliticalEngagementOpportunities: Initiatives to increase resident participation in local governance.
EquitableAccesstoEducation: Support services to help low-income residents access quality educational institutions.
AffordableHousingInitiatives: Expanded affordable housing options to address high living costs
RaceandEthnicity
$35,000-$49,999


Figure 93: Survey Response: Gender, Ward 3


94: Survey Response: Age, Ward 3


95: Survey Response: Marital Status, Ward 3


96: Survey Response: Race, Ward 3

Figure 97: Survey Response: Annual Income, Ward 3
Ward 3, with neighborhoods such as Cleveland Park and Tenleytown, has gained a reputation as a wealthier ward. However, poverty still exists within the geo-political boundaries. Despite the low response rate in the Ward, residents were still more likely to indicate high levels of poverty.
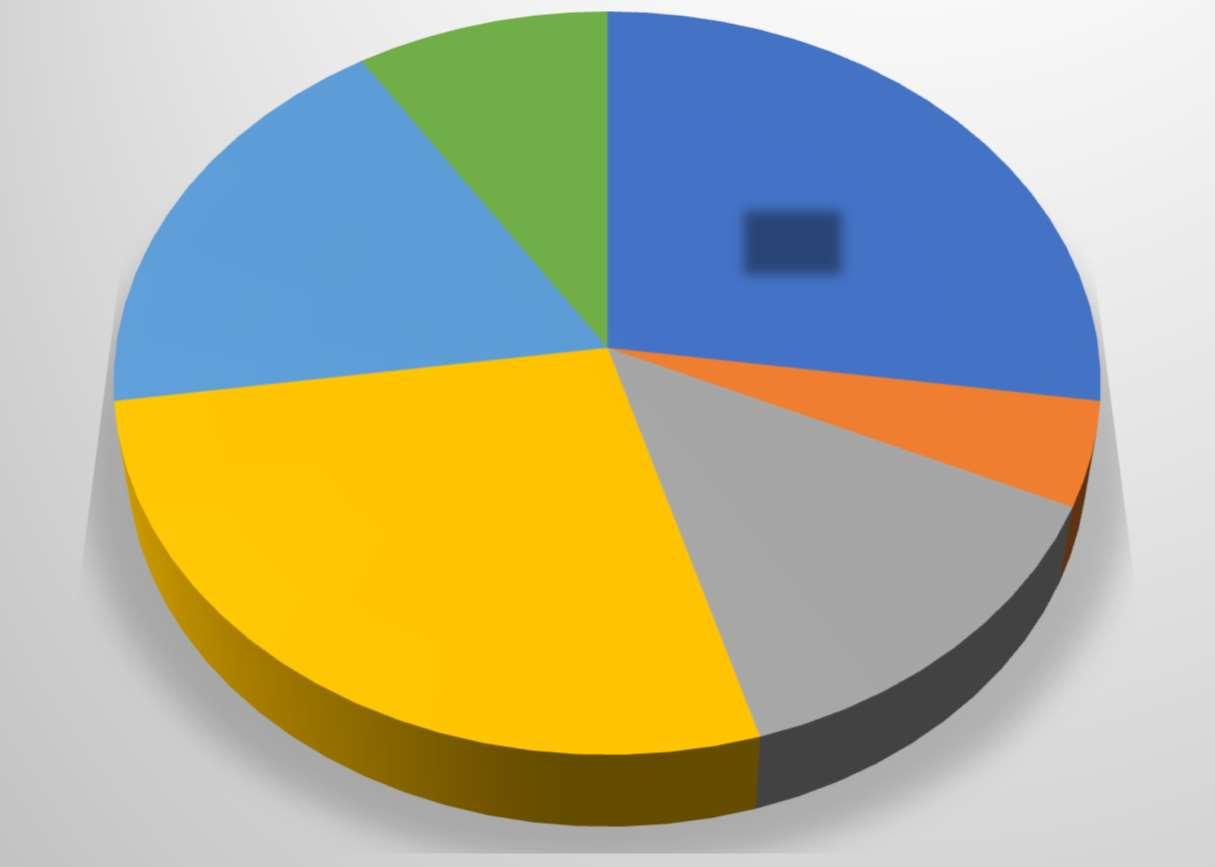


CompletedHighSchoolDiploma
CompletedTechnical/Vocational School
Earnedassociate'sdegree
Earnedbachelor'sdegree
Earnedmaster'sdegree
LessthanHighSchoolGraduate

Figure 98: Survey Response: Education Level, Ward 3
27% of Ward 3 residents had completed their bachelor’s degree. Simultaneously, 27% of Ward 3 residents had completed their high school diploma. Residents of Ward 3, based upon this survey, have the highest proportion of bachelor’s degrees in the District.


Figure 99: Survey Response: Education by Race, Ward 3
Disparities in education are a massive issue for Ward 3 residents. In a wealthy area such as Ward 3, educational process is essential for achieving economic security. However, only white residents indicated that they had completed their bachelor’s or master’s degrees. Moreover, no white residents had dropped out of high school, according to the survey results. As the cost-ofliving skyrockets in Ward 3, the District should appropriate more resources to residents with low incomes by providing aid for them to pursue college.


The unemployment rate for Ward 3 residents is significantly lower than Wards 5, 6, 7 and 8, according to census data. And due to the presence of American University, some residents are studying in university. However, UPO survey responses indicate a higher level of unemployment.


Despite zoning regulations in Ward 3 that favor the construction of single-family homes, many survey respondents indicated that they are renting. While Ward 3 is a wealthy area of the District, the government should appropriate funds to residents with lower incomes to ensure that they are not displaced by the higher levels of rent in the area.


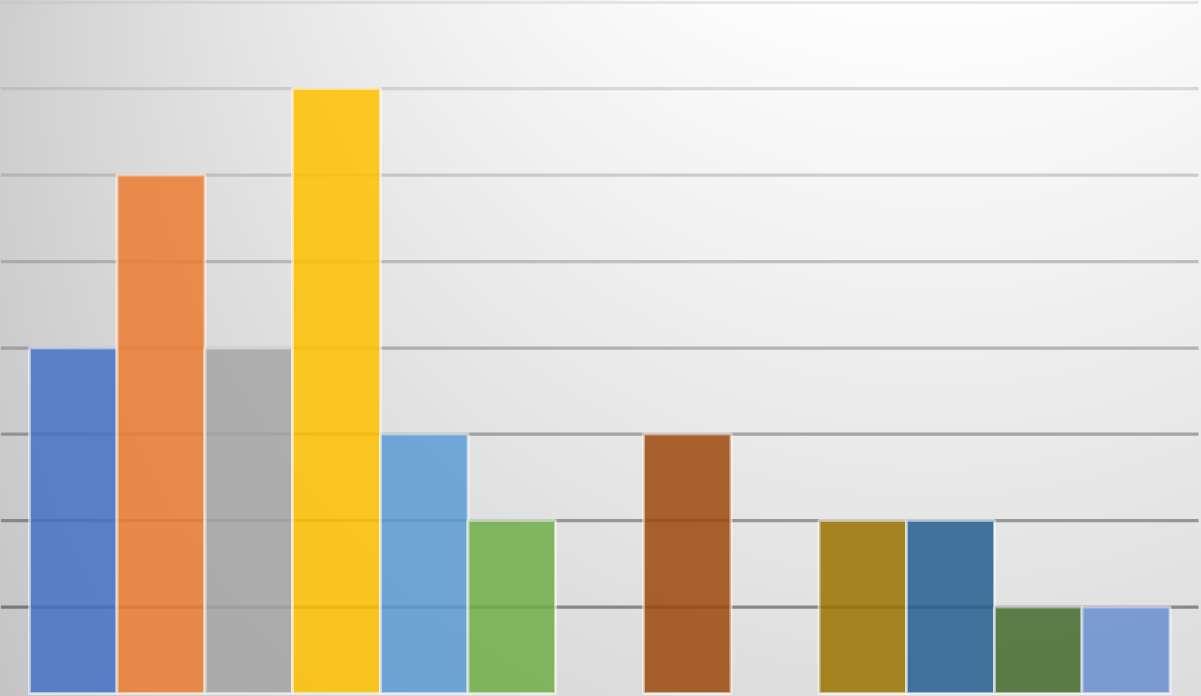

HighBloodPressure

Asthma

Diabetes

MentalIllness

LearningDisability

PhysicalDisability

HearingImpairmentorDeaf

VisionImpairmentorBlind

Alcohol/SubstanceAbuse

HIV+/AIDS
Figure 104: Survey Response: Health Conditions, Ward 3 - some respondents have multiple health conditions

Ward3:"Ifeelincludedinthedecsionsofwhat
myneighborhoodwouldlooklikeinthefuture"


105: Survey Response: Neighborhood Future, Ward 3

StronglyAgree
StronglyDisagree
Uncertain
Ward3:"Ifeelsaferinmyneighborhoodthan lastyear"


106: Survey Response: Neighborhood Safety, Ward 3
Ward3:"Howrespectfulwerepolicein interactingwithyouorothers?

Agree
Disagree
StronglyAgree
StronglyDisagree
Uncertain


107: Survey Response: Police Interaction, Ward 3
Disrespectful
Ididnotinteractwithorobservepolice
Neutral
Respectful
VeryDisrespectful

VeryRespectful


Agree
Disagree
StronglyAgree
StronglyDisagree
Undecided
Figure 108: Survey Response: Affordability, Ward 3


Agree
Disagree
StronglyAgree
StronglyDisagree
Undecided
109: Survey Response: Schools, Ward 3
Ward3:Whatisyourlevelofconfidencein yourabilitytoobtainajob,orhigherpaying job,orreceivearaise,withinthenextyear?


110: Survey Response: Job Confidence, Ward 3


Confident
Notveryconfident
Somewhatconfident
Veryconfident


111: Ward 3 - Services Requested
FoodSupport
HousingCounseling

TransportationSupport
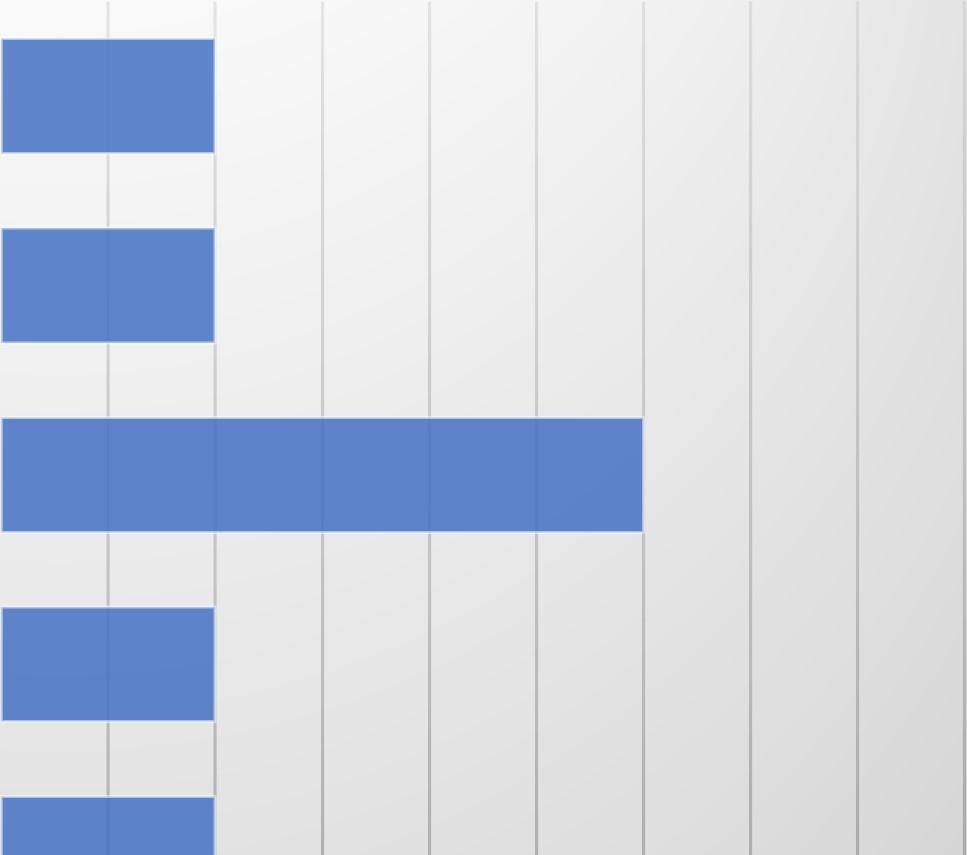
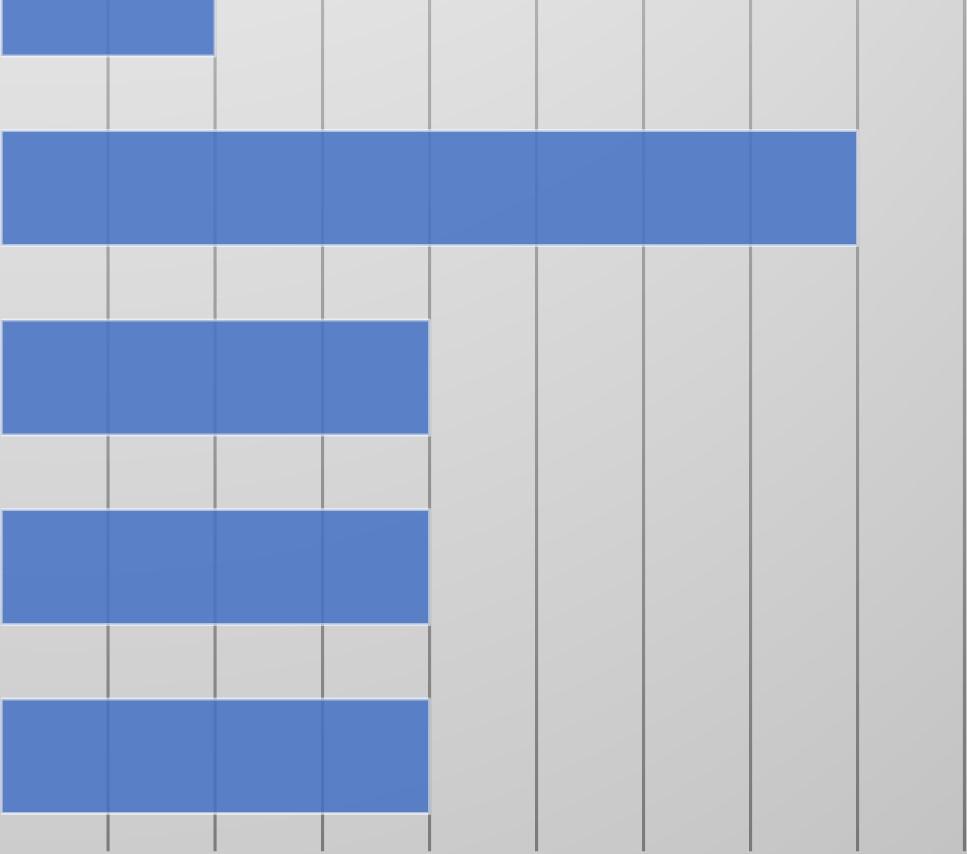

Ward 3 is the wealthiest ward in the District. Therefore, very few UPO resources are requested in this ward; UPO does not have a strong presence in the area. When the Social Science Researcher held a focus group at the Tenley-Friendship Neighborhood library, there was only one attendant. To remedy this, the Social Science Researcher held one-on-one interviews with individuals on the street and in the public library. The interviews provided insightful information on the day-to-day issues surrounding Ward 3 residents.
Residents primarily focused on affordable housing and frustrations with the current political administration, reflected in the 23% who feel that they are included in decisions about their neighborhood. All residents indicated that they have not lived in D.C. for much time, though they have noticed that the city is slow to respond to issues surrounding crime and poverty. Additionally, residents noted that while they felt safe in their community, they were aware of the “sketchy” areas around the District and that crime was not being addressed properly.
When asked about education, residents indicated that many of the educational opportunities were “elitist” and non-accessible to much of the District. One resident claimed that people who attend colleges and primary education in the area were just “using daddy’s money” to attend school.
Though Ward 3 has some of the lowest housing density in the city, residents indicated that the need for affordable housing was still prevalent, even in their neighborhoods. Like many of the focus groups, when asked about the affordable housing, residents said “there is none.”
Category
NeedIdentified
Education Expand educational opportunities to low-income residents
Governance
Ward 3 residents were not aware of the political landscape of their neighborhood
Reasoning Recommendations
Ward 3 residents believed that their academic institutions were too "elite"
Governance
Ward 3 residents wanted a more responsive government
Housing Ward 3 residents felt squeezed by housing costs
Many of the individuals participating in the focus group were transient, meaning they would not stay in the District for long
Ward 3 residents were quick to recognize issues in their communities, but they argued that political leaders were not
Ward 3 residents reported that the housing crisis had affected their neighborhood too. Younger respondents indicated frustration with older residents and the prices of homes
Employ income diversity efforts in Ward 3 to expand the number of people who have access to "privileged" economic opportunities
Increase ease of access to understanding how to connect with community and political life in Ward 3
Increase transparency and connection between residents and political leaders through townhalls and grassroots organization
Increase the affordable housing supply in Ward 3 by eliminating single family zoning and building higher density neighborhoods


The average Ward 4 resident is a single Black female aged 25 to 34 who has completed their high school education. Based on survey responses, a typical resident is unemployed, and makes less than $10,000 a year.
RepresentationandResponsivenessinGovernance: Improved communication between residents and political representatives.
CommunitySafetyEnhancements: Targeted programs for crime prevention, with a focus on vulnerable populations like the elderly.
EducationalandVocationalResources: Programs to increase educational opportunities and job training.
AffordableandSuitableHousing: Solutions to combat rising housing costs and the lack of suitable living spaces
$35,000-$49,999


112: Survey Response: Gender, Ward 4


113: Survey Response: Age, Ward 4


114: Survey Response: Marital Status, Ward 4

Ward4:Whatisyouridentifyingrace?


115: Survey Response: Race, Ward 4


$75,000-$99,999
$35,000-$49,999
$15,000-$24,999
$10,000-$14,999
LESSTHAN$10,000
$100,000-$149,999
$75,000-$99,999
$50,000-$74,999
$35,000-$49,999
$25,000-$34,999
$15,000-$24,999
$10,000-$14,999
LESSTHAN$10,000

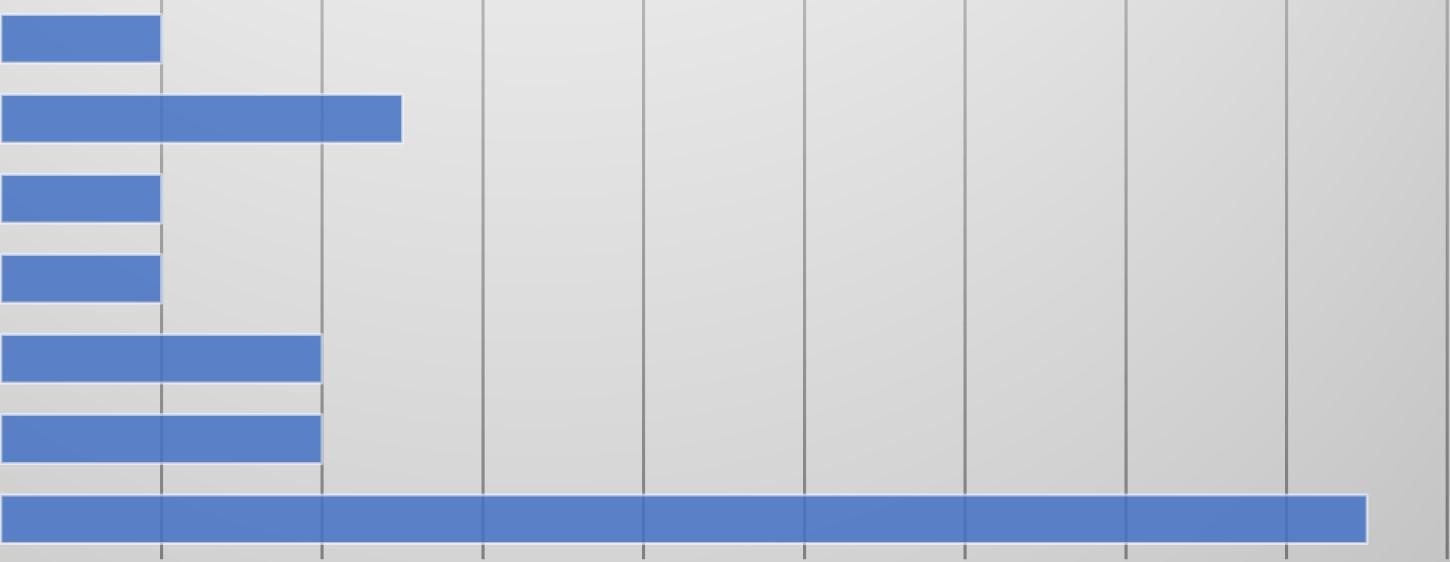
Figure 117: Survey Response: Income by Race, Ward 4
Income inequality is a pervasive issue for Black and Hispanic residents in Ward 4. White residents, though only a small sample of respondents, indicated that they earned vastly more than Black residents. Only one Black resident responded with an income over $100,000 annually.

Ward4:Pleaseindiciateyourhighesteducational level


CompletedHighSchoolDiploma
CompletedTechnical/VocationalSchool
Earnedassociate'sdegree
Earnedbachelor'sdegree
Earnedmaster'sdegree
Ward4:Whatdescribesyouremployment status?


Employedfull-time
Employedpart-time
Homemaker
MultipleJobs
Retired


Self-employed/Independent
Contractor
Student
Unemployed

Ward4:Whichofthefollowingbestdescribe yourhouseholdsituation?


Homeownerwithoutamortgage
Livingaloneandpayingrent
Livingwithothersandpayingrent
Livingwithothers,norent
Ward4:Ifyoupayrentormortgage,howmuch doyoupaypermonth?

$1,500-$1,799
$1,200-$1,499
$1,000-$1,199
$2,000+
$1,800-$2,000
$1,500-$1,799
$1,200-$1,499
$1,000-$1,199
$800-$999
$0-$799

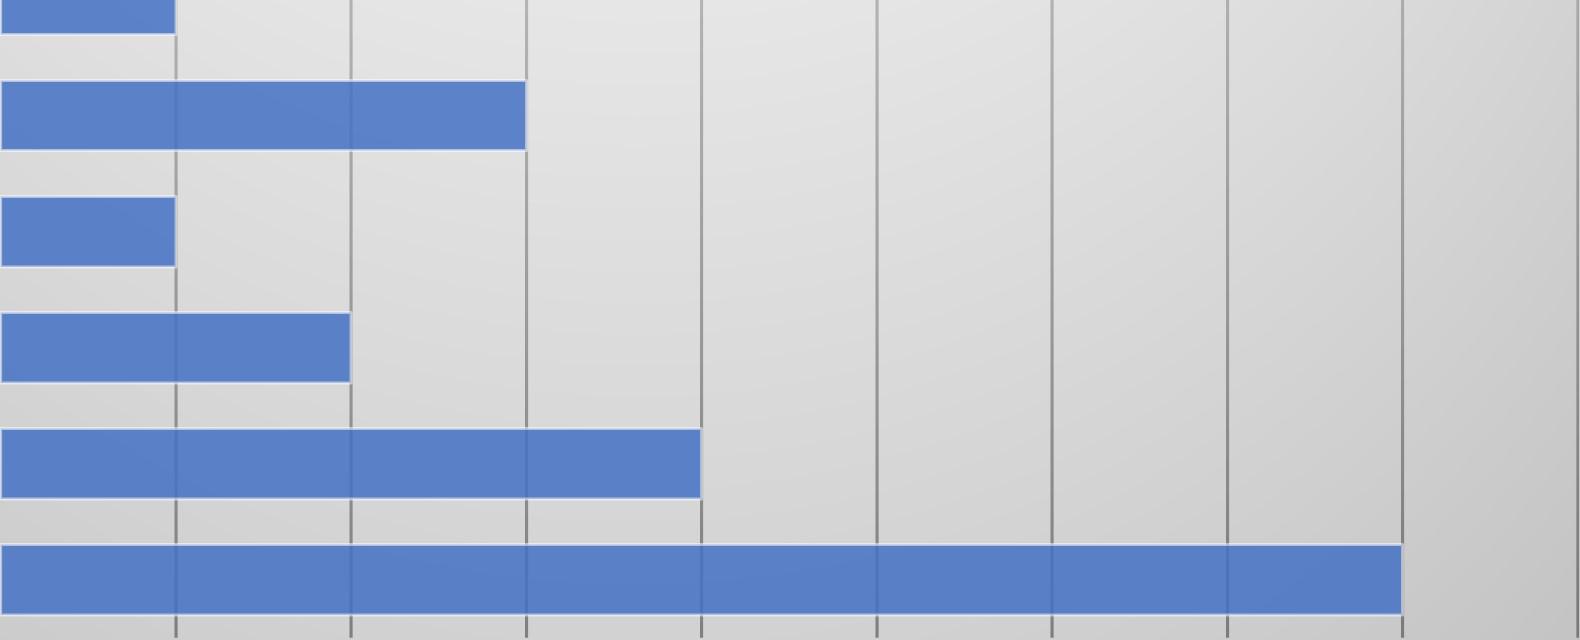
122: Survey Response: Rent Cost by Race, Ward 4
For Black respondents in Ward 4, there are a lack of affordable options available. While residents may rely on public housing support, there is a sizeable portion of Black residents who pay a significant percentage of their take-home income for rent.


123: Survey Response: Health Insurance, Ward 4

Yes,throughhealthcare.govorDC HealthLink
Yes,throughMedicaid/Medicare
Yes,throughmyemployerormy spouse'sorrelative'semployer
Many residents rely on public health services such as Medicaid and Medicare, as well as healthcare.gov or DC Health Link. Few respondents claim to rely on employers for their health insurance.

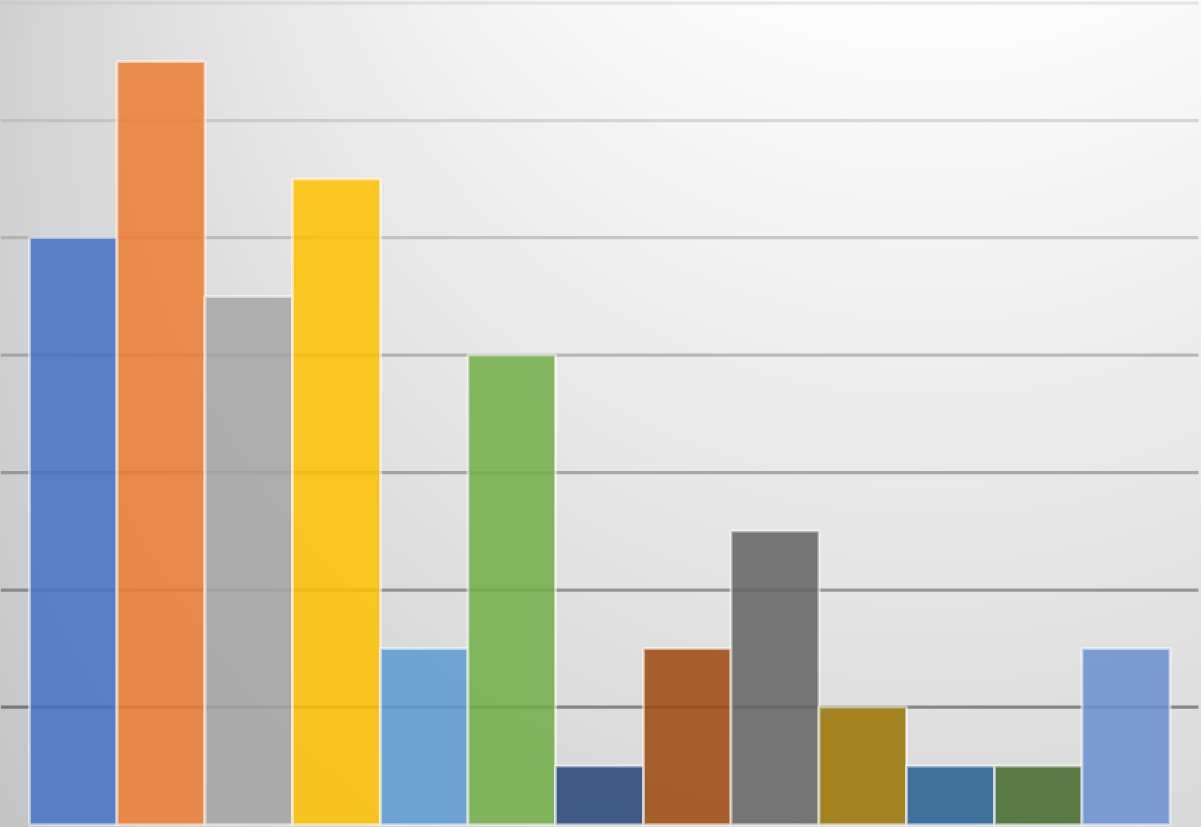

HighBloodPressure


Asthma Diabetes

MentalIllness

LearningDisability

PhysicalDisability

HearingImpairmentorDeaf

VisionImpairmentorBlind

Alcohol/SubstanceAbuse


ComplicationsduetoLongCOVID-19

Ward4:"Ifeelincludedinthedecisionsofwhat myneighborhoodwouldlooklikeinthefuture" Agree


125: Survey Response: Neighborhood Future, Ward 4

StronglyAgree
StronglyDisagree
Uncertain
Ward4:"IfeelsaferinmyneighborhoodthanI didlastyear"


126: Survey Response: Safety, Ward 4


Agree
Disagree
StronglyAgree
StronglyDisagree
Uncertain


127: Survey Response: Affordability, Ward 4


Agree
Disagree
StronglyAgree
StronglyDisagree
Undecided

Ward4:Howrespectfulwerepoliceininteracting withyouorothers?


128: Survey Response: Police, Ward 4

Disrespectful
Ididnotinteractwithorobservepolice
Neutral
Respectful
VeryDisrespectful
VeryRespectful
Ward4:"Therearestrongeducational opportunitiesattheschoolnearwhereIlive"


129: Survey Response: Educational Opportunities, Ward 4


Ward4:Whatisyourlevelofconfidenceinyour abilitytoobtainajob,ahigherpayingjob,ora raise,withinayear?


Confident
Notveryconfident
Somewhatconfident
Uncertainofmyconfidence
Veryconfident


NOTELIGIBLE/DIDN'TQUALIFY
LACKOFCHILDCARE
INADEQUATETRANSPORTATION
IDIDN'TKNOWWHERETOGOFORHELP
HEALTH/DISABILITIESMADEITDIFFICULTTOGETTHERE
HADAPRIORBADEXPERIENCE
DIDN'TWANTTOASKFORHELP
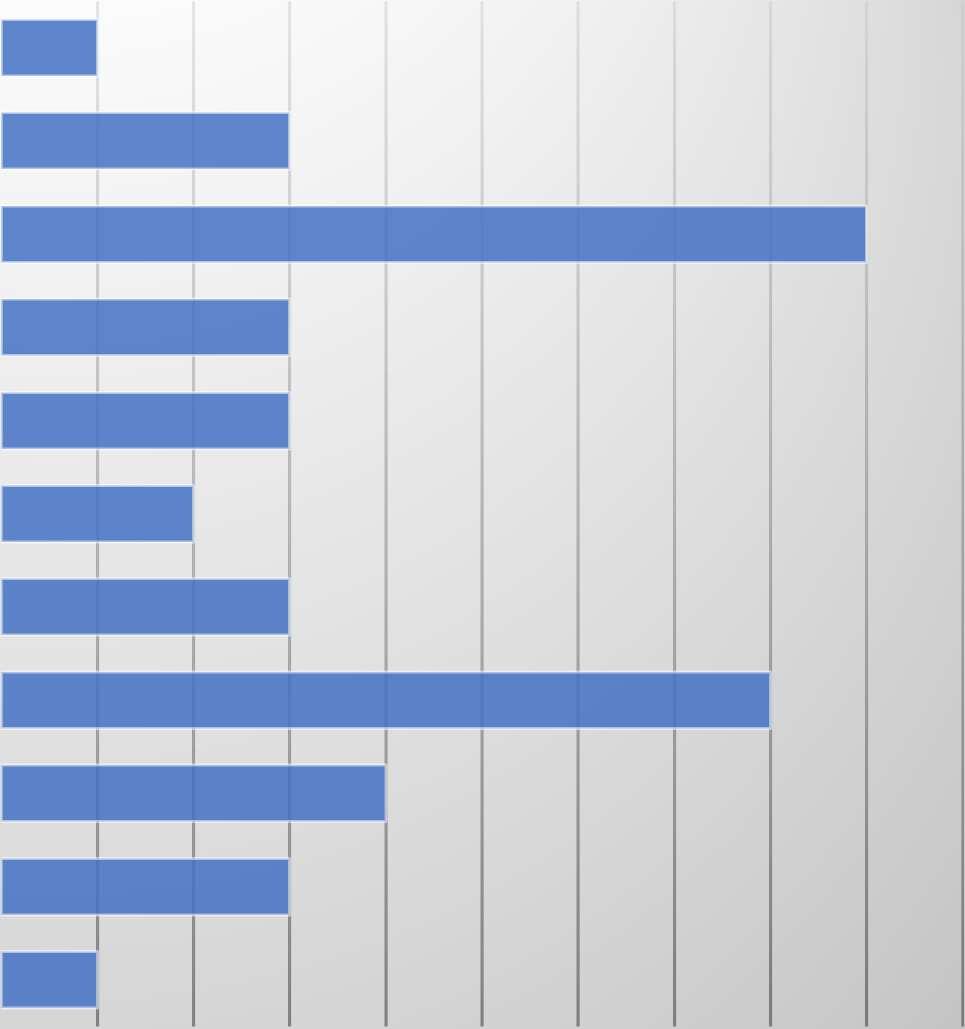
Ward 4 is another wealthy area of the District, though pockets of poverty are much more noticeable, particularly in the Sixteenth Street neighborhood and neighborhoods on the border with Maryland. These pockets of poverty disproportionately affect elderly Black residents. For this reason, UPO partnered with So Other’s Might Eat (SOME), a nonprofit organization that provides senior housing. Two individuals participated in the preliminary focus group, thus subsequent interviews were conducted.
Like many others, residents of Ward 4 did not seem to believe that the current administration is addressing their concerns. One resident noted that they was struggling to obtain healthcare of their current plan and the Department of Health had consistently turned away. One resident said they were impartial to the current administration but wished that they would focus more on education.
Residents also indicated that the connection to their community had wavered in recent years, but they attributed the fall off to their age. Despite this, residents wished that there were more opportunities available for residents to interact with one another. A resident said that there were too many small shops and apartment buildings, and no community centers.
Ward 4 residents agreed that the city has become increasingly unsafe in recent years, especially for seniors. One resident noted that they no longer walk around with headphones or feel safe leaving their home due to what they have seen online.
Residents note that their living conditions are suitable. While there are some issues with traffic and public transportation, their apartments are clean and there are little to no issues with pest, heating or package delivery.
One resident was part of the education system before they retired. They said that the educational opportunities in the District had been taken away a few years ago. They claimed that there was not a sufficient method of evaluating teachers and that many teachers were too prioritized on standardized tests.
Nearly all residents indicated that some kind of community space would be beneficial to their neighborhoods. Older residents noted that there were limited opportunities for seniors in their neighborhoods and there were not enough spaces for families and children to have fun.
Like all the focus groups, Ward 4 residents took issue with the housing situation in the District. One resident was in a non-profit elderly home, and claimed that they were ready to move, but were struggling due to the high cost of living in D.C. One resident claimed that the affordable housing available was not adequate.
Category
NeedIdentified
Health Ward 4 residents struggle with Asthma
Reasoning Recommendations
The number one health issue facing survey respondents was Asthma
Health Elderly Ward 4 residents struggled to navigate Medicare Ward 4 residents received little assistance from DC agencies to receive healthcare
Systemic Barriers
Low-income Ward 4 residents did not have the educational attainment or vocational training to compete in the District's labor market
Governance Ward 4 residents felt disconnected from politicians
Most residents who requested services wanted vocational training support
Older Ward 4 residents participating in the focus group said they rarely hear from politicians
Decrease the cost of asthma related drug prices and increase the availability of primary care
Hold District agencies accountable when a citizen reaches out to them
Increase the number of individuals enrolled in vocational training courses through stipend support
Increase trust between politicians and residents through town halls and other community events
Housing Low-income Ward 4 residents rely on public subsidized housing or affordable housing
Elderly low-income residents struggle to pay market rents. Some cannot move to market rent apartments from public housing.
Ensure subsidized housing for low-income residents while rehabilitating existing public housing units


The average Ward 5 resident is a single Black female who has completed their high school diploma and is between the ages of 35 and 44. Typically they make less than $10,000 a year and has health insurance through Medicaid or Medicare.
GovernmentTransparencyandTrust-Building: Efforts to strengthen trust and communication between officials and residents.
CommunitySafetyandSecurity: Increased community policing and initiatives to reduce crime rates.
PrimaryEducationInvestment: Enhanced resources and support for primary schools.
AffordableHousingAccess: Strategies to counter rising rents and prevent displacement due to gentrification


133: Survey Response: Age, Ward 5


134: Survey Response: Marital Status, Ward 5


Ward5:Whatisyouridentifyingrace?


135: Survey Response: Race, Ward 5


Twoormoreraces
White

$200,000+
$100,000-$149,999
$75,000-$99,999
$50,000-$74,999
$35,000-$49,999
$25,000-$34,999
$200,000+
$100,000-$149,999
$75,000-$99,999
$35,000-$49,999
$15,000-$24,999
$10,000-$14,999
$200,000+
$150,000-$199,999
$100,000-$149,999
$75,000-$99,999
$50,000-$74,999
$35,000-$49,999
$25,000-$34,999
$15,000-$24,999
$10,000-$14,999
LESSTHAN$10,000
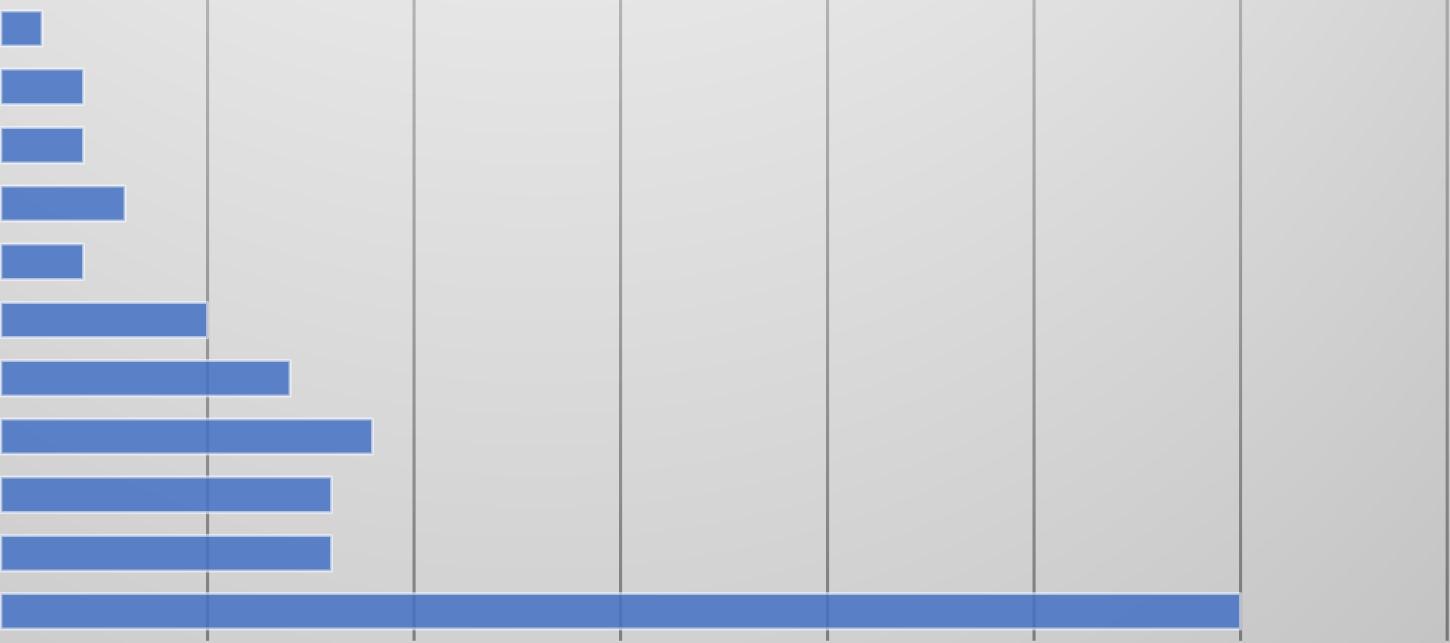
Figure 136: Survey Response: Income by Race, Ward 5 Ward 5 residents, particularly low-income Black residents, face stark income inequity. Many Black Ward 5 residents reported making less than $50,000 a year. Ward 5 has been a prominent Black part of the District for decades now, according to the Community Impact Facilitator. However, many residents do not receive the services that are needed to achieve economic security, due to the proportion of individuals in poverty being even higher across the river. Of the 32 individuals who earned less than $10,000 annually, 30 were Black.


CompletedHighSchoolDiploma
CompletedTechnical/Vocational School
Earnedassociate'sdegree
Earnedbachelor'sdegree
Earnedmaster'sdegree
LessthanHighSchoolGraduate

EARNEDBACHELOR'SDEGREE
COMPLETEDHIGHSCHOOLDIPLOMA
LESSTHANHIGHSCHOOLGRADUATE
EARNEDMASTER'SDEGREE
EARNEDBACHELOR'SDEGREE
COMPLETEDHIGHSCHOOLDIPLOMA
EARNEDMASTER'SDEGREE
EARNEDBACHELOR'SDEGREE
COMPLETEDHIGHSCHOOLDIPLOMA
EARNEDMASTER'SDEGREE
EARNEDBACHELOR'SDEGREE
COMPLETEDHIGHSCHOOLDIPLOMA
EARNEDBACHELOR'SDEGREE
COMPLETEDHIGHSCHOOLDIPLOMA
EARNEDMASTER'SDEGREE 18-2425-3435-4445-6465-84
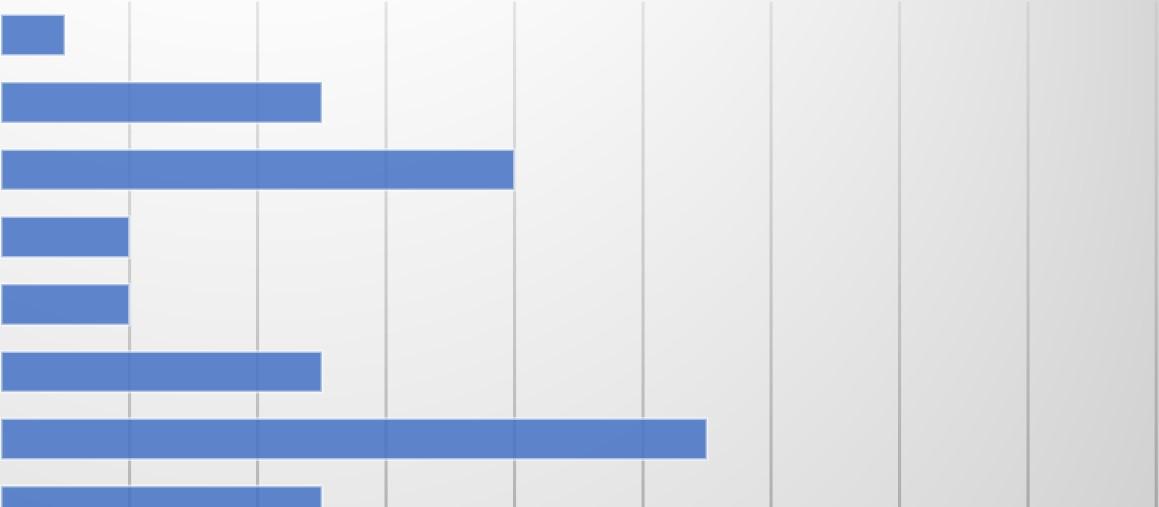
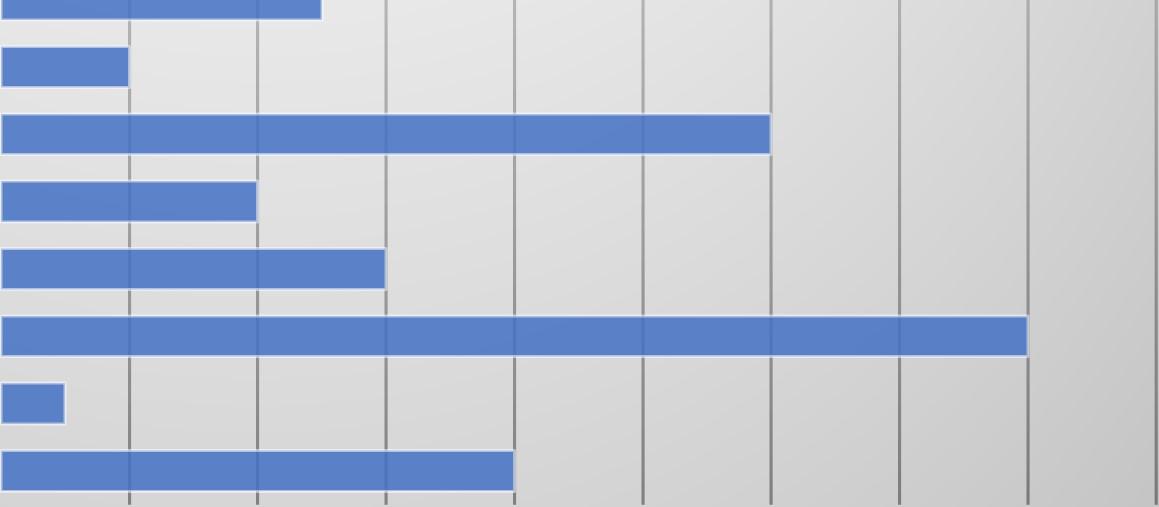
Figure 139: Survey Response: Education by Age, Ward 5
Compared to Wards 1, 2, 3 and 4, young adults (18-34) have a lower rate of higher education attainment. Despite this, younger adults were more likely to have completed their bachelor’s degree or master’s degree by older adults.


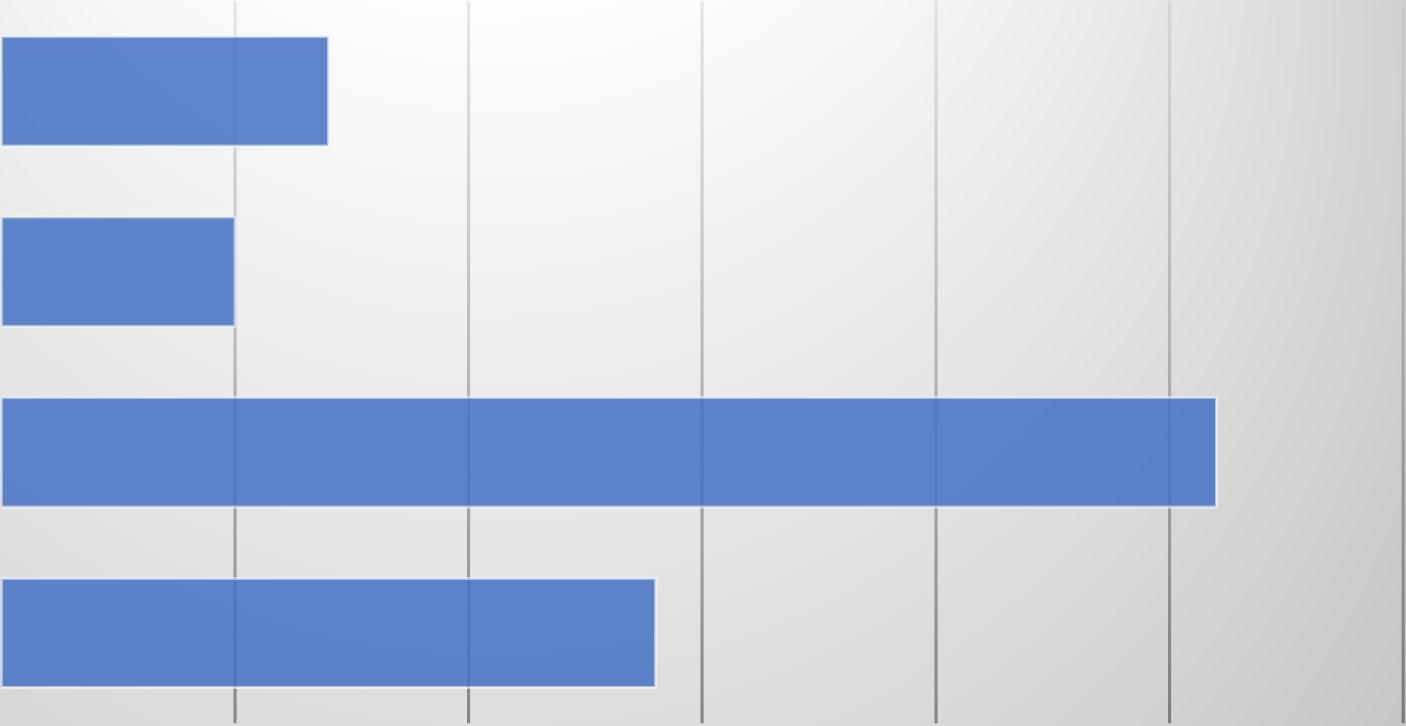

While both Hispanic and white residents have been able to achieve employment, a majority of Black residents are currently unemployed. This is a significant barrier to overcome to achieve economic security, and employment is a top concern for the Community Impact Facilitator.
Ward5:Whichofthefollowingbestdescribes


Ward5:Ifyoupayrentoramortgage,how muichdoyoupaypermonth?

$2,000+
$1,500-$1,799
$1,000-$1,199
$800-$999
$2,000+
$1,500-$1,799

$1,000-$1,199


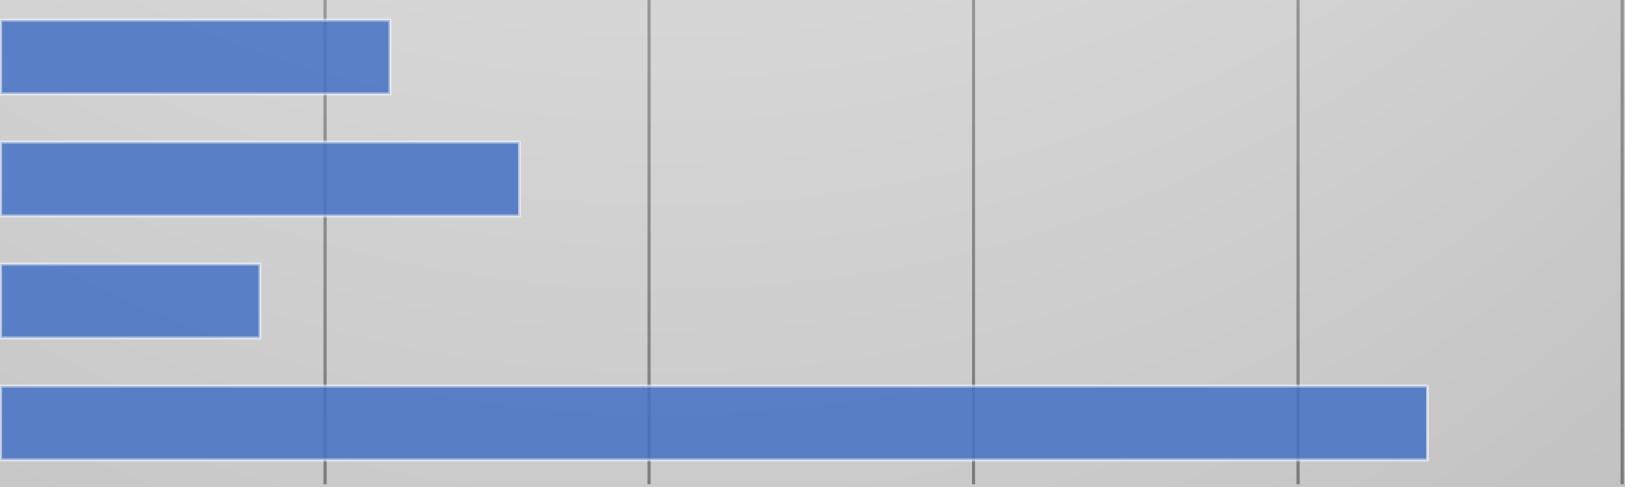
Figure 144: Survey Response: Rent by Race, Ward 4
Black residents overwhelmingly rely on affordable housing to continue to reside in the District. While white residents, based on the survey response, tend to pay higher rents, the majority of Black Ward 5 residents pay less than $800 a month on housing supply.

$2,000+
$1,200-$1,499
$1,000-$1,199
$800-$999
$0-$799
$2,000+
$1,500-$1,799
$1,000-$1,199
$800-$999
$0-$799
$2,000+
$1,800-$2,000
$1,500-$1,799
$1,200-$1,499
$1,000-$1,199
$0-$799
$2,000+
$1,800-$2,000
$1,500-$1,799
$1,200-$1,499
$1,000-$1,199
$800-$999
$0-$799
$1,500-$1,799
$1,000-$1,199
$800-$999
$0-$799
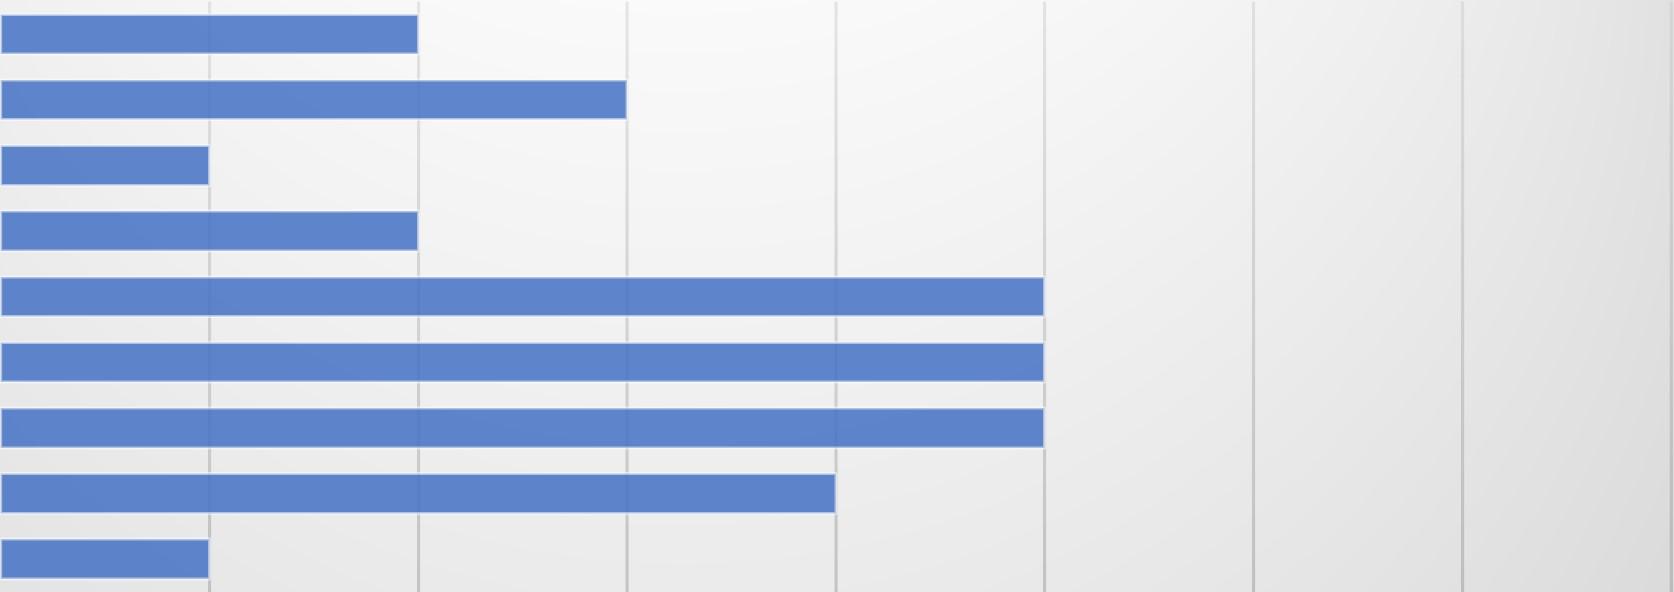
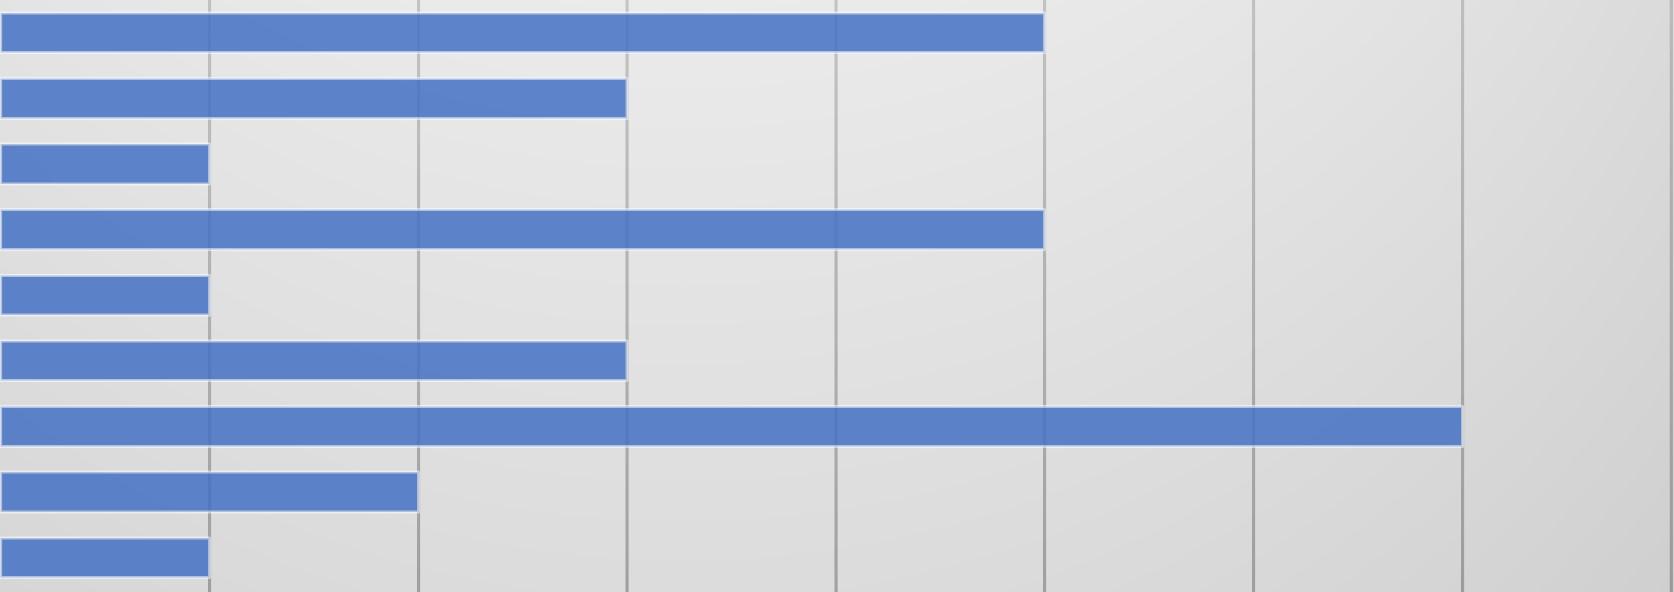

Figure 145: Survey Response: Rent by Age, Ward 5
Affordable rents are evenly distributed throughout much of Ward 5, however, middle aged (3544) individuals are more likely to have access to more affordable rent, according to the survey responses. However, individuals aged 25-34 are more likely than other age groups to pay upwards of $1,500 in rent, per month. The financial squeeze from rent can prevent some residents from achieving economic security, especially where options are scant elsewhere.


Yes,throughhealthcare.govorDC HealthLink
Yes,throughMedicaid/Medicare
Yes,throughmyemployerormy spouse'sorrelative'semployer

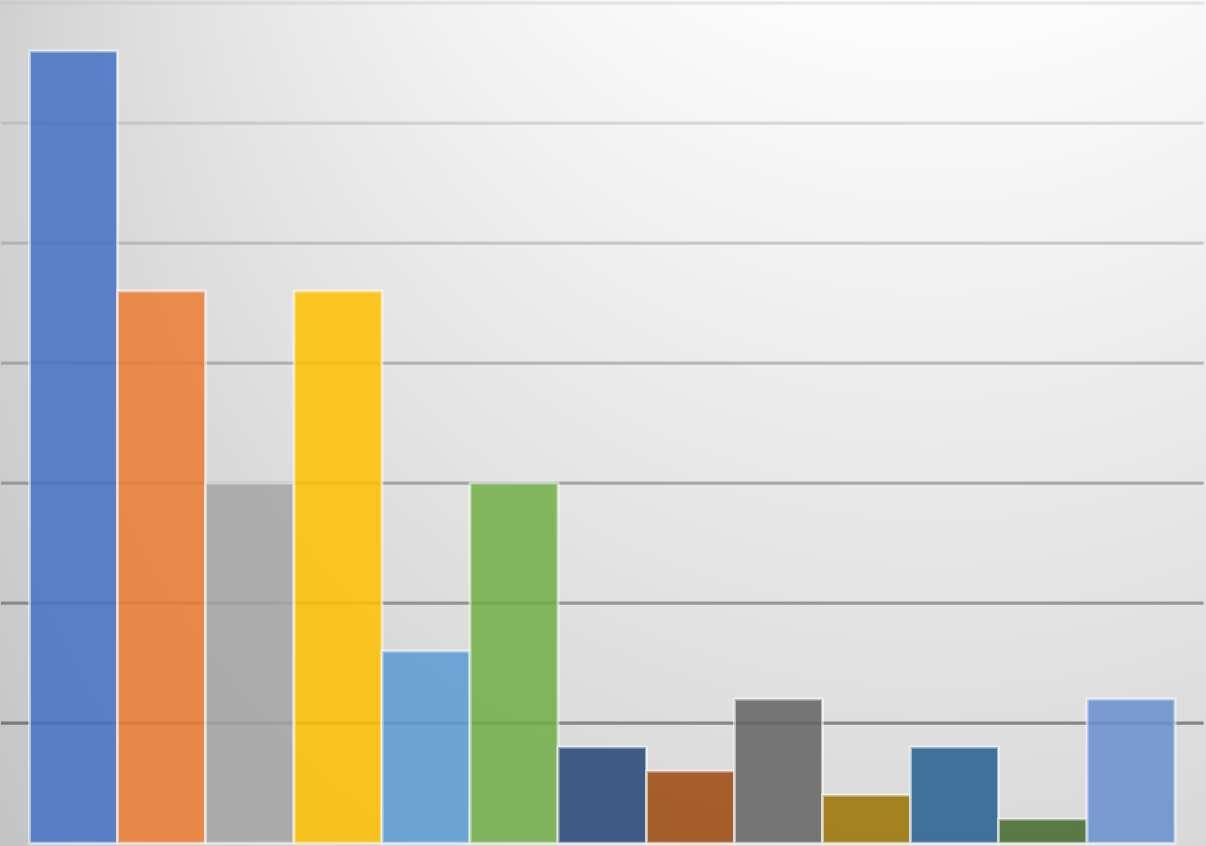

HighBloodPressure

Asthma

Diabetes

MentalIllness

LearningDisability

PhysicalDisability

HearingImpairmentorDeaf

VisionImpairmentorBlind

Alcohol/SubstanceAbuse

HIV+/AIDS


ComplicationsduetoLongCOVID-19 Cancer

Ward5:"Ifeelincludedinthedecisionsof whatmyneighborhoodwouldlikeinthe future?"


148: Survey Response: Neighborhood Future, Ward 5
Agree
Disagree
StronglyAgree
StronglyDisagree
Uncertain


149: Survey Response: Safety, Ward 5


Agree
Disagree
StronglyAgree
StronglyDisagree
Uncertain
Ward5:Howrespectfulwerepolicein interactingwithyouorothers?


Figure 150: Survey Response: Police Interaction, Ward 5

Disrespectful
Ididnotinteractwithorobserve police
Neutral
Respectful
VeryDisrespectful
VeryRespectful

Ward5:"Icanaffordtocontinuetoliveinmy neighborhood" Agree Disagree


151: Survey Response: Affordability, Ward 5

StronglyAgree StronglyDisagree Undecided
Ward5:"Therearestrongeducational opportunitiesattheschoolsnearwhereIlive"


StronglyAgree
StronglyDisagree
Undecided

Ward5:Whatisyourconfidenceinyourability toobtainajob,orahigherpayingjob,ora receivearaise,withinthenextyear?


Confident
Notveryconfident
Somewhatconfident
Uncertainofmyconfidence
Veryconfident


CareerLeadershipAcademy
DigitalLiteracy
EarlyHeadStart
ElectronicBenefitsTransfer(EBT)Services
EmergencyRentalAssistance(ERAP)
EmploymentPlacementServices
FinancialLiteracy
FoodSupport
FosterGrandParents
FreeIncomeTaxPreparationServices
HousingCounseling
PermanentHousingSupport
ShelterHotline
TransportationSupport
VocationalTrainingCourse
VolunteerOpportunities

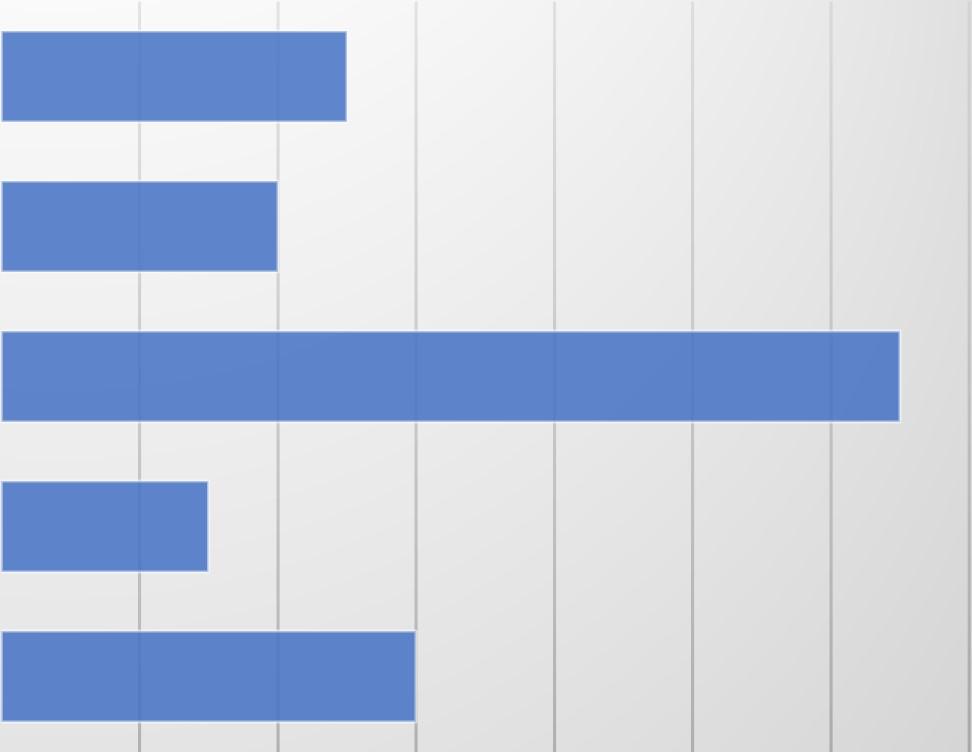
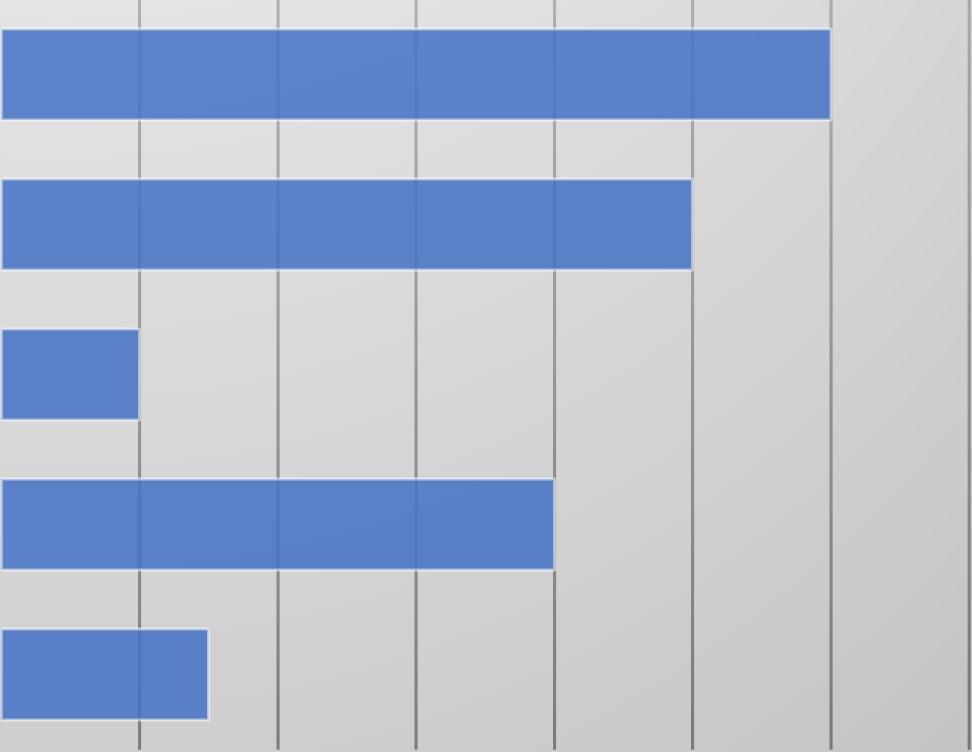
The Ward 5 focus group had the largest number of attendees (12) and featured a diverse range of people from varying demographics.
Ward 5 residents were frustrated with being “bounced” around by the current government administration. Many participating in the focus group indicated that government officials were involved in a “pony show” where officials show up to resident meetings to save face. Residents have grown frustrated at the lack of response and poor communication. One resident claimed that service was better for white residents.
Ward 5 residents noted that “it takes a village” to raise a member of their community. They prided themselves on their ability to embrace all people in the area. Despite the positive
sentiment, some members of the group grew frustrated that people “living outside the community” were using Ward 5 resources, which a resident noted were scant to begin with.
Residents in Ward 5 did not feel safe in their neighborhood. Residents claimed that there were plenty of police officers on their streets, but their presence did not alleviate any concerns involving crime. Some residents were concerned about potential carjackings in their neighborhood, as carjackings have been an issue across the entire city. All residents agreed that a stronger community could help residents feel safer.
Opinions on living conditions were split. Some residents believed that their living situation was adequate, while others indicated that their living conditions were poor. All residents were concerned about gentrification in the neighborhood.
Residents claim that primary school resources are not evenly distributed across the District, especially in Ward 5. The perceived development led to residents believing that children were being left behind in their education.
If there was a vacant lot of land on their block, residents of Ward 5 would like to see a community space where children could be taught in safety. One resident said, “not another condo.”
All residents laughed when asked about housing affordability in their neighborhood. “There is none” one resident responded. Many residents indicated that they were paying increases in rent despite the perceived quality of the neighborhood decreasing. Residents felt strongly that they were paying too much money for substandard housing and government services.
“Community” was a major theme throughout this Brentwood focus group, and many residents considered it a key aspect of ensuring safety and education for their children.
Category NeedIdentified
Governance Ward 5 residents struggle to contact DC government officials for specific issues
Governance Black Ward 5 residents are hesitant to request services
Systemic Barriers Ward 5 residents struggle to obtain employment
Systemic Barriers Ward 5 residents are struggling with the costof-living crisis in the District
Safety Ward 5 residents are concerned about the increase in crime
Education Ward 5 residents do not see equal access to education resources
Reasoning
Ward 5 residents have grown frustrated with poor communication from DC government officials and have been "bounced around"
Black Ward 5 residents feel left behind by the current administration
Ward 5 residents do not have the educational attainment or vocational skills to compete in the DC labor market
Residents feel like they are paying too much for rent and food
Residents fear carjackings, robberies and other crimes in the area
Few residents were able to pursue higher education, or complete high school in the focus group and survey response
Recommendations
Re-establish trust between government officials and Ward 5 residents through community events
Increase transparency between residents and government officials
Strengthen vocational training opportunities through UPO's Workforce Institute
Housing Ward 5 residents do not believe that their housing is affordable
Ward 5 residents who do not have access to affordable housing feel like they are rent burdened
Provide and expand rent subsidies to low-income communities
Increase presence of violence interrupters and alternative policing methods
Increase transparency between residents and school staff, ensure students are able to graduate and receive additional resources for their education
Improve and finance rental emergency assistance programs like ERAP and strengthen rent control and tenants’ rights
Housing Ward 5 residents are concerned about expanding gentrification in their neighborhood
Ward 5 residents who participated in the focus group fear that they will not be able to afford their neighborhood in the future
Limit the spread of gentrification by solidifying existing affordable housing in the area while also expanding existing rent subsidies for struggling residents

The average Ward 6 resident is a single Black female who has completed their high school diploma and his between the ages of 35 and 44. Typically they make less than $10,000 a year and have health insurance through Medicaid or Medicare.
ResponsiveLocalRepresentation: More visible and engaged local officials.
YouthCrimePrevention: Initiatives focusing on juvenile crime prevention and rehabilitation.
EducationalAdvancementPrograms: Expanded access to continuing education and job training services.
ImprovedHousingConditions: Addressing substandard living conditions in public housing
$75,000-$99,999


155: Survey Response: Gender, Ward 6


156: Survey Response: Age, Ward 6


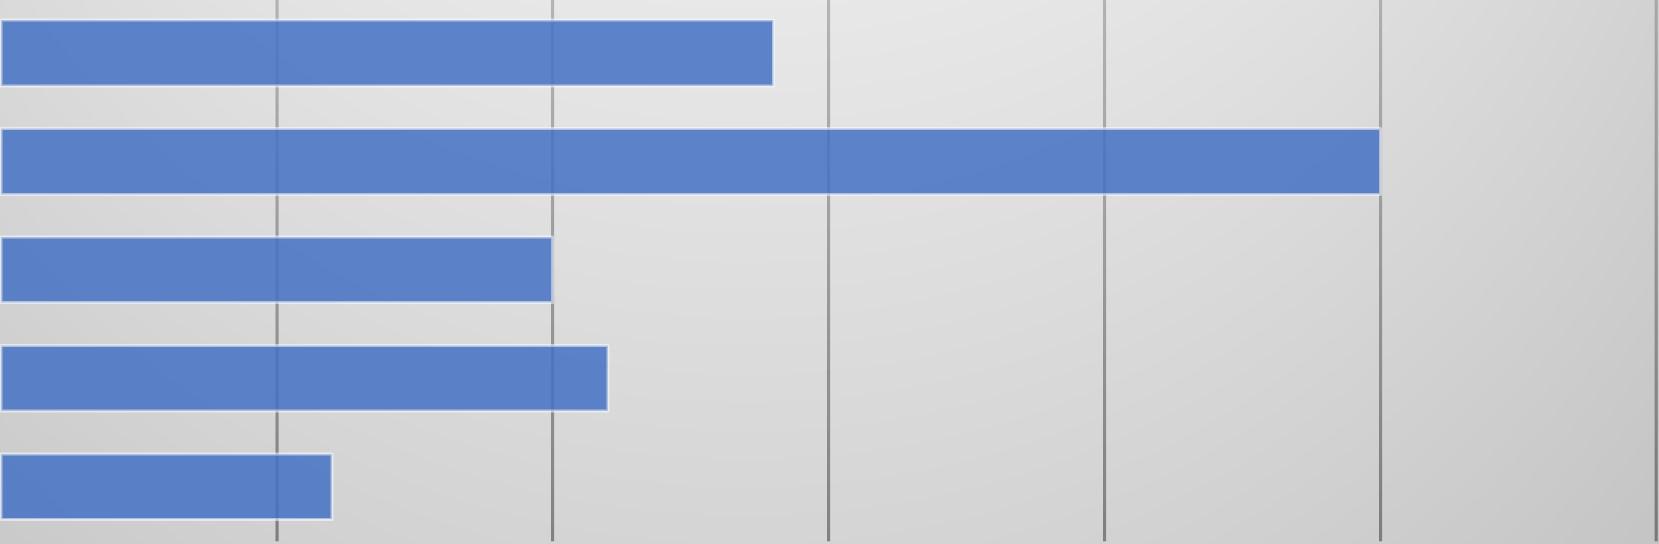
Figure 157: Survey Response: Age by Gender, Ward 6
UPO primarily received responses from older adults (45-64), as well as some seniors in Ward 6. This is because UPO provides services in the Buzzard Point community, which has a high number of older individuals. Buzzard Points have high poverty rates and high unemployment
rates, which are particularly prolific among Black, female seniors.


Figure 158: Survey Response: Marital Status, Ward 6
Ward6:Whatisyouridentifyingrace?

Divorced Married
Partnered
Seperated Single


Figure 159: Survey Response: Race, Ward 6

AmericanIndianorAlaskaNative
Black
Twoormoreraces
White
Figure 160: Survey Response: Annual Income, Ward 6


Figure 161: Survey Response: Black Annual Income, Ward 6
Lessthan$10,000
$10,000-$14,999

$25,000-$34,999
$35,000-$49,999
$50,000-$74,999
$75,000-$99,999
$15,000-$24,999
$200,000+
For the Black residents in Ward 6, those who survive on less than $10,000 a year made up many survey respondents. This is likely due to the number of retirees surveyed. In addition, the
overwhelming response from residents with low-income shows that policies like Medicaid/Medicare, and Society Security are crucial for older populations.

Ward6:Pleaseindicateyourhighest educationallevel?


CompletedHighSchoolDiploma
CompletedTechnical/Vocational School
Earnedassociate'sdegree
Earnedbachelor'sdegree
Earnedmaster'sdegree
LessthanHighSchoolGraduate
Figure 162: Survey Response: Educational Level, Ward 6

Ward6:Whatbestdescribesyouremployment status?


Figure 163: Employment Status, Ward 6
Ward 6 respondents were more likely to report being retired than other wards. This is likely due to many of the responses coming from the Buzzard Point neighborhood, where Greenleaf Senior Living Facility is located.
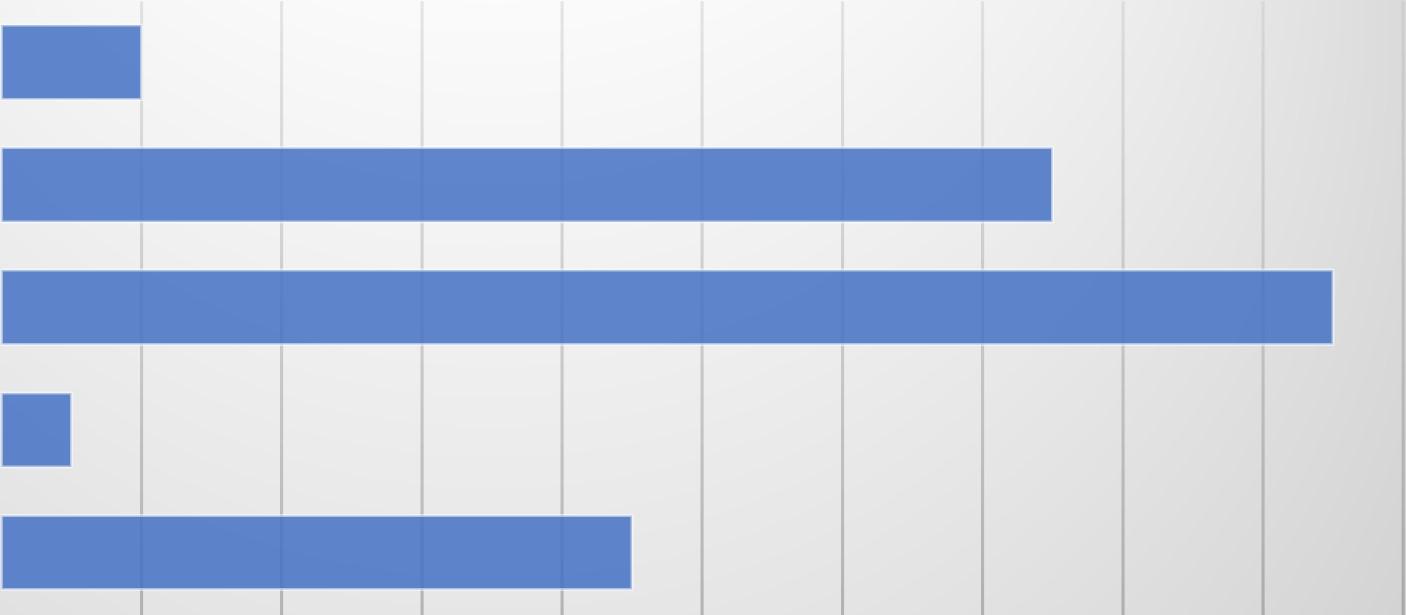
EMPLOYEDFULL-TIME

EMPLOYEDFULL-TIME EMPLOYEDFULL-TIME

Figure 164: Survey Response: Employment by Age, Ward 6
Figure 166 further highlights the importance of social support for both seniors and retirees. As individuals aged 18-24 were fully employed, the majority of elderly residents had retired. However, this means wrapping around employment services may not be useful for this age demographic. Rather, UPO should focus on providing immediate aid for necessities such as food distribution or rent aid.
Ward6:Whichofthefollowingbestdescribes yourhouseholdsituation?


165: Household Situation, Ward 6


Livingaloneandpayingrent
Livingwithothersandpayingrent
Livingwithothers,norent

LIVINGWITHOTHERSANDPAYINGRENT
LIVINGALONEANDPAYINGRENT
HOMEOWNERWITHOUTAMORTGAGE
HOMEOWNERPAYINGAMORTGAGE
LIVINGWITHOTHERS,NORENT
LIVINGWITHOTHERSANDPAYINGRENT
LIVINGALONEANDPAYINGRENT
HOMEOWNERWITHOUTAMORTGAGE
HOMEOWNERPAYINGAMORTGAGE
CURRENTLYEXPERIENCINGHOMELESSNESS
LIVINGWITHOTHERS,NORENT
LIVINGWITHOTHERSANDPAYINGRENT
LIVINGALONEANDPAYINGRENT
CURRENTLYEXPERIENCINGHOMELESSNESS
LIVINGWITHOTHERSANDPAYINGRENT
LIVINGALONEANDPAYINGRENT
LIVINGWITHOTHERS,NORENT
LIVINGWITHOTHERSANDPAYINGRENT
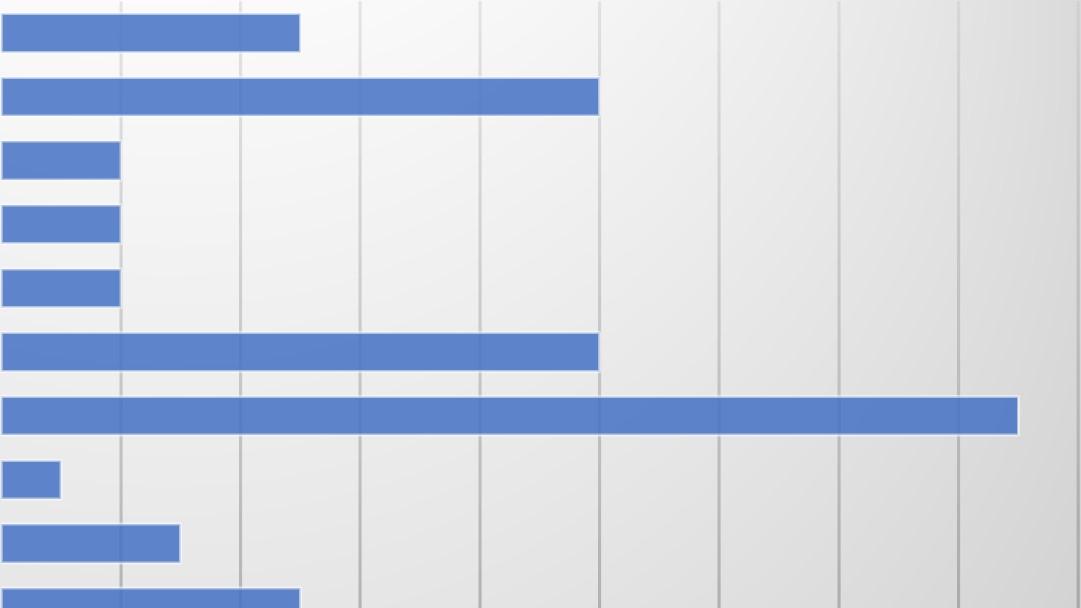
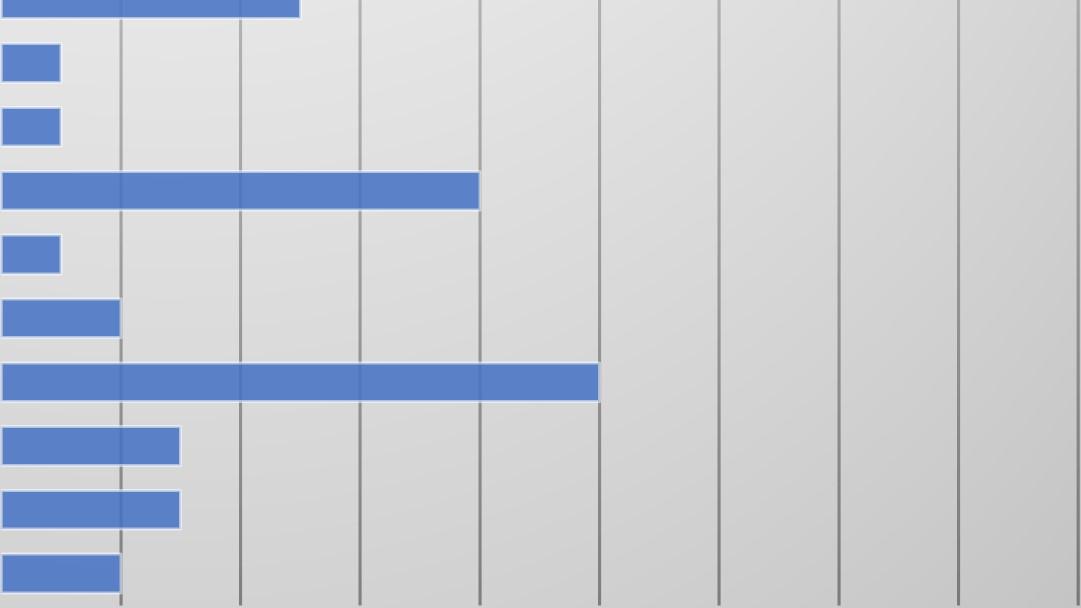
Many seniors living in Ward 6 rent alone or with others. In fact, most residents living in Ward 6 rent and live alone. This is likely due to the available public housing allowing for individuals to afford apartments without roommates.
Ward6:Ifyoupayrentoramortgage,how muchdoyoupaypermonth?


Figure 167: Survey Response: Rent, Ward 6


$0-$799
$800-$999
$1,000-$1,199
$1,200-$1,499
$1,500-$1,799
$1,800-$2,000
$2,000+


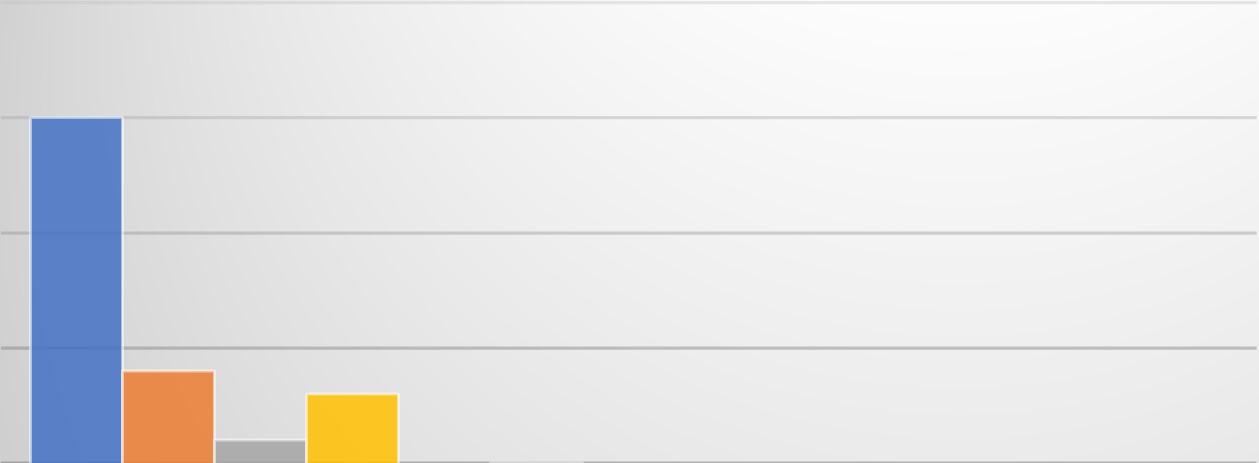
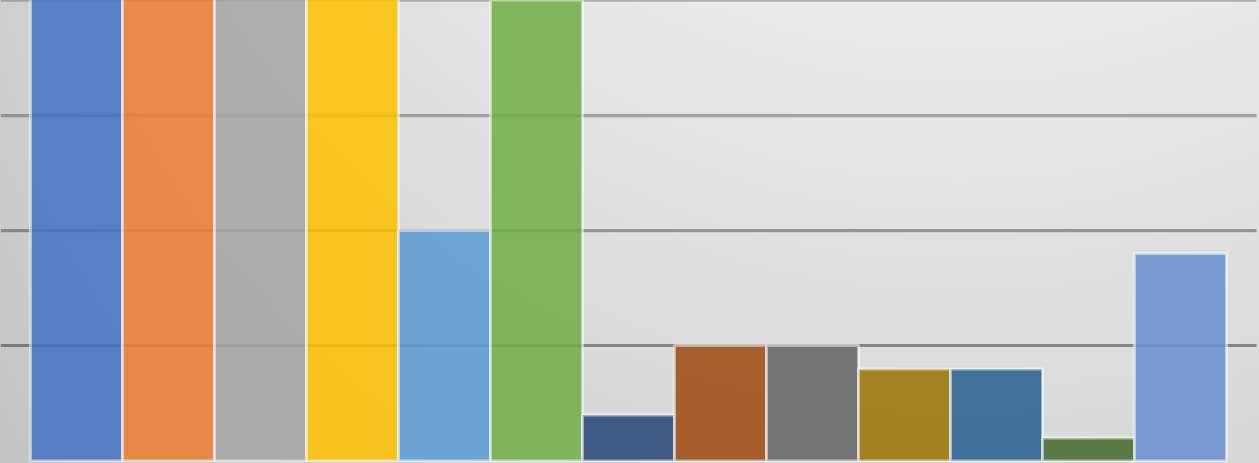

HighBloodPressure

Asthma

Diabetes

MentalIllness

LearningDisability

PhysicalDisability

HearingImpairmentorDeaf

VisionImpairmentorBlind

Alcohol/SubstanceAbuse

HIV+/AIDS

Cancer

ComplicationsduetoLongCOVID-19

Other

Ward6:"Ifeelincludedinthedecisionsof whatmyneighborhoodwouldlooklikeinthe future?


Agree
Disagree

StronglyAgree
StronglyDisagree
Uncertain

Ward6:"IfeelsaferinmyneighborhoodthanI didlastyear"


Agree
Disagree
StronglyAgree
StronglyDisagree
Uncertain
Ward6:Howrespectfulwerepolicein interactingwithyouorwithothers?


Agree
Disagree
StronglyAgree
StronglyDisagree
Uncertain

Ward6:"Therearestrongeducational opportunitiesinmyneighborhood"


Agree
Disagree
StronglyAgree
StronglyDisagree
Undecided


Figure 174: Survey Response: Affordability, Ward 6
Agree
Disagree
StronglyAgree
StronglyDisagree
Undecided


Ward6:Whatisyourlevelofconfidenceinyour abilitytoobtainajob,orahigherpayingjob,or receivearaise,withinthenextyear?


Confident
Notveryconfident
Somewhatconfident
Uncertainofmyconfidence
Veryconfident
175: Survey Response: Job Confidence, Ward 6


TOOMUCHTROUBLE
SERVICESAVAILABLEDURINGLIMITEDHOURS
NOTELIGIBLE/DIDN'TQUALIFY
LACKOFCHILDCARE
LACKOFCHILDCARE
INADEQUATETRANSPORTATION
IDIDN'TKNOWWHERETOGOFORHELP
HEALTH/DISABILITIESMADEITDIFFICULTTOGETTHERE
HADAPRIORBADEXPERIENCE
DIDN'TWANTTOASKFORHELP
CONCERNABOUTCONFIDENTIALITY
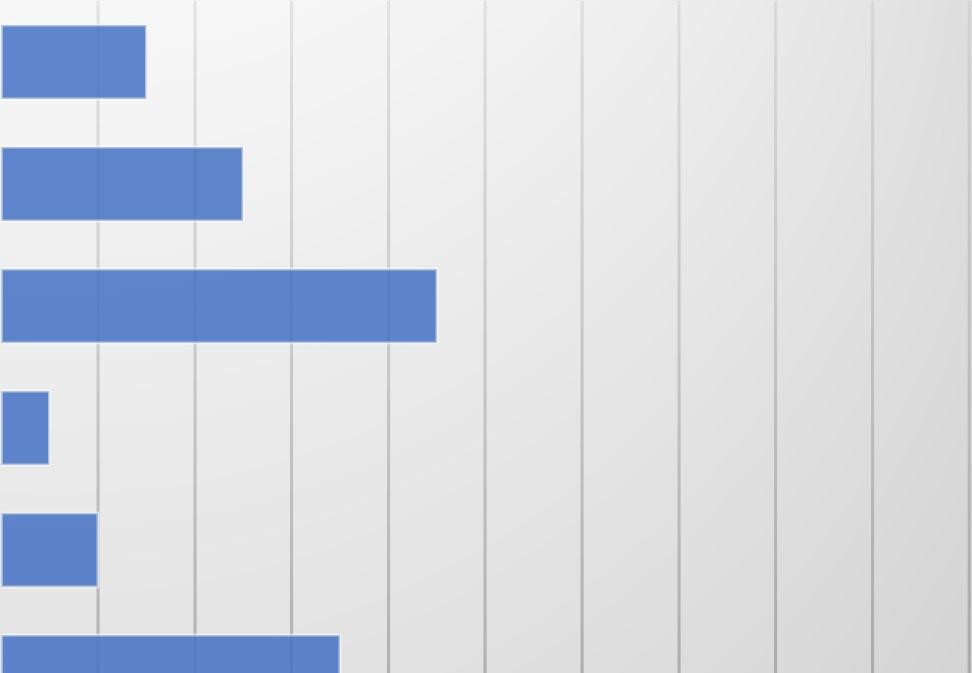
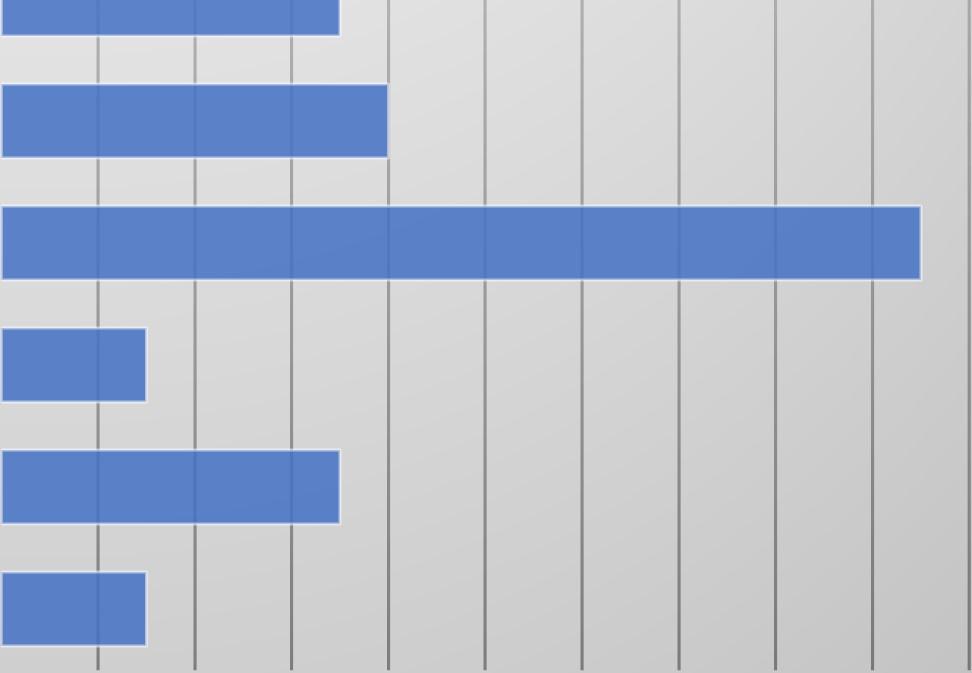
Ward 6 is often served by the UPO Community Impact Facilitator in the Buzzard Point Neighborhood at the Greenleaf Senior Center. All participants were residents of Greenleaf Senior and were familiar with UPO services. There were 12 participants in total. All participants were senior residents.
Ward 6 residents had grown frustrated with the current political climate in DC. One resident said that they had voted for a representative twice but would not be doing so again. They cited crime and the alleged corruption associated with the city’s expansion of luxury apartments. One resident claimed that D.C. was trying to push low-income Black residents out of their neighborhoods. Some residents have had face to face conversations with council members.
Some council members received much praise from the residents. “I like [them]” one resident commented, as a councilmember had come to their home to discuss their housing issues.
The Ward 6 participants were heavily involved in their community. One resident had been volunteering with UPO for several years and routinely canvased across the neighborhood to let the residents know of the programs and services that UPO offered. Many residents were interested in tenants’ associations. Additionally, many members of the focus group claimed to be a part of local food drives and food bank distribution. When prompted if volunteering helped foster a sense of community, most of the residents agreed.
Many residents were passionate about the ongoing criminal activity in their neighborhood. One resident, especially passionate, noted that much of the issues that residents were facing with crime stemmed from a lack of proper parenting. Many residents agreed with the sentiment. “There needs to be more resources for the parents” one resident chimed. One resident advocated for parental punishment for children that were considered acting out. Another resident claimed that parents should note when their child comes home in a nice car despite not having a job.
When asked about their living conditions, many residents felt frustrated about their situation in a public apartment. Two residents claimed that they would have never moved into public housing and that their life would be better off, with one resident indicating that they would be better off having stayed in Maryland. Residents complained of rats being an issue in the public housing building. One resident claimed that they were being regulated by DCHA. Every move they made, they claimed, was being observed by DCHA. One resident complained that it was near impossible to invite guests into their building and that management would hit residents with unnecessary fines if they did not report their guests to management.
Ward 6 residents advocated for more focus on education in their neighborhood. One resident argued that once the elementary school was removed from their neighborhood, there was a significant increase in crime. One resident commented that resources to obtain educational degrees were limited greatly. Two residents commented that UPO should return to continue helping residents obtain degrees like their GED.
When asked about a vacant lot in their neighborhood, there were a variety of answers that residents gave. One resident asked for a new pool to be built. Another asked for a UPO building. Two residents discussed the importance of mom-and-pop shops in their neighborhood. But by far the most discussed topic was the importance of a recreational center in the neighborhood.
Residents wanted a place for children to learn about the history of the neighborhood or where families could go to receive programs.
All residents believed that living in DC had gotten too expensive. One resident commented that after visiting an open house, they were appalled at the asking price: $3,500 a month. “No one can afford that!” they claimed. Residents also claimed that the affordable housing that was available was not up-to-par with private buildings.
“Community” was the primary focus of Ward 6 residents, with the topic of conversation permeating topics of safety, housing and schooling.
Ward 6 Needs and Recommendations
Category NeedIdentified
Governance Ward 6 residents are being left behind by local officials
Safety Ward 6 residents are directly impacted by rising juvenile criminal activity
Systemic Barriers Ward 6 residents struggle to achieve employment due to a lack of educational background
Systemic Barriers Ward 6 residents struggle with the rise in the cost of living
Healthcare Ward 6 residents require assistance through public healthcare services
Housing Ward 6 public housing residents feel limited by DCHA
Reasoning
Ward 6 residents reported feeling frustrated with local officials, as they rarely made an appearance in the area
Ward 6 residents believe that the current administration is not doing enough to curb the rise in crime
Few residents have the opportunity to seek living wage jobs
Recommendations
Increase local officials appearances in Ward 6, beyond election season.
Increase the presence of alternative policing methods and increase police presence where elderly are concentrated
Increase vocational training and employment placement services
Many residents are unable to connect with affordable options for food and rent
Many Ward 6 survey respondents indicated they had high blood pressure, asthma and diabetes
Residents complain of high rent costs and poor living conditions
Expand existing services such as ERAP or SNAP
Expand existing public healthcare options for low-income residents
Rehabilitate DCHA units without displacing existing residents


The average Ward 7 resident is a single Black female who has completed their high school diploma and his between the ages of 35 and 44. Typically they make less than $10,000 a year and have health insurance through Medicaid or Medicare.
AwarenessofServicesandPoliticalEngagement: Programs to inform residents about services and boost civic participation.
CrimeReductionInitiatives: Community safety measures to address crime concerns.
EmploymentandEducationOpportunities: Enhanced job training and educational resources for economic mobility.
ProtectionfromGentrificationandHousingAffordability: Policies to ensure affordable housing remains accessible
$35,000-$49,999
$100,000-$149,999
$150,000-$199,999


Figure 179: Survey Response: Marital Status, Ward 7


Divorced
Married
Partnered
Seperated
Single
Widowed


Figure 180: Survey Response: Race, Ward 7
AmericanIndianorAlaskaNative Black
Hispanic

NativeHawaiian
Other
Twoormoreraces
White
Ward 7 respondents were mostly Black, female residents. This does not differ from the other wards surveyed.


Lessthan$10,000
$10,000-$14,999
$15,000-$24,999
$25,000-$34,999
$35,000-$49,999
$50,000-$74,999
$75,000-$99,999
$100,000-$149,999
$150,000-$199,999
$200,000+

Figure 181: Survey Response: Annual Income, Ward 7
$100,000-$149,999
$50,000-$74,999
$35,000-$49,999
$25,000-$34,999
$15,000-$24,999
$10,000-$14,999
LESSTHAN$10,000
$150,000-$199,999
$100,000-$149,999
$75,000-$99,999
$50,000-$74,999
$35,000-$49,999
$25,000-$34,999
$15,000-$24,999
$10,000-$14,999
LESSTHAN$10,000
$200,000+
$100,000-$149,999
$75,000-$99,999
$50,000-$74,999
$35,000-$49,999
$25,000-$34,999
$15,000-$24,999
$10,000-$14,999
LESSTHAN$10,000
$200,000+
$100,000-$149,999
$75,000-$99,999
$50,000-$74,999
$35,000-$49,999
$25,000-$34,999
$15,000-$24,999
$10,000-$14,999
LESSTHAN$10,000
$75,000-$99,999
$35,000-$49,999
$25,000-$34,999
$15,000-$24,999
$10,000-$14,999
LESSTHAN$10,000


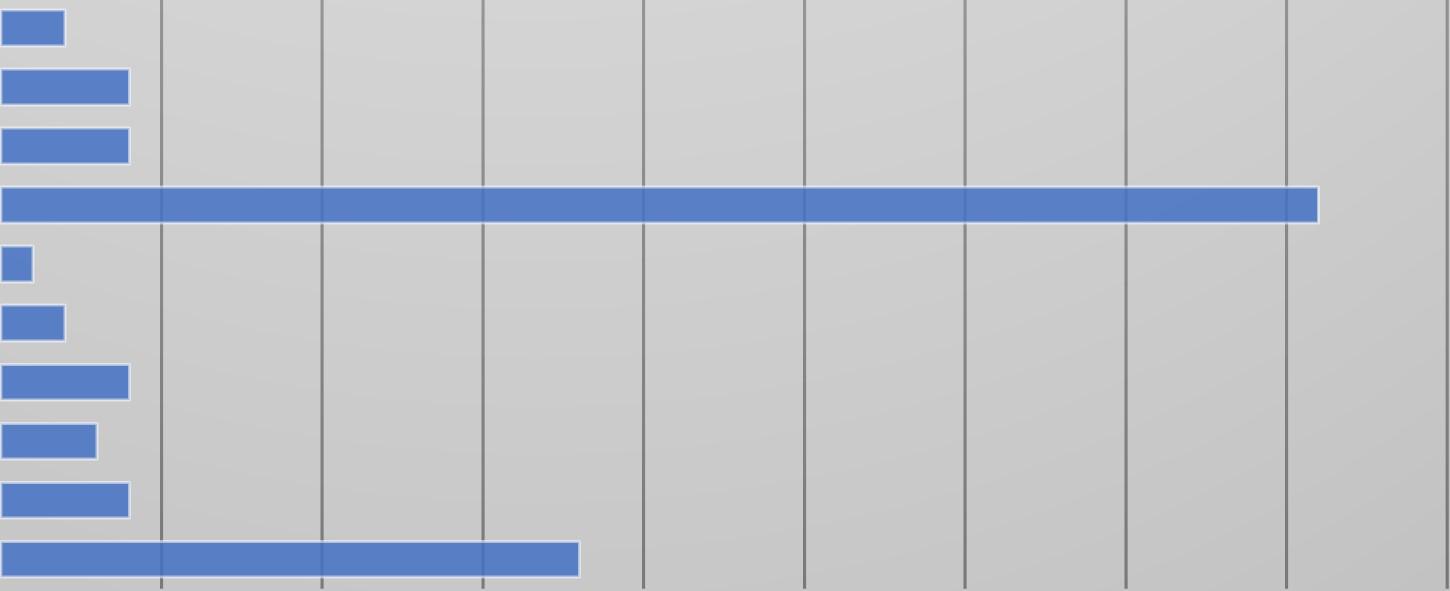
Across all ages, the vast majority of respondents in Ward 7 said that they make less than $10,000 a year.
Ward7:Pleaseindicateyourhighest educationallevel?


Figure 183: Survey Response: Educational Level, Ward 7
EARNEDMASTER'SDEGREE
EARNEDBACHELOR'SDEGREE
COMPLETEDHIGHSCHOOLDIPLOMA
LESSTHANHIGHSCHOOLGRADUATE
EARNEDMASTER'SDEGREE
EARNEDBACHELOR'SDEGREE
COMPLETEDHIGHSCHOOLDIPLOMA
LESSTHANHIGHSCHOOLGRADUATE
EARNEDMASTER'SDEGREE
EARNEDBACHELOR'SDEGREE
COMPLETEDHIGHSCHOOLDIPLOMA
LESSTHANHIGHSCHOOLGRADUATE
EARNEDMASTER'SDEGREE
EARNEDBACHELOR'SDEGREE
COMPLETEDHIGHSCHOOLDIPLOMA
LESSTHANHIGHSCHOOLGRADUATE
EARNEDBACHELOR'SDEGREE
COMPLETEDHIGHSCHOOLDIPLOMA

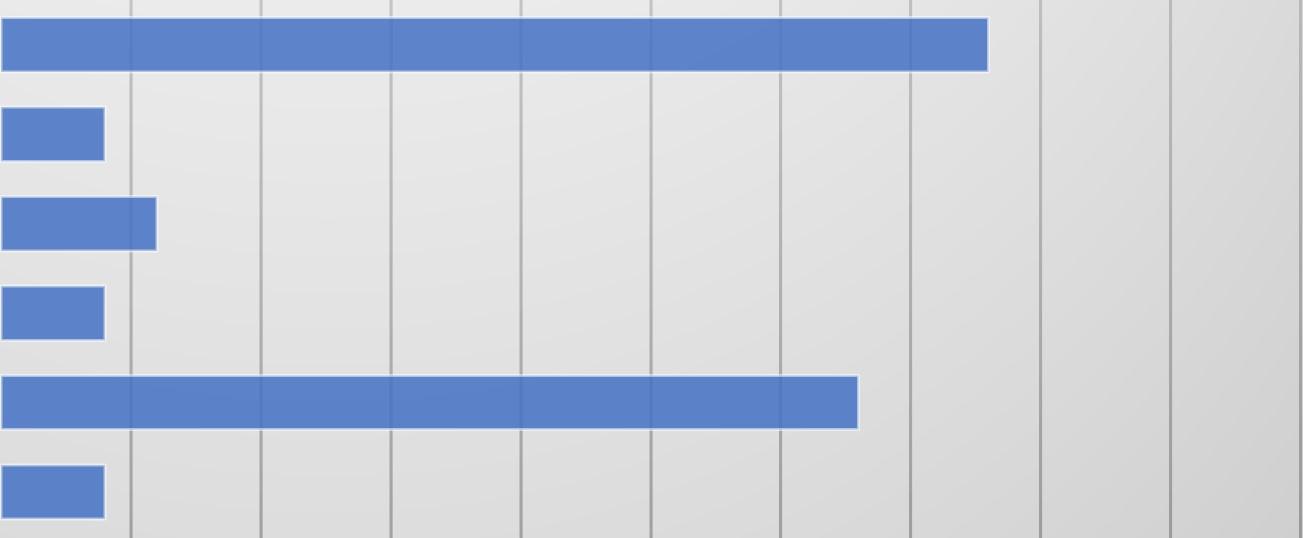
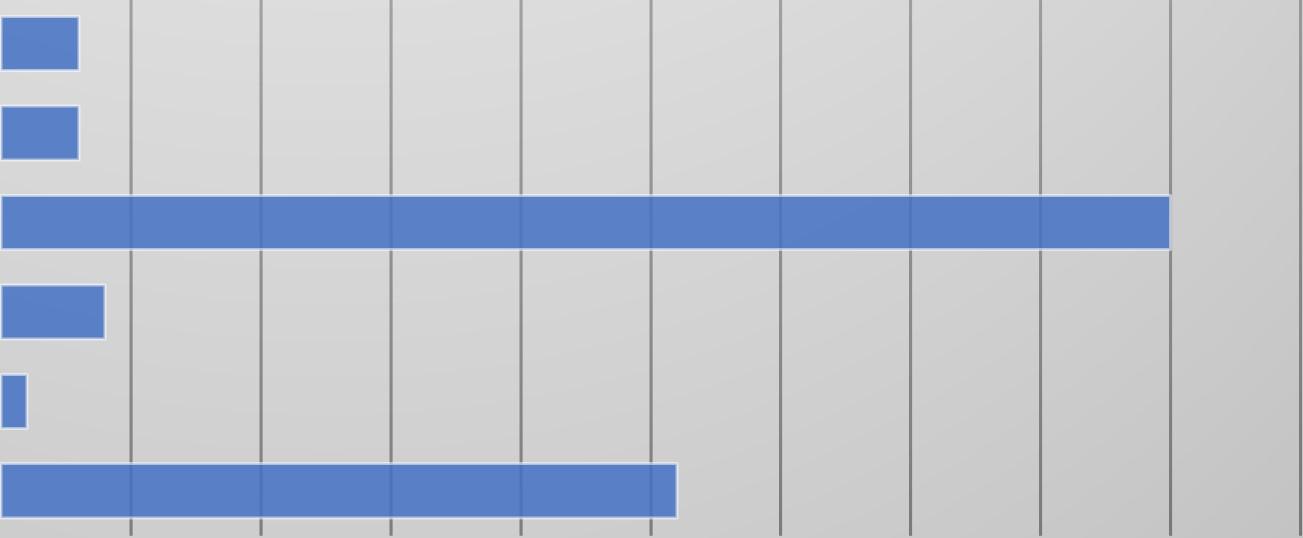

Very few individuals living in ward sever were able to pursue higher education after high school. Due to the cost of higher education, low-income residents may not have access to the funds to pursue higher education, which can lead to higher paying jobs and economic security.


Figure 185: Survey Response: Employment, Ward 7


Employedfull-time
Employedpart-time
Homemaker
MultipleJobs
Other Retired
Self-employed/Independent Contractor Student
Unemployed


EMPLOYEDFULL-TIME

EMPLOYEDFULL-TIME
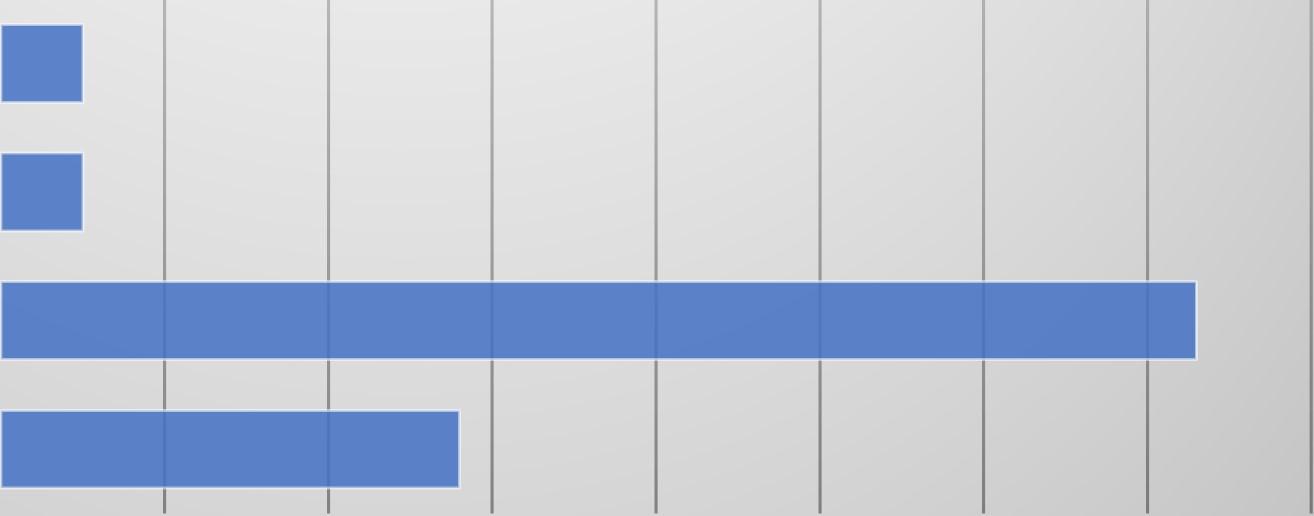
186: Survey Response: Employment by Education, Ward 7
For those who have completed a bachelor’s or master’s degree, they are more likely to be employed than individuals who did not complete their high school degree or obtain their high school degree.
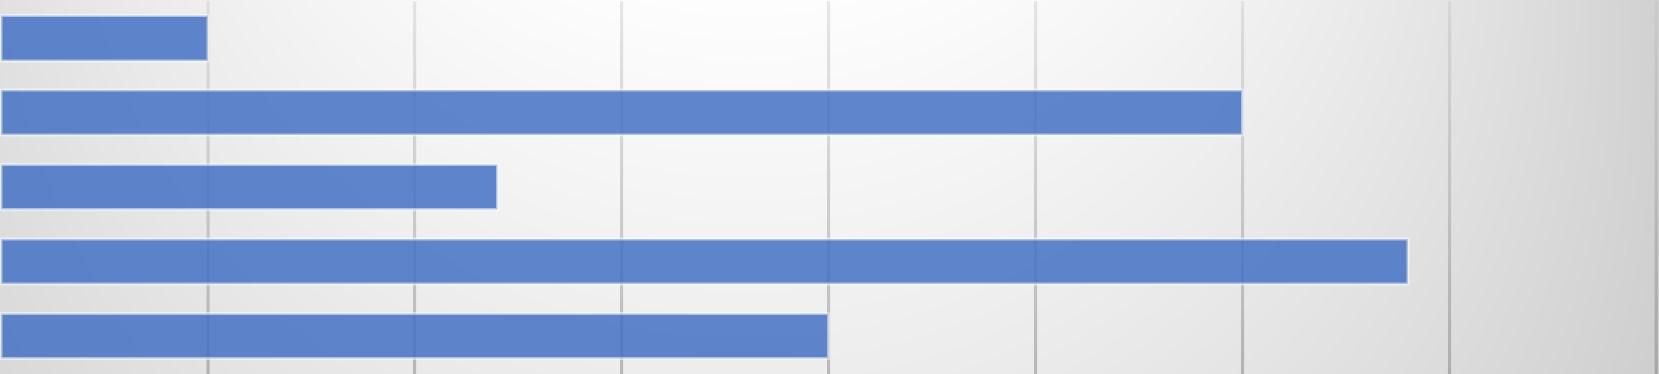
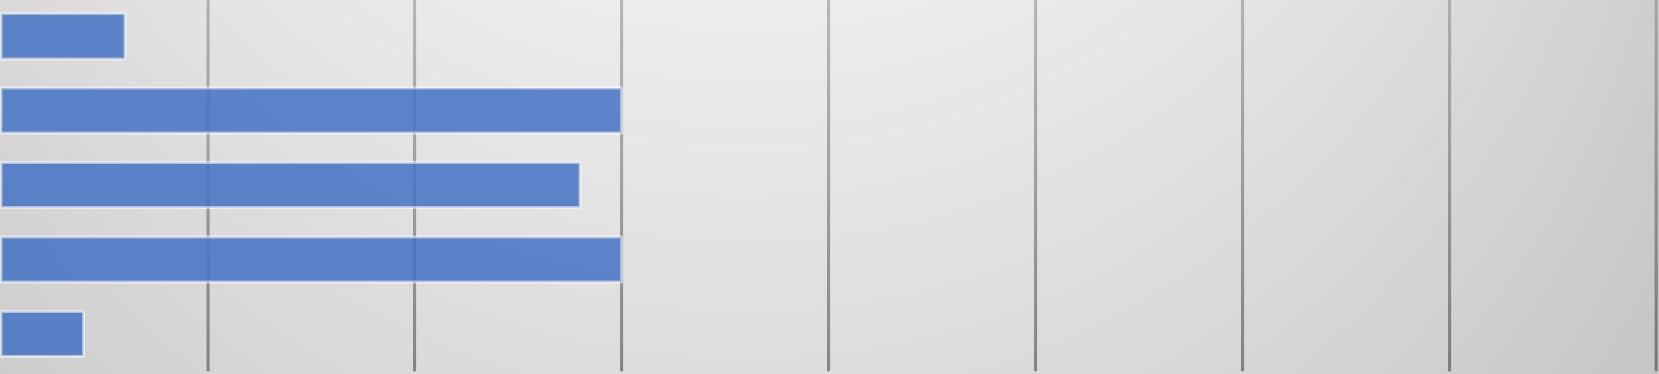

187: Survey Response: Employment by Age, Ward 7
For the prime age of employment (25-45), the survey responses of Ward 7 indicated that many residents still struggled to gain unemployment. Moreover, even younger individuals (18-24) were not able to find employment.

Ward7:Whichofthefollowingbestdescribes yourhouseholdsituation?


Currentlyexperiencinghomelessness
Currentlylivingonacollegecampus
Homeownerpayingamortgage
Homeownerwithoutamortgage
Livingwithothersandpayingrent
Livingaloneandpayingrent
Livingwithothersandpayingrent
Livingwithothers,norent


Yes,throughhealthcare.govorDC HealthLink
Yes,throughMedicaid/Medicare
Yes,throughmyemployerormy spouse'sorrelative'semployer

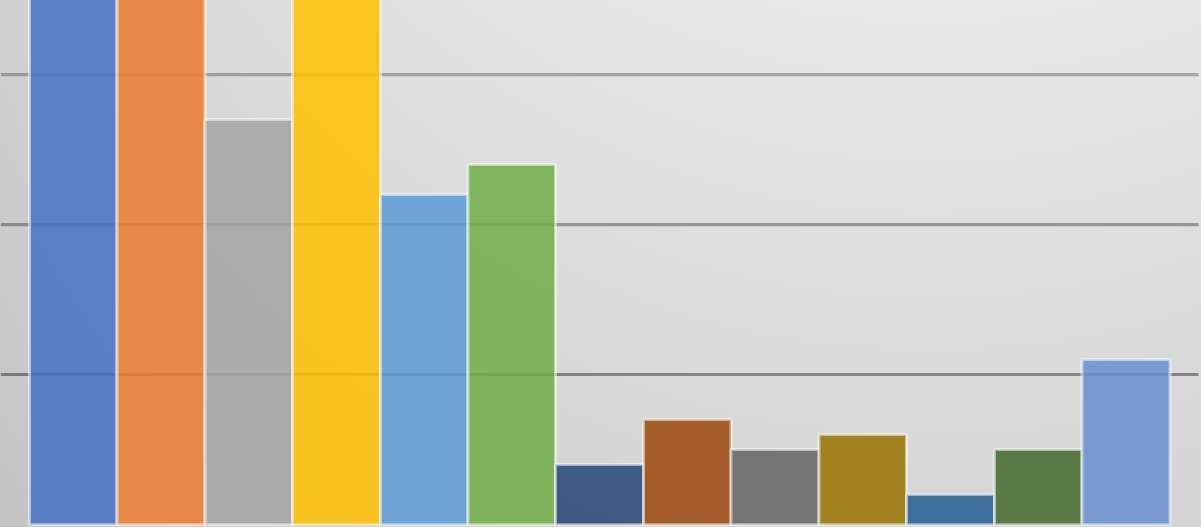

HighBloodPressure

Asthma

Diabetes

MentalIllness

LearningDisability

PhysicalDisability

HearingImpairmentorDeaf

VisionImpairmentorBlind

Alcohol/SubstanceAbuse

HIV+/AIDS

Cancer

ComplicationsduetoLongCOVID-19

Other


Ward7:"Ifeelincludedinthedecisionsofwhat myneighborhoodwouldlooklikeinthefuture"


Figure 193: Survey Response: Safety, Ward 7


Agree Disagree
StronglyAgree
StronglyDisagree Uncertain
Ward7:Howrespectfulwerepolicein interasctingwithyourorwithothers?


Disrespectful
Ididnotinteractwithorobserve police
Neutral
Respectful


VeryDisrespectful
VeryRespectful
194: Survey Response: Police Interaction, Ward 7


195: Survey Response Affordability, Ward 7
Agree
Disagree
StronglyAgree
StronglyDisagree
Undecided


Towhatextentdoyouagreewiththefollowing statement:"Therearestrongeducational opportunitiesattheschoolsnearwhereIlive."


Agree
Disagree
StronglyAgree
StronglyDisagree
Undecided

Ward7:Whatisyourlevelofconfidenceinyour abilitytoobtainajob,orahigherpayingjob,or receivearaise,withinthenextyear?


Confident
Notveryconfident

Somewhatconfident
Uncertainofmyconfidence
Veryconfident


CareerLeadershipAcademy
ElectronicBenefitsTransfer(EBT) Services
EmergencyRentalAssistance(ERAP)
EmploymentPlacementServices
FinancialLiteracy
FoodSupport
FreeIncomeTaxPreparationServices
HousingCounseling
TOOMUCHTROUBLE

SERVICESAVAILABLEDURINGLIMITEDHOURS
NOTELIGIBLE/DIDN'TQUALIFY
LACKOFCHILDCARE

LACKOFCHILDCARE
INADEQUATETRANSPORTATION
INADEQUATETRANSPORATION
IDIDN'TKNOWWHERETOGOFORHELP
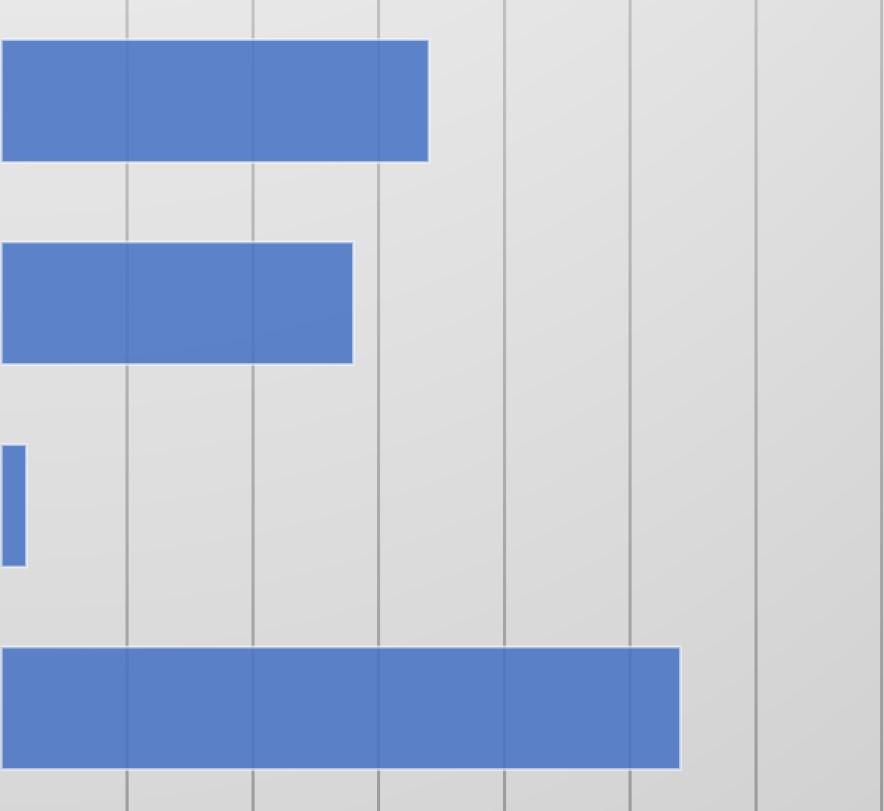
HEALTH/DISABILITIESMADEITDIFFICULTTOGETTHERE
HADAPRIORBADEXPERIENCE
DIDN'TWANTTOASKFORHELP
CONCERNABOUTCONFIDENTIALITY
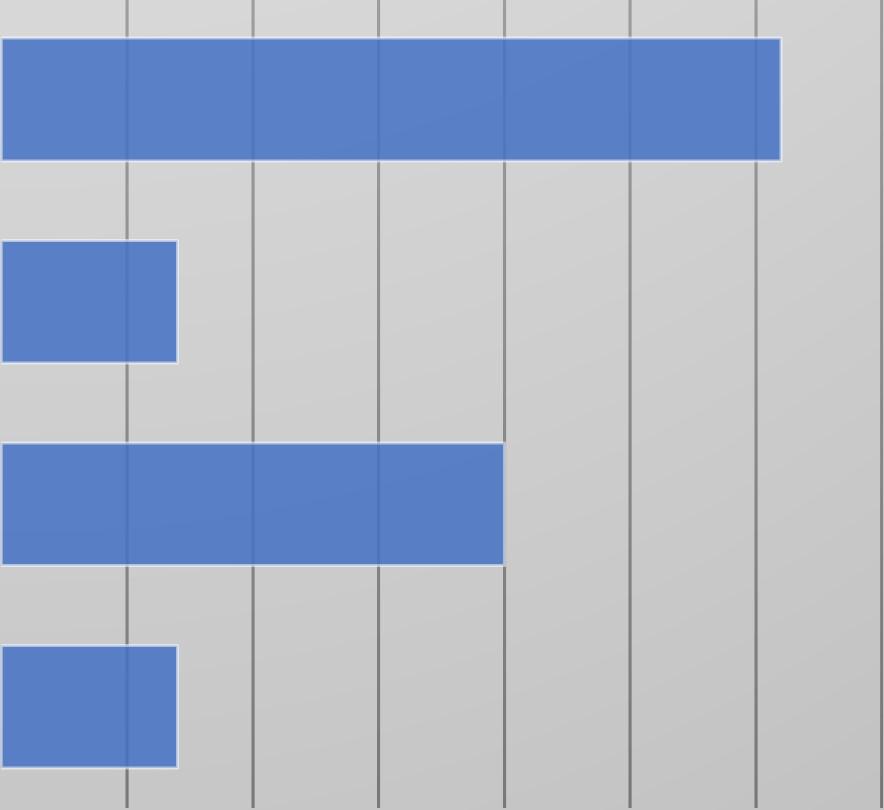
UPO is focusing on the Marshall Heights neighborhood in Ward 7. After labelling the area a Community Impact Zone, the Office of Resource Development and Research paired with UPO’s Community Impact Facilitator to hold focus groups in the area. While there were no attendants in the public library, 9 residents attended the focus group held in a homeless shelter.
When asked about how political leaders address their concerns, many residents were confused. Many residents did not know their council members, but many knew that politicians were a rare sight in their neighborhood. One resident claimed that when they tried to contact the mayor’s office, they were dismissed and ignored. “Not very good service,” one resident said, “I’d give it a three.” Residents were also in agreement that when they sought services, they were jerked around, and constantly referred to one agency or another.
Residents felt disconnected from their community. One resident claimed that it was extremely difficult to get to know other individuals in the community, though they did know many people in the neighborhood. No residents discussed volunteer work to connect with the community.
Despite the high level of violence in the Marshall Heights neighborhood, residents believed that their neighborhood was safe. “There are some areas that I can’t go” one resident said, “but otherwise this area is pretty good.” Residents did not believe that increased police presence was a good thing for public safety.
When discussing living conditions, residents noticed the abundance of trash that has accumulated within the neighborhood. One resident claimed that street cleaners do not visit their neighborhood. One resident complained of the flies that were prevalent in the neighborhood. While their environment received much criticism, no resident complained about the shelter they were currently living in.
One resident seemed particularly vocal about the lack of educational opportunities in the neighborhood. “They want me to study for four years to get my GED!” One resident was able to offer additional resources they could pursue to receive their GED. In terms of childhood education, many residents complained about their inability to homeschool their child, implying that the public education available was inadequate.
When discussing what they would want built on a vacant lot, residents agreed that a recreational center to receive programs was necessary. Other residents wanted a new place to receive
educational services. When discussing affordable housing, some residents felt indifferent. “It’s okay,” they claimed.
Respondents reveal that Ward 7 residents have growing frustrations with elected officials, even when the conversation of topic revolved around school and safety. Many residents used the proverbial “they,” indicating that elected officials remain distant from the community but still greatly affect the area.
Category NeedIdentified Reasoning
Governance Ward 7 residents are not interacting with politicians
Governance Ward 7 residents are bounced around by DC government agencies
Safety Ward 7 residents are often overwhelmed by violence, but believe it is inevitable
Ward 7 residents report that rarely do they see a political leader in their neighborhood
Ward 7 residents claimed to be strung along by DC agencies, where their calls are not returned or they are not able to get in contact with people
Ward 7 residents report that their neighborhood is safe, yet often come face to face with violence.
Residents note that the violence has been normalized
Recommendations
Increase communications between local leaders and residents through community events and townhalls
Re-affirm transparency between DC agencies and Ward 7 residents
Living Conditions Ward 7 residents deal with poor living conditions such as trash on the streets and poor road conditions
Systemic Barriers
Systemic Barriers
Ward 7 residents do not have the educational or vocational background to compete in the competitive DC labor market
Ward 7 residents are struggling with the cost-of-living crisis
Housing Ward 7 residents fear the slow creep of gentrification into their neighborhood
Ward 7 focus group participants harped on daily issues that they faced
Increase alternative policing methods and provide residents with supportive resources
Ward 7 residents indicated that they were limited by their educational attainment
Provide 311 services and inform residents of the agency
Provide additional vocational services struggling Ward 7 neighborhoods, while providing a stipend for opportunity costs
Ward 7 residents fear they will be priced out of the District due to rising food and rent costs
Gentrification was associated with high housing costs in the focus group
Expand existing public services such as ERAP or SNAP
Preserve existing affordable housing while rehabilitation dilapidated buildings
Housing Ward 7 residents struggle to pay their monthly rent costs
Rent continues to increase in Ward 7, potentially causing displacement for long term District residents
Expand the supply of housing while preserving existing affordable housing, connect low-income residents with affordable housing directly
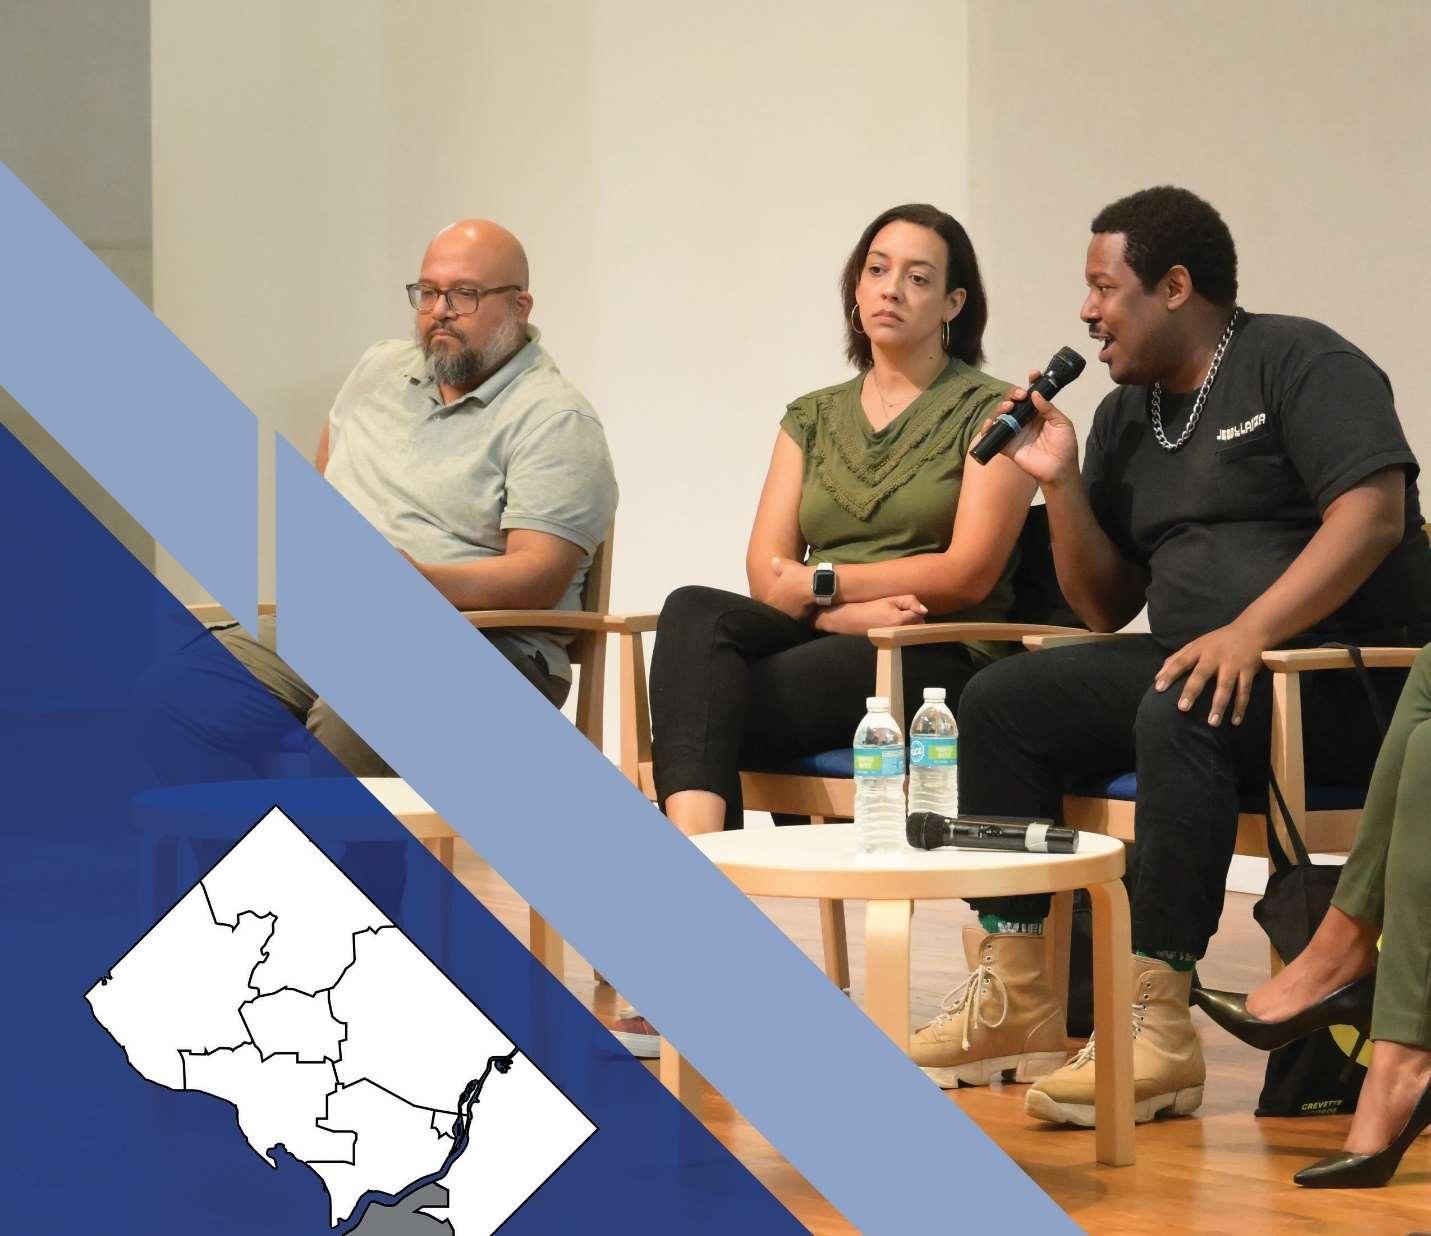

The average Ward 8 resident is a single Black female who has completed their high school diploma and his between the ages of 35 and 44. Typically, they make less than $10,000 a year and have health insurance through Medicaid or Medicare.
ActiveGovernmentCommunication: Improved government engagement with residents.
CrimePreventionPrograms: Comprehensive safety measures to reduce crime and enhance community well-being, especially for youth.
AccesstoEducationandEmploymentSupport: Programs to break down barriers to educational attainment (including vocational training) by offering supportive services, and employment placement/job search services.
HousingAffordabilityandSupport: Increased affordable housing development and assistance for those in extreme poverty, including emergency rental support


Figure 201: Survey Response: Marital Status, Ward 8


Figure 202: Survey Response: Race, Ward 8
88% of residents from Ward 8 identified as Black, according to the survey. As a result, much of the bivariate analysis composed in this section will center around age, to avoid homogeneity.
Figure 203: Survey Response: Annual income, Ward 8
While the majority of respondents from Ward 8 claimed to earn less than $10,000 annually, there is also a prominent minority of residents making between $10,000 to $49,999 annually. For reference, for an individual seeking a studio apartment in the District at a fair rent price (30% of take home pay), will have to earn an estimated $70,000 a year, which few achieve according to the survey response.


Employedfull-time
Employedpart-time
Self-employed/Independent


Figure 204: Survey Response: Employment, Ward 8
The low rates of income can be explained by the high rates of unemployment, where 39% of surveyed respondents indicated they were unemployed. This may be a result of not participating
in the workforce or disability, yet it is clear Ward 8 residents struggle with securing a job.

EMPLOYEDFULL-TIME
UNEMPLOYED
EMPLOYEDFULL-TIME
UNEMPLOYED
EMPLOYEDFULL-TIME
UNEMPLOYED
EMPLOYEDFULL-TIME
UNEMPLOYED
EMPLOYEDFULL-TIME
UNEMPLOYED
EMPLOYEDFULL-TIME


205: Survey Response: Income by Employment, Ward 8
Based on Figure 205, Ward 8 residents who are unemployed are expected to earn less than $10,000 a year, confirming the correlation between employment and income. Therefore, UPO and the local government should invest more into services that helps individuals gain employment to help them achieve economic security.

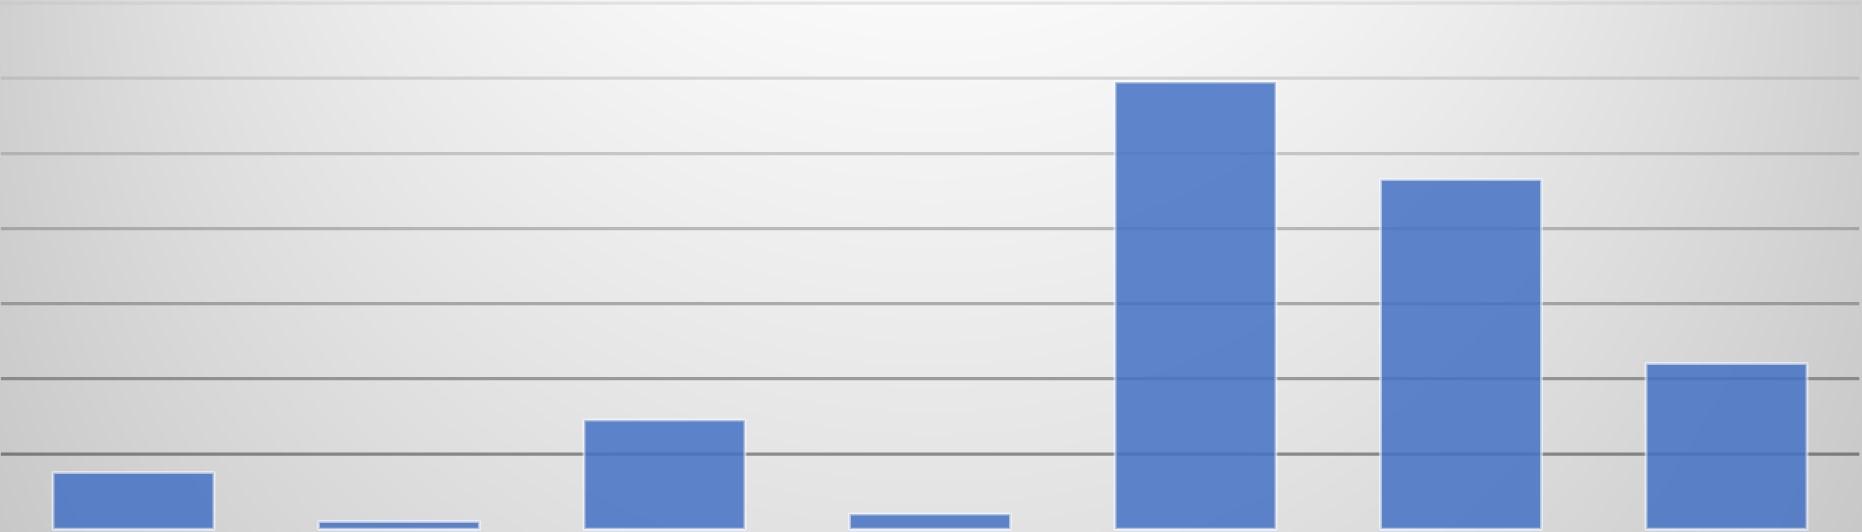
EXPERIENCING HOMELESSNESS
LIVINGONA COLLEGE CAMPUS
ANDPAYING RENT
OTHERSAND PAYINGRENT
OTHERS,NO RENT

Figure 207: Survey Response: Rent, Ward 8
Based upon the high levels of poverty and individuals earning less than $10,000 a year, rents remain low for individuals on Section 8 vouchers or who may be on public housing. An alarming amount of residents are paying $1,200-$1,499 for rent, signaling increasing costs for the District’s most vulnerable.


208: Survey Response: Health Insurance, Ward 8

Yes,throughMedicaid/Medicare
Yes,throughmyemployerormy spouse'sorrelative'semployer
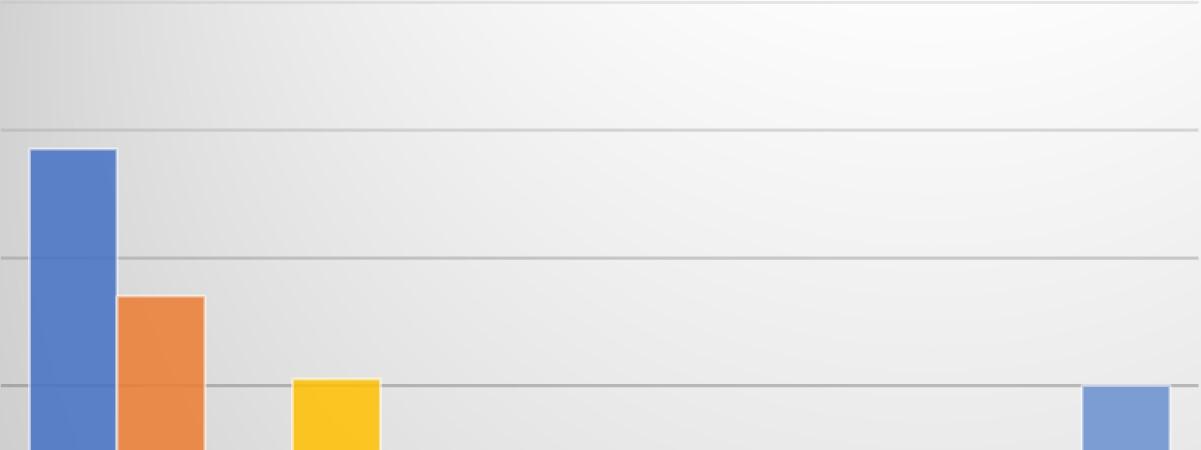
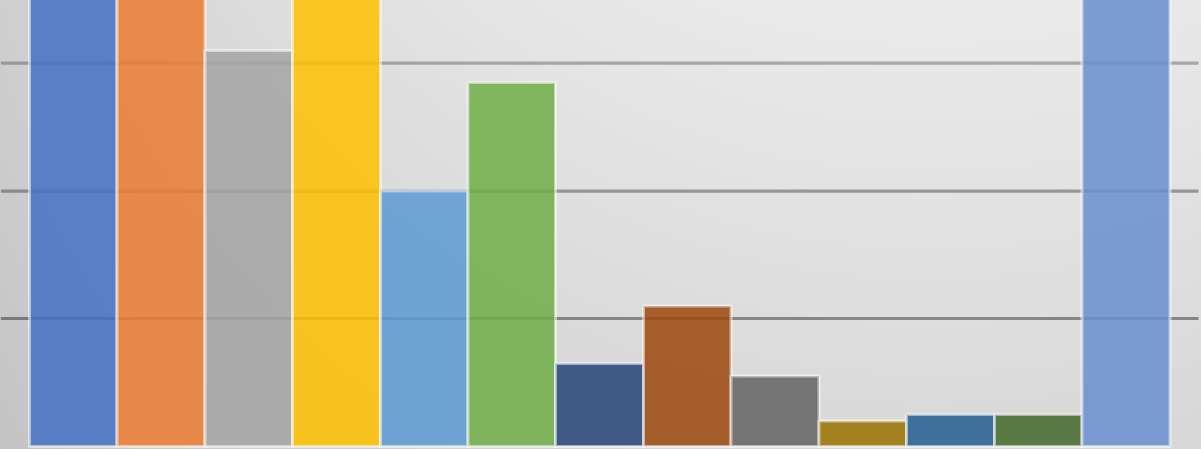

HighBloodPressure

Asthma

Diabetes

MentalIllness

LearningDisability

PhysicalDisability

HearingImpairmentorDeaf

VisionImpairmentorBlind

Alcohol/SubstanceAbuse

HIV+/AIDS

Cancer

ComplicationsduetoLongCOVID-19

None


Ward8:"Ifeelincludedinthedecisionsofwhat myneighborhoodwouldlooklikeinthefuture"


Ward 8 residents were undecided over their inclusion in the future of what their neighborhood would look like. For residents who have seen increases in their home evaluations, the rising cost of housing may seem like a way to acquire economic security. However, for renters, the slow creep of gentrification into Ward 8 has caused displacement into areas like Prince George’s County.

Ward8:"IfeelsaferinmyneighborhoodthanI didlastyear"


Agree
Disagree
StronglyAgree
StronglyDisagree
Uncertain
Through regression analysis, many older Ward 8 residents feel as if their neighborhood is less safe, compared to a year ago. This is primarily due to the increase in juvenile crime, particularly in lower-income neighborhoods concentrated in Ward 8. However, younger Ward 8 residents felt indifferent on the matter.
Ward8:Howrespectfulwerepolicein interactingwithyouorwithothers?


212: Survey Response: Police, Ward 8
Disrespectful
Ididnotinteractwithorobserve

Ward8:"Therearestrongeducational opportunitesattheschoolsnearwhereIlive"


214: Survey Response: Educational Opportunities, Ward 8


Ward8:Whatisyourlevelofconfidenceinyour abilitytoobtainajob,orahigherpayingjob,or receivearaise,withinthenextyear?


215: Survey Response: Job Confidence, Ward 8

Confident
Notveryconfident
Somewhatconfident
Uncertainofmyconfidence
Veryconfident


EarlyHeadStart
ElectronicBenefitsTransfer(EBT) Services
EmergencyRentalAssistance(ERAP)
EmploymentPlacementServices
FoodSupport
FosterGrandParents
FreeIncomeTaxPreparationServices
HousingCounseling

InformationonCityServices
PermanentHousingSupport
ShelterHotline
TransportationSupport
VocationalTrainingCourse
VolunteerOpportunities
YouthAfterSchoolPrograms
Figure 216: Ward 8 - Services Requested
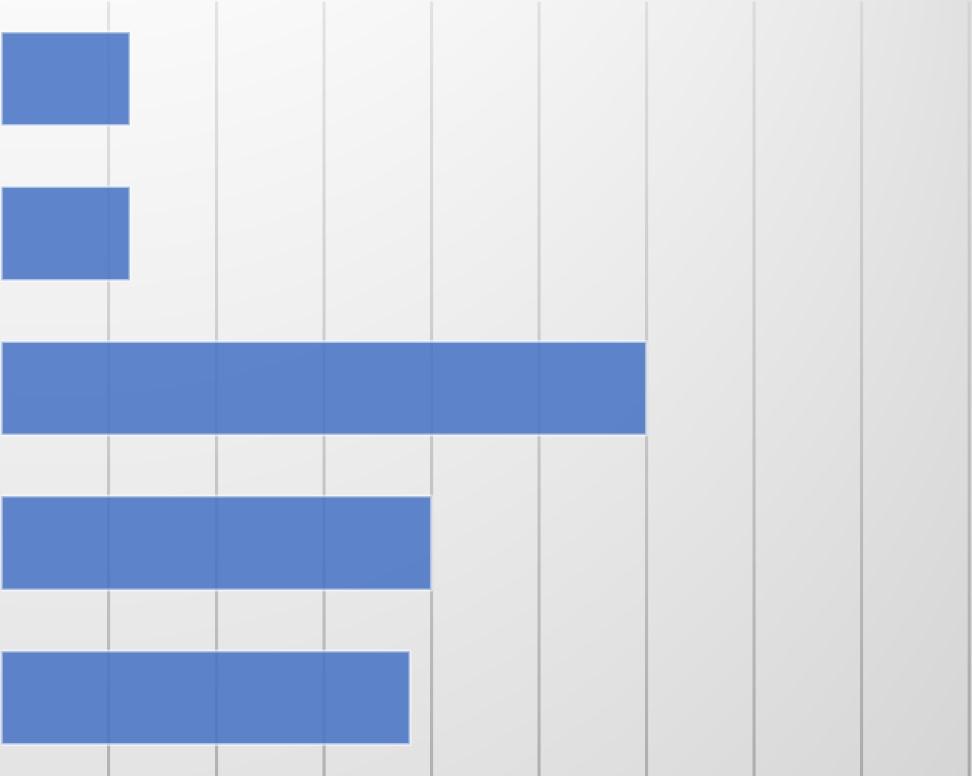
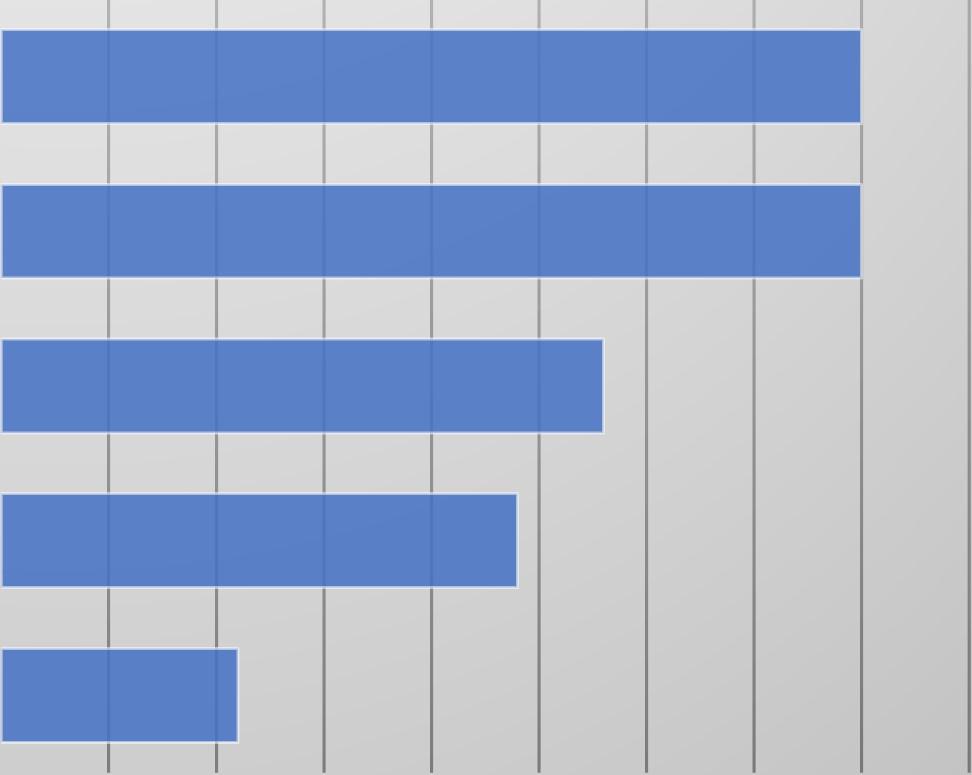

The Ward 8 focus group was held in the Washington Highlands Community Impact Zone, an area with high crime, poverty and unemployment. Residents met in the community room to discuss topics ranging from crime to affordable housing. In total there were 9 participants.
Ward 8 residents felt that politicians and elected officials only came to their neighborhood during election season, or soon after a person is recently elected. One resident claimed that “I don’t see much of anyone around here,” indicating that officials rarely visit the Washington Highlands community. Moreover, residents echoed the sentiment that their neighborhood was left behind compared to other areas of the city. No comments were made about local ANC
members or other elected officials. No comments were made about other publicly elected officials either.
When discussing their relationship to the community, many claimed that it was difficult to do so. One resident claimed that they no longer have time for community building because of their newfound status as a mother. The same resident claimed that they wouldn’t want to go out in the area due to the increasing violence in the neighborhood. One resident argued that members of the community were judgmental. They felt as if the clothes that they wore and the way they looked made people feel uncomfortable and unapproachable. Other residents disagreed with the sentiment and felt that the neighborhood had improved recently.
Specifically, the residents claimed that the neighborhood had improved within in relation to crime. One resident argued that they no longer fear break-ins from local youth and that things like a flat screen TV were now safe in their apartment. The same resident argued that much of the “groups” of youth that were once around the area had dispersed. This comment prompted another resident to claim that much of the crime had been “pushed down the hill.” This comment is in reference to the ongoing beef between residents at the top of the 4th Street hill and the bottom of the 4th Street hill. Another resident commented that the focus group should end early so other residents would not get caught in potential crossfire from the ongoing beef.
“Terrible” was one resident’s response when prompted about living conditions in the neighborhood. The resident said that a cat had found its way into her apartment’s walls and had begun rotting after it died. Management refused to remove the cat or at least downplayed the significance. After 9 months, the cat had completely rotted in the walls. “After they removed it, all that was left was the head.”
Educational experiences in the area were mixed. Residents found that there was not a lot of opportunities made publicly available for people seeking educational opportunities, rather, residents would have to hear about opportunities from word of mouth or other tenants. This resulted in residents arguing that an education center could be built in the neighborhood.
When prompted about a vacant lot in their neighborhood, many residents wanted a recreational center. Primarily, this recreational center would be used to hold programs or workshops for youth to feel safe and explore certain opportunities. Residents felt that there were limited spaces to participate in community activities within the neighborhood. The only times that residents would be able to contribute to the community events was when the district government provided them.
When discussing affordable housing, residents argued that much of the limited affordable housing stock in their neighborhood was no longer sustainable. This was because the rent was income based, rather than needs based or fixed on a flat rate. Some residents argued that this inhibited them from moving up the socio-economic ladder.
In this focus group, housing was by far the most frequent and discussed theme throughout the conversation. This implies that the Ward 8 residential area puts great emphasis on housing and housing affordability in their community. Issues such as lack of faith in political leaders came up infrequently throughout the conversation.
Category NeedIdentified
Governance Ward 8 residents felt disconnected from their political leaders
Reasoning Recommendations
Ward 8 residents claim that politicians only show up in their neighborhood around election time
Governance Ward 8 residents feel left behind by their politicians
Safety Ward 8 residents are concerned with the growing violent crime in their neighborhood
Education Ward 8 residents did not know where to go for new educational opportunities
Systemic Barriers
Ward8residents strugglewiththecostof living
Housing Ward8residentsreside inlacklusterhousing
Ward 8 residents rarely see politicians and see economic gains elsewhere
Violence in the District primarily takes place in Ward 8
Ward 8 residents believed that they had to learn about these opportunities through word-of-mouth
Ward8low-incomeresidents feelthesqueezeofinflation Moresothanwealthier residents
Ward8residentsdealwith landlordswhodonotrespond totheirmaintenancerequests
Re-establish trust between Ward 8 residents and politicians through community events and one on one conversations
Increase transparency for Ward 8 residents through grassroots mobilization
Increase the presence of violence interrupters and other alternatives to policing
Canvas and provide fliers to residents in Ward 8 who are seeking educational opportunities, while showing the benefit
Providefinancial supportthrough serviceslikeSNAPand ERAP
Strengthentenantrights throughassisting residentswith nonresponsive landlords
Housing Ward8residentspaytoo muchforhousing
Ward8residentsbelievethat theaffordablehousingstock wasdepleted
Provideimmediate assistanceby preservingaffordable housing,while expandingsupply withoutdisplacement
Youth violence has become a central issue for residents of the District, non-profits, and politicians. As a direct service provider that often works with at-risk students within the District, UPO decided to hold a focus group for youth practitioners, who work with at-risk youth, to collect their insights on the ongoing juvenile crisis.
There were six participants in the focus group, including two UPO staff interested in sharing their views on juvenile advocacy. Participants were asked seven questions.
For practitioners, the definition of “at-risk” youth received slight pushback. One practitioner claimed that they try to avoid the term all together. The consensus is that children who are considered “at-risk” do not receive the necessary resources to address behavioral health issues, violent tendencies, and issues that pertain to home life. In addition, there are common signs that children exhibit when they are going through behavioral issues. One example is attendance. Children who are experiencing issues at home or issues with violence may be less likely to attend school. One practitioner argued that children who are considered “at-risk” may be more likely to be “school dependent.” This means that the child battling troubles at home or with behavior may look to the school to address fill those gaps. A way to address a child’s reliance on school or chronic truancy is to provide emotional and physical resources at school.
The practitioners agreed that supportive after school and summer programs should focus on children in middle school or below. While it is important to not diminish strife that high school students may be working through, catching lapses in resources that could address behavioral issues in young children may prevent some students from turning to violence as they advance into high school and their early twenties. Younger students may benefit the most from practices such as SEL (Social Emotional Learning) and other emotional regulation skills.
A lack of resources and supplemental programming were some of the key reasons why the city saw an increase in youth violence, according to the practitioners. One practitioner noted the importance of longstanding beefs within the District, which social media has only amplified. Another practitioner echoed the sentiment. As fewer and fewer resources were given to lowincome areas in the District, fewer and fewer families were able to remain stable. This development coincided with the legalization and decriminalization of some recreational drugs within the District, meaning some families who relied on selling drugs no longer had income to
support their child. This resulted in families who had fewer resources and less income, which causes instability. This instability more often causes youth to ignore behavioral regulation or social emotional learning techniques. Addressing that instability through increasing income, social emotional learning, and other resources could reduce the number of crimes committed by juveniles in the future.
The practitioners believed that involving the parents in supportive programming would be an effective way of reducing violence and at-risk behavior in youth. Parents, mentors, teachers, coaches, and directors all play an integral role in developing a child’s response to nervous stimulus. When a child is with a positive role model or mentor, they are more likely able to develop social emotional skills. Moreover, exposure to a larger community may help children feel more at ease in their physical environment, which can reduce violent tendencies.
Primarily, funding for resources for both children and adults was the largest hurdle faced by the interviewed practitioners. One participant claimed that they had been offered a funding opportunity but felt limited by the methods that could be employed. Another practitioner claimed that the price for deploying social emotional skill development in the District had been getting expensive and there were not enough funding opportunities for small non-profits.
Funding was also something that the practitioners would like to see change within the District. Practitioners also noted that there was not enough funding for supplemental activities for both youth and adults that could prepare them for a stable lifestyle, such as vocational training and summer recreational programs. Moreover, the resources available to those who have been previously incarcerated, juvenile or adult, are scarce. Improving who has access to resources was a common theme throughout the entire focus group, and one that UPO would like to highlight to policy makers. Wrap-around services were also highlighted throughout the conversation. For example, one practitioner claimed that the city could make more headway in terms of limiting juvenile violence by providing parents and students an opportunity to develop violence prevention skills through social emotional learning.
One of the key risks identified by practitioners when working with children with behavioral health issues is that sometimes, unintentionally, a counselor or worker may retrigger trauma that the youth was holding. This is something that could potentially be avoided in the right circumstances but is difficult to account for. Additionally, sometimes children, particularly older children, may harbor resentment and anger towards a practitioner. While it is important to help the child, emphasis shouldn’t be taken away from the practitioners physical and mental health.
When addressing youth violence, parents play the most important role in developing a child’s social emotional support system, and thus their social emotional skills. For this reason, UPO wanted to hold a focus group with parents with children who have behavioral issues. There were four participants in total.
Parents often point to children and other parents who may be experiencing social emotional distress as their definition of “at-risk.” As the first example, one parent brought up the fact that children smoke around their house at the beginning of the day. The parents also brought up issues of truancy and drug use that define “at-risk.” Some parents argued that students who do not have access to resources could also be considered “at-risk,” but no definition of what constituted a resource was provided. All parents who participated agreed that they would like to see stability in their child’s life and that stability would help prevent violent outbursts in the future.
Parents claimed that all children should be given the ability to receive resources. They also explained that a child experiencing behavioral outbursts, at any age, needed immediate attention. However, as the conversation went on, many parents seemed interested in helping the youngest children. Parents argued that it would be better for children to enroll in social emotional learning programs at a young age to encourage positive emotional development to avoid future violent tendencies. Serving young men was a common sentiment throughout the focus group.
Parents believed that a lack of social emotional skills were often responsible for underlying violent behaviors in children. For example, one participant argued that if a child is a bully or is being bullied, that there may be issues with family at home. That child may not know how to express their anger in a healthy way. Another parent echoed that sentiment, arguing that most young children did not how to express their emotions. They argued that if a child gets frustrated, for instance, they will typically resort to violence or rude behavior. Frustration with parents was also a factor, as participants maligned other parents who were “reinforcing” negative behaviors at school and at home. Some parents in the focus group claimed that absent parents were also responsible for a child’s poor behavioral health. One participant said that “kids are always fighting over something stupid.”
Parents were also blamed for a child’s behavioral issues. One participant said, “The biggest issue I see is just parents not being parents, there are no consequences being enforced.” Other participants claimed that the community was not involved as it once was. For example, one participant believed that students do not care about being suspended from school or being chronically absent. Participants also noted the importance of parental involvement in after school and summer programs.
Parents in the focus group did not believe that the city was safe for their children. When asked about which activities they felt safe enrolling their children in, parents responded by claiming that they are more likely to look to Maryland for better opportunities because of the issues of health and safety for their child. Parents were also likely to enroll their child in services in Maryland, as parents noted limited opportunities in DC for summer and after school programming.
Nearly all participants had enrolled their child in some kind of behavioral therapy, yet were hoping that the city could address issues surrounding youth violence further.
To assess the needs of small business owners in the District, UPO interviewed five different business owners on their experiences operating and maintaining business operations. For the purposes of this report, no business owners or business names will be mentioned.
All small business owners were concerned about crime and criminal activity. One shop keeper said that “there aren’t many issues here, but there are constantly sirens outside our store.” The common sentiment among business owners was that criminal activity would drive away business. One owner referred to criminals as “crazies” and that the police should be more responsive to when businesses have complaints.
When prompted about how the government has supported their businesses, a majority of the respondents indicated that there wasn’t much government help. One owner said “I don’t even know what they do, I haven’t seem them here ever.” Another business owner disagreed. The business had been proactive in applying to grant opportunities provided by the city and were fortunate enough to receive financial assistance for new programming.
Owners were unanimously in agreement about what their business needed more of: advertising. Many owners believed that more exposure to the public would increase their businesses vitality
in the long run, especially in a city now dominated by large brand-named businesses. As gentrification has rapidly increased across the city in 2018, small business owners are struggling to pay rent on their property, while also competing with corporate brands. Business owners believe that if they had the opportunity to advertise, they could seize on it.
As part of the holistic overview of residents in the District, UPO interviewed four faith-based leaders from various religious factions. Interviewees were asked about their congregation’s needs from the District.
Primarily, respondents reported that elected officials help church leaders distribute food through grants and additional funding. Many congregations used their influence within the community to feed, support and address issues surrounding violence. One faith-based leader said that “effective elected officials go out to the community and listen to residents and nonprofit organizations to craft policies that could aid low-income communities.”
The issue of youth violence is one that is particularly salient for faith-based leaders. Leaders said that additional resources should be offered to support to youth outreach efforts, returning citizens, and food programs to curb youth violence. Moreover, additional programs for both the elderly and unhoused individuals reported additional emphasis. Though leaders called for more programs, they simultaneous suggested that programs require additional oversight and consistency.
Volunteer work was also emphasized by all faith-based leaders who interviewed. One leader went as far to say that their organization advocates on behalf of low-income residents in the District. Leaders expressed pride in the work their congregation performed for individuals in need.
Affordable housing was also a concern for faith-based leaders. Leaders look to the city to designate additional space for the unhoused and seniors, a population that many in the religious community look to help. Across the interviews, there was discussion on the role of faith denominations at providing affordable housing or developing church land to house low-income individuals. All interviewees mentioned that their congregations indicated affordable housing was a major issue.
For the Community Assessment, UPO has recruited educators from private, public and boarding schools experiencing issues community violence, poverty and unemployment. A total of six
educators from across the District participated in the focus groups discussing the state of education in the city.
One of the most emphasized comments by both parents and students was the need for affordable housing. Many teachers, particularly those who work with young children, said that affordable housing will deeply stabilize a family’s life and would allow parents to directly address issues surrounding other insecurities, like mental health issues and food security. Addressing the needs for both parents and students would likely increase the effectiveness of their education, said one participant. Specifically, one teacher claimed that “I think that they [government] can do a better job with just kinda’ trying to create opportunities for affordable housing and not just make it affordable housing where it’s just quote unquote, a bunch of poor people living in an area.”
When it comes to supporting parents and students within the community, teachers in DC simply want to let the community know that teachers support them. One schoolteacher coordinates community clean up days, “when parents and students help clean up trash around the area,” she said.
Many teachers participants indicated that they were on the frontlines of trying to prevent community violence. When prompted, one educator mentioned that “Sometimes you have to keep moving” past community violence. Increasingly and especially after the end of the pandemic, teachers, parents and students are direct witnesses or victims of violence, said one teacher. Another teacher mentioned that their students regularly hear gun shots. According to her, “students had become more or less jaded to the violence in the community.”
When it comes to the curriculum taught to students, teachers shared that parents were also critical to their children’s success. Teachers emphasized the need for smaller classrooms and smaller teacher-to-student ratios. Moreover, teachers were cognizant of the inequities across the District. The quality of education, as one teacher put it, “Depends on where you’re at in the city.” Poorer students often do not get the necessary resources that could aid them in a quality education. Teachers, however, did commend the city for the school voucher choice.
UPO has designated four areas of the District that are experiencing high levels of poverty, unemployment and crime as “Community Impact Zones” (CIZs). The four impact zones are located in Brentwood (Ward 5), Buzzard Point (Ward 6), Marshall Heights (Ward 7) and
Washington Highlands (Ward 8). The UPO Community Impact Division (CID) works directly with residents, Advisory Neighborhood Commissioners, and other non-profits to distribute services and program information to residents seeking aid. For the 2024 Community Assessment, UPO deemed it appropriate to provide special insight into the neighborhoods that are struggling to achieve economic security.
For this section of the Community Assessment, UPO has selected 11 indicator variables to track over the next three years in UPO’s Community Impact Zones (CIZs). These variables include:
Racial Composition
Household income
Cost of rent or a mortgage
Employment status
Perceptions on representation in neighborhood decisions
Perceptions of neighborhood safety
Interactions with police officers
Perceptions on neighborhood affordability
Perceptions of educational opportunities for adults and children
Confidence in economic mobility
Needs and Requested Services
Located in Ward 5, Brentwood is a rapidly growing and gentrifying area of the District, yet still struggles with violent crime, poverty and unemployment. The neighborhood is also home to the Brookland Manor housing development, where much of the poverty and unemployment is centered. The neighborhood falls within census tract 91.02 and has a population of 7,453 and 70% Black.374 An estimated 17% of the population did not complete high school or attain their GED.375 In addition, the estimated poverty rate of the area if 25% of the total population.376 An estimated 43% of the neighborhood has an annual income of less than $50,000 a year according to census data, which falls drastically below the estimated $70,000 dollars required to afford a fair market rent studio in the District.377 Crime also continues to be an issue in the neighborhood. In 2023, there were 472 reports of criminal activity, recorded by police.378
374 U.S. Census Bureau. 2023. American community survey. Table DP05.
375 U.S. Census Bureau. 2023. American community survey. Table S1501.
376 U.S. Census Bureau. 2023. American community survey. Table S1701.
377 U.S. Census Bureau. 2023. American community survey. Table S1901.
378 Open Data. 2024. DC crime cards. Metropolitan Police Department.
Gang activity and criminal activity has been a long-standing issue in Brentwood. In the focus group conducted in the neighborhood, many residents took issue with the increasing violent crime. One resident claimed that police presence didn’t even make them feel safe anymore. While in 2024 criminal activity has fallen by an estimated 25%, residents still do not feel secure.
Moreover, “beefs” between rival “crews” have taken the lives of many young Black residents in the neighborhood. Crews have beef with neighboring and rival crews in Edgewood. The beef traces back to the 90s, where a crew member engaged in an affair with another crew member’s partner. Even in 2023, Brentwood was compared to “Iraq” by one resident, after two young men were killed in a turf battle.379
As part of the UPO 2024 Community Needs Assessment Survey, UPO collected 20 survey responses from Brentwood neighborhood residents.
Survey Results

Brentwood:Whatisyouridentifying race?


379 Cho, Aime, et. al. 2023. ‘My son is dead’: 2 dead, 3 hurt in Brentwood shooting. NBC Washington. Retrieved on August 20, 2024 from https://www.nbcwashington.com/news/local/five-men-shot-two-fatally-in-northeast-dc-police/3432335/
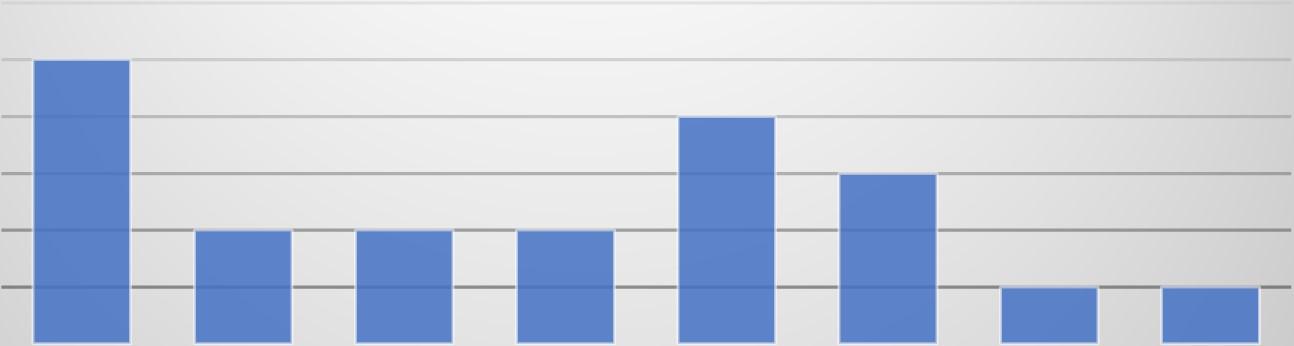

While some Brentwood residents were able to achieve economic security, the data is skewed towards lower-income individuals, which is consistent across the aggregate survey. However, in the Brentwood responses, there is a slight increase in income around the $35,000-$49,999 income range, implying some residents are working full time hours on minimum wage.
While rent remains affordable for some, there is a trend of rising costs in Brentwood. Prices remain low for some as the largest apartment complex that accepts Section 8, Brookland Manor,
has yet to undergo development. Once the destruction of the property is complete, some residents will be displaced due to increasing rents in the District.


Employedfull-time
Employedpart-time
Brentwood:"Ifeelincludedinthedecisions ofwhatmyneighborhoodwouldlooklikein thefuture?


Agree
Disagree
StronglyAgree
StronglyDisagree
Uncertain
In the neighborhood response, residents feel overall, that they are more confident in their ability to help make decisions for the future of the neighborhood. This finding may stem from some of
the small wins that took place in the Brentwood neighborhood. For example, in 2028 after a heavy push from residents in the area, a trash treatment center located next to residential buildings.380 However, this finding runs contrary to what was discussed in the Ward 5 focus group, where residents indicated they were frustrated with the current political situation the neighborhood found itself in.
Brentwood:"Ifeelsaferinmyneighborhood thanIdidlastyear"


Agree
Disagree
StronglyAgree
StronglyDisagree
Uncertain (blank)
While 45% of respondents indicated that the community had become safer in recent years, 40% indicated that they were uncertain about the neighborhoods perceived safety. This is likely due to the increase in the number of arrests in the Brentwood area, leading up to 2024. The sentiment around criminal activity vastly differed in the focus group, where residents were resoundingly frustrated with the number of gunshots heard throughout the night. Many residents indicated that they did not feel safe.
380 Austermuhle, Martin. 2018. DC may finally shut down this trash site in Brentwood. The owner isn’t pleased. DCist. Retrieved on August 20, 2024 from https://dcist.com/story/18/11/27/d-c-may-finally-shut-down-this-trash-site-in-brentwood-the-owner-isntpleased/
223:


Ididnotinteractwithorobserve police
Neutral
Respectful
VeryRespectful
No Brentwood resident indicated that police were disrespectful towards themselves, or others. However, given the large number of neutral responses, it would seem that Brentwood residents were not often interacting with police officers. Yet this runs contrary to the focus group held in Ward 5, which contained Brentwood residents. There was a discussion in the focus group around the effectiveness of police officers, which caused some disagreement amongst the participants.
Brentwood:"Icanaffordtocontinuetolivein myneighborhood"

224: Survey Response:
Agree
Disagree
StronglyAgree
StronglyDisagree
Undecided (blank)

Many Brentwood residents (45%) did not know what to think about the affordability of their neighborhood. Some believed that it was too expensive, yet others felt comfortable living in the
area. This again runs contrary to the focus group, where residents in unison said that the neighborhood was no longer affordable.

Agree
Disagree
StronglyAgree
StronglyDisagree
Undecided (blank)

A small but prominent minority of residents in the survey claimed that the schools in Brentwood were not effective at providing their children a excellent educational experience, yet many did not know the current situation at Brentwood schools. This was reflected in the focus group was well, as not many residents commented on the education situation in the neighborhood.
Brentwood:Whatisyourlevelofconfidencein yourabilitytoobtainajob,orahigherpaying job,orreceivearaise,withinthenextyear?


Confident
Notveryconfident
Somewhatconfident
Uncertainofmyconfidence
Veryconfident (blank)
While not asked in the focus group, residents in Brentwood did not seem particularly confident about getting a job, a better paying job or a raise within the next year. Despite increasing wages located in the center of the District, 35% of residents claimed that they were not very confident in employment opportunities in the District.


Figure 227: Brentwood - Services Requested Buzzard Point

Concernaboutconfidentiality
Didn'twanttoaskforhelp
Health/disabilitiesmadeitdifficultto getthere
Ididn'tknowwheretogoforhelp
None
Noteligible/didn'tqualify
The Ward 6 neighborhood of Buzzard Point is home to one of the largest public housing developments in the District, Greenleaf Gardens. As a CIZ, Buzzard Point is facing systemic issues of poverty, unemployment and crime. Because of urban development that took place in the 1960s, Buzzard Point is siphoned off from the rest of Ward 6 with few resources to take advantage of. The entire neighborhood primarily consists of the public housing units and surrounding developments, many of which had been rapidly gentrifying over the past decade. Despite the increased presence of developers, housing insecurity is still a major issue in the neighborhood.
Despite the high rate of poverty in the neighborhood with 30% of residents making less than $20,000 annually, a quarter of low-income residents are paying more than 30% of their paycheck on rent or their mortgage.381 This disproportionately affects Black residents, who comprise 70% of the current neighborhood population. As of 2022, an estimated 50% of Black Buzzard Point residents fell below the poverty line.382
Criminal activity continues to be an issue. Many residents of Buzzard Point are afraid to leave the premises due to fear of retaliation from other crews throughout the District. Despite UPO’s presence in the area, many are afraid to receive services due to retaliation or the threat of violence. Groups of juveniles have attacked residents, and in mid-2024, a crew of at least 20 attacked and threatened a group of residents at Buzzard Point.383 Large groups of juveniles assaulting residents also occurred at LeDroit Park at Howard University the same year.
The high levels of poverty and perceived crime have not stopped developers from building in the surrounding neighborhood. As of 2024, there are an estimated 3,500 new units slated for development.384
For the UPO 2024 Community Assessment Survey, there were 13 responses from Buzzard Point. UPO had also held a Ward 6 focus group held in Greenleaf Senior.


383 Collins, Gary. 2024. Juvenile mob’s night of terror caught on camera in DC; locals outraged at police response. The National Desk. Retrieved on August 20, 2024 from https://thenationaldesk.com/news/americas-news-now/juvenile-mobs-night-of-terrorcaught-on-camera-in-dc-locals-outraged-at-police-response-when-nick-baker-got-into-his-car-in-the-1900-block-of-half-street-swon-tuesday-morning-residents-of-washington-dcs-riverside-community-buzzard-point
384 UrbanTurf. 2024. The Stacks, the Flats and The Concrete Plant: The 3,500 units coming to DC’s Buzzard Point. Retrieved on August 20, 2024 from https://dc.urbanturf.com/articles/blog/the_stacks_the_flats_and_the_concrete_plant_the_3500_units_coming_to_dcs_bu/220 18
Many residents in the Buzzard Point neighborhood were of low-income, or extremely lowincome. While few respondents were able to achieve an annual income between $50,000$74,999, the median income of the District now exceeds $100,000. Moreover, to afford a studio apartment, one must make an estimated $70,000 a year in the District.


Unemployment is a key issue for Buzzard Point residents. Over 50% of respondents in the neighborhood claimed to be unemployed, which directly impacts the amount of money an individual can procure. Moreover, unemployment increases reliance on government support, which is often not enough to lift individuals out from poverty.
BuzzardPoint:Ifyoupayrentora mortgage,howmuchdoyoupayper month?

Figure 231: Survey Response: Rent, Buzzard Point

Few respondents from Buzzard Point were paying more than $800 in rent. However, the result of this survey highlights the importance of government subsidized housing for low-income residents, who are disproportionately Black.
BUZZARDPOINT:"Ifeelincludedinthe decisionsofwhatmyneighborhoodwould looklikeinthefuture?

Figure 232: Survey Response Buzzard Point
Agree

Strongly Disagree
Residents were in unison that they did not feel involved in the future decisions of the neighborhood. This negative sentiment may be due to the high number of developments taking place in Buzzard Point or elected officials lack action to address issues surrounding crime. For example, many residents in the focus group felt frustrated with the elected officials.


Residents were mostly in unison on the safety of the neighborhood, with 666% of the respondents believing that the neighborhood was less safe than it was a year ago. Residents in the focus group agreed, arguing that the youth in the neighborhood needed to be raised in better conditions and that parents should take responsibility for when their child is caught committing crimes.


Disrespectful
Ididnotinteractwithorobservepolice
Neutral
Respectful
VeryDisrespectful
VeryRespectful
Police presence had a mixed reception at Buzzard Point. Despite outcries of safety improvements, 33% of survey respondents indicated they had disrespectful encounters with police.

Figure 235: Survey Response: Buzzard Point
Agree
Disagree

StronglyAgree
StronglyDisagree
Undecided
Affordability was a top concern amongst Buzzard Point residents with 46% of respondents believing that they could not afford to continue living in the neighborhood. This was echoed by focus group participants, as nearly every participant agreed that affordable housing was a key issue not only in their neighborhood, but in DC. Buzzard Point residents who participated in the focus group also mentioned the Housing Authority was responsible for the lack of public housing options in the District.
BUZZARDPOINT:"Therearestrongeducational
opportunitiesinmyneighborhood"

Figure 236: Survey Response: Buzzard Point
Agree
Disagree

StronglyAgree
Undecided
Many of the participants enrolled in both the survey and focus group were well past the age where education plays a significant role in one’s life. This is reflected in Figure 190, where the perceived benefits of public education were limited.

inyourabilitytoobtainajob,orahigherpaying job,orreceivearaise,withinthenextyear?


Confident
Notveryconfident
Somewhatconfident
Uncertainofmyconfidence
Veryconfident
Figure 237: Survey Response: Buzzard Point
Thirty-one percent of Buzzard Point residents said that they were not very confident in achieving employment in the next year. This is likely due to age and disability status amongst
participants of both the survey and the focus group.


Didn'twanttoaskforhelp
Health/disabilitiesmadeitdifficultto getthere
Ididn'tknowwheretogoforhelp
Inadequatetransportation
Lackofchildcare
None
Noteligible/didn'tqualify
Figure 238: Buzzard Point - Services Requested
Marshall Heights
The historic neighborhood of Marshall Heights has long struggled with systemic issues surrounding crime and poverty. By 1950, Marshall Heights was predominantly settled by lowincome Black Americans fleeing the South as it was one of the only areas of the District did not have racial covenants limiting Black Americans ability to own land.385 However, the area had the title of a “shanty town.”386 When President Truman attempted to displace residents for slum clearance, residents banded together to prevent the government taking their land.387 Ever since, residents have often complained about the limited community investment from both the federal and District government.
As the third wave of gentrification began in the District began at the turn of the century, the limited number of resources available to Marshall Heights residents only became more apparent. As lower-income persons of color moved into the neighborhood to escape rising rent prices elsewhere in the city, the population of Marhsall Heights increased by 10%.388 Local
385 Oman, Anne. 1977. Marshall Heights settlers recall the birth of their neighborhood. The Washington Post. Retrieved by August 21, 2024 from https://www.washingtonpost.com/archive/local/1977/12/15/marshall-heights-settlers-recall-the-birth-of-theirneighborhood/b5fb980e-4e58-45bd-a171-a6cf19cfcee9/
386 Sheir, Rebecca. 2015. Marshall Heights: the ups and downs of a neighborhood east of the river. WAMU. Retrieved on August 21, 2024 from https://wamu.org/story/14/09/26/marshall_heights_the_ups_and_downs_of_a_neighborhood_east_of_the_river/
387 Oman, Anne. 1977. Marshall Heights settlers recall the birth of their neighborhood. The Washington Post. Retrieved by August 21, 2024 from https://www.washingtonpost.com/archive/local/1977/12/15/marshall-heights-settlers-recall-the-birth-of-theirneighborhood/b5fb980e-4e58-45bd-a171-a6cf19cfcee9/
388 US Census Bureau. 2022. American census bureau. Table DP05.
resources, particularly schools, were massively strained by the influx of the number of families that moved towards the area, according to the UPO Community Impact Facilitator. The population of Marshall Heights is extremely, extremely young, as noted by the Impact Facilitator, and census data. As of 2022, 30% of the neighborhood was populated by children under the age of 19.389
The Community Impact Facilitator noted that the density of the younger population has increased both strain on schools and criminal activity in the area. As the area has seen limited services provided over the past decade, many youth have turned to crew activity. This sentiment was corroborated by the focus group, where one individual claimed that youth were beefing with each on the same block. Though, the violence has seemingly been normalized over the past few years. In the same focus group, on resident believed that the neighborhood was extremely safe, despite there being a fatal shooting outside her apartment the day before.


Like the other CIZs, Marshall Heights respondents were primarily Black. However, there were also some respondents who identified as two or more races, or White.
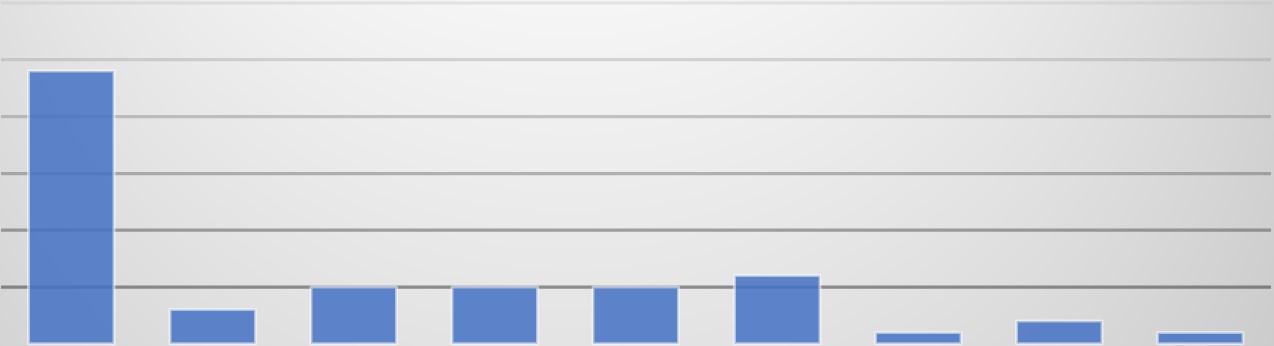

241: Survey Response: Income, Marshall Heights
Like the rest of the Community Impact Zones, many residents live below the Federal Poverty Line and make less than the estimated median income of $100,000 annually. However, some residents have been able to achieve economic security, indicating that economic mobility is possible, yet rare in Marshall Heights.


Figure 242: Survey Response: Employment, Marshall Heights
Employedfull-time
Employedpart-time

Unemployment is a major issue in Marshall Heights, with 38% of respondents seeking employment. This issue of unemployment was highlighted by the Marshall Heights Community
Impact Facilitator. In the neighborhood, many individuals stay outside, loitering throughout the workday.

MarshallHeights:Ifyoupayarentora mortgage,howmuchdoyoupayper month?
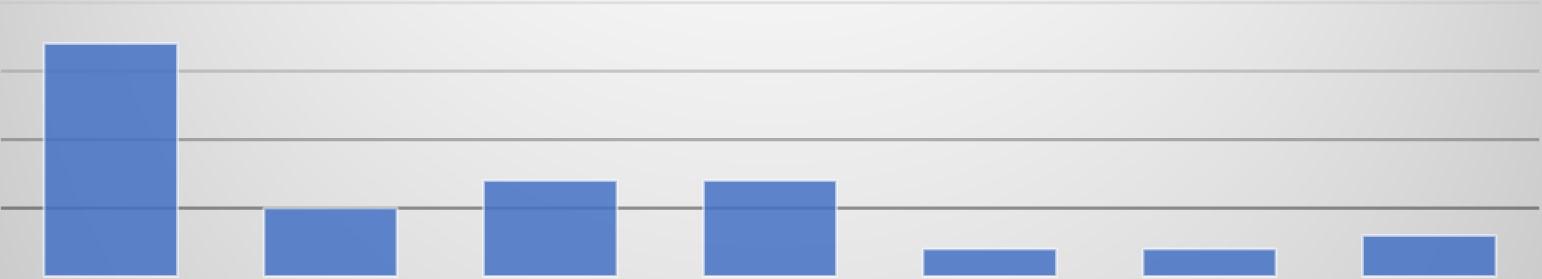
A majority of Marshall Heights respondents paid less than $800 a month in housing costs. Though, compared to other CIZs, the rent costs are more evenly distributed beyond the low housing costs.
MARSHALLHEIGHTS:"Ifeelincludedin thedecisionsofwhatmyneighborhood wouldlooklikeinthefuture?


Agree
Disagree
StronglyAgree
StronglyDisagree
Uncertain
Of the 52 respondents of Marshall Heights, residents were split over the future of their neighborhood. While 31% of residents were ambivalent over the future of the ward, a large minority of respondents believe they still had the ability to make an impact in the neighborhood. While ambivalence was a major facet of the focus group held in Marshall Heights, participants lacked the enthusiasm to make change. In fact, the Democratic primary voting in Ward 7
confirms resident apathy. For a ward of nearly 100,000 individuals, only 10% showed up for an open primary.


Agree
Disagree
StronglyAgree
StronglyDisagree
Uncertain
A majority of Marshall Heights residents (50%) indicated that over the past year that their neighborhood had become less safe. This is consistent with the increase in criminal activity across the District as a whole, which disproportionately impacted residents in Wards 7 and 8, as well as residents of color.
MARSHALLHEIGHTS:Howrespectfulwere policeininteractingwithyouorwithothers?

245: Survey Response Marshall Heights
Disrespectful
Ididnotinteractwithorobserve
police
Neutral
Respectful
VeryRespectful

Marhsall Heights residents overall, were neutral in interacting with police, though a small minority found their behavior to be very disrespectful.


Despite perceived overcrowding by some residents about schools in Marshall Heights, residents seemed to believe that the schools were doing a good job at providing educational instruction. In the focus groups held in the area, this went beyond teaching youth. Some participants revealed that they were seeking their GED diploma.
Residents of Marshall Heights were mostly split on the future of the affordability of their neighborhood. While all rents in the District have increased drastically over the years, there are several housing projects within Ward 7 where residents are able to pay only 30% of their total income in rent, meaning low-income residents are able to find cheap, stable housing. In 2023, the Washington Post called Marshall Heights the “last affordable neighborhood” in the District. The article also hinted at future development, meaning low-income persons may be displaced through the fourth wave of gentrification.390
MARSHALLHEIGHTS:Whatisyourlevelof confidenceinyourabilitytoobtainajob,ora higherpayingjob,orreceivearaise,withinthe nextyear?


Confident
Notveryconfident
Somewhatconfident
Uncertainofmyconfidence
Veryconfident
Over a third (34%) of respondents of the survey were hesitant about their future economic situation. As few resources have been provided to the area and the number of crew beefs continue to increase, the residents indicate that their economic future is in jeopardy as well.
Washington Highlands
Like all CIZs, the Washington Highlands community struggles with crime, poverty, unemployment and housing instability. The majority Black neighborhood often captures headlines for the violent crime that takes place, often on weekends. Like Marshall Heights and Brentwood, beefs between crews can be as close as blocks. Also, like Marshall Heights,
390 Seck, Hope. 2023. DC’s “last affordable” neighborhood poised for growth and change. The Washington Post. Retrieved on August 22, 2024 from https://www.washingtonpost.com/business/2023/05/31/where-we-live-marshall-heights/
Washington Highlands is victim of strained resource distribution as other areas of the city get more expensive, the population of the neighborhood continues to increase. Within the neighborhood, beefs with other crews extend far beyond the boundaries of the neighborhood. At the UPO focus group held in the neighborhood, residents indicated that many other residents were afraid to leave their neighborhood, or even street. This is a common theme for many residents of the District where beefs are prominent. Though Washington Highlands has many opportunities for youth, teenagers tend to be left behind. During the focus group, residents complained of teenagers having nothing to do, despite the resources available to them in the neighborhood.
The living conditions in Washington Highlands are also deplorable. One resident of the Atlantic Gardens building complained of a decomposing cat in their walls. It took three months for management to remove the corpse. Some residents complained of bullet holes in the main lobby of Atlantic Gardens. The building has remained of the upmost importance for providing affordable housing to low-income residents.


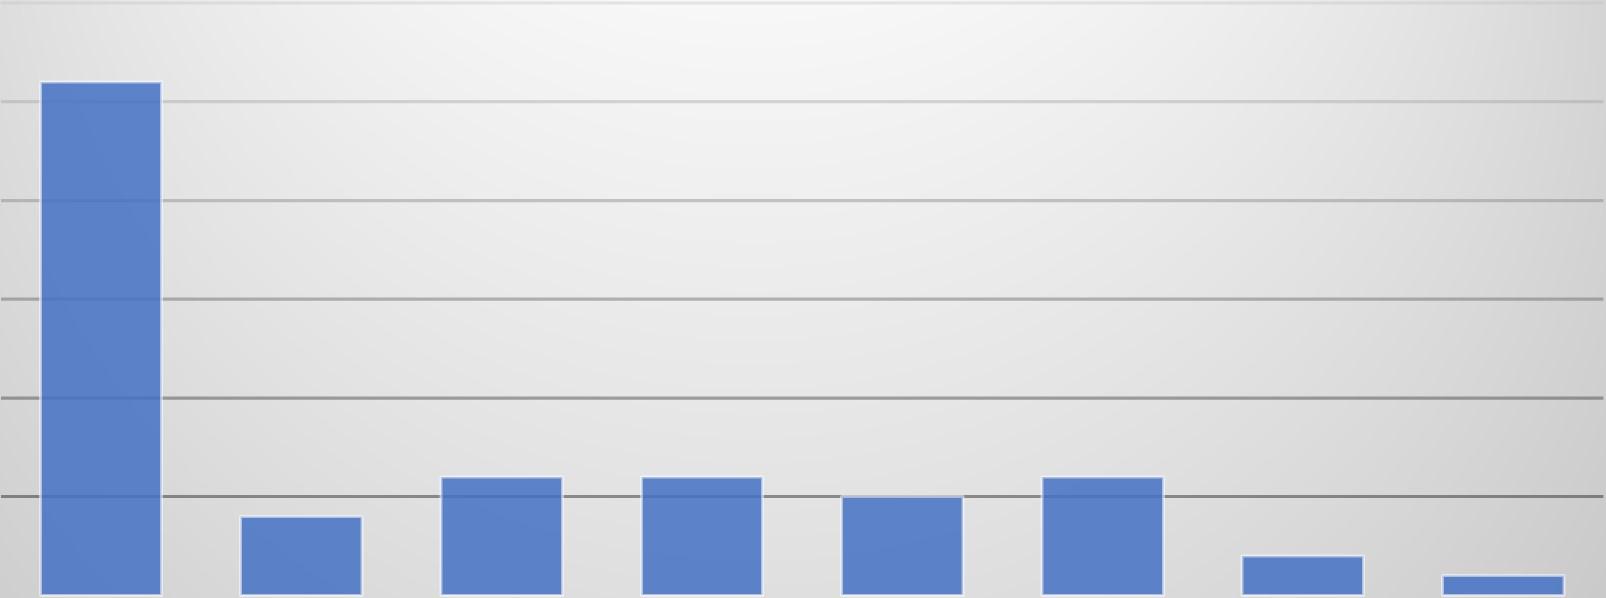

Figure 250: Survey Response: Income, Washington Highlands Washington Highlands residents indicated that a majority of individuals fell below the Federal Poverty Line, as well as the median income in the city. Though a small percentage of individuals earned more than the income, the overwhelming skew towards low-income individuals in the survey responses indicates that Washington Highlands is in dire need of services and resource allocation.

WashingtonHighlands:Whatbest describesyouremploymentstatus?


Figure 251: Survey Response: Employment, Washington Highlands
Unemployment is rampant in Washington Highlands, much like other Community Impact Zones. There is also a sizeable portion of the population who is out of the workforce, indicating that the unemployment rate is higher than 38%. For policy makers, ensuring employment for individuals who have yet to complete higher education is of utmost importance.
WashingtonHighlands:Ifyoupayrentora

$0-$799$800-$999$1,000-$1,199$1,200-$1,499$1,500-$1,799$1,800-$2,000$2,000+
Figure 252: Survey Response: Rent, Washington Highlands
There is a high number of respondents in Washington Highlands paying less than $800 a month in housing costs, indicating the presence of public housing or Section 8 support. However, there are also a number of individuals paying between $1,200-$1,499 in rent, highlighting the increasing rent costs in the District.

Figure 253: Survey Response: Washington Highlands

38% of Washington Highlands residents claimed they were uncertain about the impact they could make in their neighborhoods future. This is likely a reflection of poor economic security that individuals in the neighborhood often find themselves in. 36% of residents had a more cynical vision of their neighborhoods future, likely stemming from the same issues.
WASHINGTONHIGHLANDS:"Ifeelsafer inmyneighborhoodthanIdidlastyear"

254: Survey Response: Washington Highlands

Agree
Disagree
StronglyAgree
StronglyDisagree
Uncertain
46% of respondents indicated that their neighborhood had not gotten safer over the past year. This is likely due to the high rate of violence within the neighborhood, particularly during the 2023 period.
WASHINGTONHIGHLANDS:How respectfulwerepoliceininteracting withyouorwithothers? Disrespectful

255: Survey Response: Washington Highlands

Ididnotinteractwithor observepolice
Neutral
From the survey, respondents indicated that there were not many interactions with police.

256:
Response:
Agree
Disagree
StronglyAgree
StronglyDisagree
Undecided

Residents were overall split on the educational opportunities in the neighborhood. Many residents in the focus group mentioned that youth and teenagers would often skip class to cause trouble in the neighborhood. Moreover, teenagers in particular could easily fall into trouble.
WASHINGTONHIGHLANDS:"Ican affordtocontinuetoliveinmy neighborhood"


Agree
Disagree
StronglyAgree
StronglyDisagree
Undecided
While some residents said that they did not believe that they could afford to live in their neighborhood in the future, many were either undecided or agreed with the statement. Atlantic Gardens, the primary apartment complex in the area, caters specifically to low-income residents in Ward 8.
yourlevelofconfidenceinyourability toobtainajob,orahigherpayingjob, orreceivearaise,withinthenextyear?

258:
Confident
Notveryconfident

Somewhatconfident
Uncertainofmyconfidence
Veryconfident
Washington Highlands residents are cautious about if they can improve their economic standing in the next year. While 27% of residents claimed that their economic outlook had a chance of improving, 29% of residents were only somewhat confident about attaining employment, a better paying job, or a raise in the next year.
The UPO Board of Directors has formally accepted the 2024 Community Assessment on January 23, 2025.
of
Figure 1: Race of Survey Respondents, 2021................................................................................
Figure 2: Capacity of early learning centers across the District, DC Action.................................48
Figure 3: Number of Services Requested by Ward.......................................................................58
Figure 5: DYRS Center, DYRS......................................................................................................68
Figure 6: Detention center, DYRS.................................................................................................71
Figure 7: Where 50% or more of the population pays more than [??] fair rent price based on income...........................................................................................................................................
Figure 8: Evictions across the District...........................................................................................81
Figure 9: Affordable Housing Units Built Since 2019, DC Housing Authority............................83
Figure 10: Number of Affordable Housing Units by Ward...........................................................85
Figure 11: Single Family Zoning across the District, Office of Zoning ......................................... 87
Figure 12: Rental Assistance Demonstration (RAD) Overview for DCHA Properties................. 93
Figure 13: Buzzard Point After Highway Development in 1979, Greater Greater Washington...98
Figure 14: Buzzard Point Before Highway Development in 1949, Greater Greater Washington 98
Figure 15: Brookland Manor Coalition's Vision for Brookland Manor, BMC ............................ 102
Figure 16: Likelihood of a child born into poverty entering the top 20% of income, Raj Chetty107
Figure 17: Number of One Star Ratings, DCPS ..........................................................................
Figure 18: Survey Response: Ward..............................................................................................122
Figure 19: Survey Response: Gender...........................................................................................123
Figure 20: Survey Response: Gender by Age...............................................................................123
Figure 21: Survey Response: Gender by Ward............................................................................124
Figure 22: Survey Response: Marital Status ...............................................................................125
Figure 23: Survey Response: Race...............................................................................................125
Figure 24: Survey Response: Education Level ............................................................................126
Figure 25: Survey Response: Annual Income..............................................................................127
Figure 26: Survey Response: Income by Race.............................................................................128
Figure 27: Survey Response: Income by Ward............................................................................129
Figure 28: Survey Response: Income by Employment Status ....................................................132
Figure 29: Survey Response: Education by Race ........................................................................133
Figure 30: Survey Response: Employment .................................................................................134
Figure 31: Survey Response: Employment by Ward...................................................................134
Figure 32: Survey Response: Household Situation.....................................................................135
Figure 33: Survey Response: Rent/Mortgage per month............................................................136
Figure 34: Survey Response: Rent by Income, Low Income Residents......................................137
Figure 35: Survey Response: Rent by Income.............................................................................138
Figure 36: Survey Response: Rent by Income, Young Adults.....................................................139
Figure 37: Survey Response: Health Insurance.......................................................................... 140
Figure 38: Survey Response: Health Conditions........................................................................
Figure 39: Survey Response: Future of the Neighborhood.........................................................141
Figure
Figure
Figure
Figure
Figure 44: Survey Response:
Figure 45: Survey Response: Schools
Figure 46: Survey Response:
Figure
Figure
Figure
Figure
Figure
Figure
Figure
Figure
Figure
Figure
Figure
Figure
Figure
Figure
Figure
Figure
Figure
Figure
Figure
Figure
Figure
Figure
Figure
Figure
Figure
Figure
Figure
Figure
Figure
Figure
Figure 78:
Figure
Figure
Figure
Figure
Figure
Figure
Figure 86: Ward 2
Figure
Figure 88: Survey Response: Ward 2 –.......................................................................................193
Figure 89: Survey Response: Police, Ward 2...............................................................................194
Figure 90: Survey Response: Safety, Ward 2 ..............................................................................194
Figure 91: Survey Response: Affordability, Ward 2 ....................................................................195
Figure 92: Survey Response: Educational Opportunities, Ward 2..............................................195
Figure 93: Survey Response: Job Confidence, Ward 2................................................................196
Figure 94: Ward 2 - Services Requested......................................................................................196
Figure 95: Survey Response: Gender, Ward 3............................................................................203
Figure 96: Survey Response: Age, Ward 3 .................................................................................203
Figure 97: Survey Response: Marital Status, Ward 3.................................................................204
Figure 98: Survey Response: Race, Ward 3................................................................................204
Figure 99: Survey Response: Annual Income, Ward 3.............................................................205
Figure 100: Survey Response: Education Level, Ward 3............................................................206
Figure 101: Survey Response: Education by Race, Ward 3........................................................207
Figure 102: Survey Response: Employment, Ward 3.................................................................208
Figure 103: Survey Response: Household Situation, Ward 3 ....................................................208
Figure 104: Survey Response: Rent, Ward 3..............................................................................209
Figure 105: Survey Response: Health Insurance, Ward 3..........................................................209
Figure 106: Survey Response: Health Conditions, Ward 3 - some respondents have multiple health conditions ........................................................................................................................ 210
Figure 107: Survey Response: Neighborhood Future, Ward 3................................................... 210
Figure 108: Survey Response: Neighborhood Safety, Ward 3.....................................................211
Figure 109: Survey Response: Police Interaction, Ward 3..........................................................211
Figure 110: Survey Response: Affordability, Ward 3...................................................................212
Figure 111: Survey Response: Schools, Ward 3............................................................................212
Figure 112: Survey Response: Job Confidence, Ward 3 ..............................................................213
Figure 113: Ward 3 - Services Requested.....................................................................................213
Figure 114: Survey Response: Gender, Ward 4...........................................................................220
Figure 115: Survey Response: Age, Ward 4.................................................................................220
Figure 116: Survey Response: Marital Status, Ward 4 ................................................................221
Figure 117: Survey Response: Race, Ward 4................................................................................221
Figure 118: Survey Response: Annual Income, Ward 4 .............................................................222
Figure 119: Survey Response: Income by Race, Ward 4.............................................................223
Figure 120: Survey Response: Education Level, Ward 4............................................................224
Figure 121: Survey Response: Employment, Ward 4..................................................................224
Figure 122: Survey Response: Household Situation, Ward 4.....................................................
Figure 123: Survey Response: Rent, Ward 4..............................................................................
Figure 124: Survey Response: Rent Cost by Race, Ward 4.........................................................226
Figure 125: Survey Response: Health Insurance, Ward 4..........................................................
Figure 126: Survey Response: Health Conditions, Ward 4........................................................
Figure 127: Survey Response: Neighborhood Future, Ward 4...................................................228
Figure 128: Survey Response: Safety, Ward 4............................................................................228
Figure 129: Survey Response: Affordability, Ward 4 .................................................................229
Figure 130: Survey Response: Police, Ward 4............................................................................229
Figure 131: Survey Response: Educational Opportunities, Ward 4 ...........................................230
Figure 132: Survey Response: Job Confidence, Ward 4.............................................................230
Figure 133: Ward 4 - Services Requested....................................................................................231
Figure 134: Survey Response: Gender, Ward 5..........................................................................238
Figure 135: Survey Response: Age, Ward 5................................................................................238
Figure 136: Survey Response: Marital Status, Ward 5...............................................................239
Figure 137: Survey Response: Race, Ward 5...............................................................................239
Figure 138: Survey Response: Income by Race, Ward 5 ............................................................240
Figure 139: Survey Response: Annual Income, Ward 5..............................................................241
Figure 140: Survey Response: Education Level, Ward 5.............................................................241
Figure 141: Survey Response: Education by Age, Ward 5 ..........................................................242
Figure 142: Survey Response: Employment, Ward 5.................................................................243
Figure 143: Survey Response: Employment Status by Race, Ward 5.........................................243
Figure 144: Survey Response: Household Situation, Ward 5.....................................................244
Figure 145: Survey Response: Rent, Ward 5 ..............................................................................244
Figure 146: Survey Response: Rent by Race, Ward 4................................................................. 245
Figure 147: Survey Response: Rent by Age, Ward 5...................................................................246
Figure 148: Survey Response: Health Insurance, Ward 5.......................................................... 247
Figure 149: Survey Response: Health Conditions, Ward 5 ........................................................ 247
Figure 150: Survey Response: Neighborhood Future, Ward 5...................................................248
Figure 151: Survey Response: Safety, Ward 5.............................................................................248
Figure 152: Survey Response: Police Interaction, Ward 5..........................................................249
Figure 153: Survey Response: Affordability, Ward 5..................................................................249
Figure 154: Survey Response: Educational Opportunities, Ward 5...........................................250
Figure 155: Survey Response: Job Confidence, Ward 5 .............................................................250
Figure 156: Ward 5 - Services Requested ....................................................................................251
Figure 157: Survey Response: Gender, Ward 6 ..........................................................................
Figure 158: Survey Response: Age, Ward 6................................................................................
Figure 159: Survey Response: Age by Gender, Ward 6 ..............................................................260
Figure 160: Survey Response: Marital Status, Ward 6................................................................261
Figure 161: Survey Response: Race, Ward 6................................................................................261
Figure 162: Survey Response: Annual Income, Ward 6.............................................................262
Figure 163: Survey Response: Black Annual Income, Ward 6...................................................262
Figure 164: Survey Response: Educational Level, Ward 6.........................................................263
Figure 165: Employment Status, Ward 6....................................................................................263
Figure 166: Survey Response: Employment by Age, Ward 6.....................................................264
Figure 167: Household Situation, Ward 6..................................................................................
Figure 168: Survey Response: Household Situation by Age, Ward 6.........................................
Figure 169: Survey Response: Rent, Ward 6..............................................................................266
Figure 170: Survey Response: Health Insurance, Ward 6..........................................................
Figure 171: Survey Response: Health Conditions, Ward 6......................................................... 267
Figure 172: Survey Response: Neighborhood Future, Ward 6...................................................268
Figure 173: Survey Response: Safety, Ward 6 ............................................................................268
Figure 174: Survey Response: Police Interaction, Ward 6 .........................................................269
Figure 175: Survey Response: Educational Opportunities, Ward 6...........................................269
Figure 176: Survey Response: Affordability, Ward 6..................................................................270
Figure 177: Survey Response: Job Confidence, Ward 6 .............................................................270
Figure 178: Ward 6 - Services Requested....................................................................................271
Figure 179: Survey Response: Gender, Ward 7 ..........................................................................
Figure 180: Survey Response: Age, Ward 7................................................................................
Figure 181: Survey Response: Marital Status, Ward 7................................................................
Figure 182: Survey Response: Race, Ward 7..............................................................................
Figure 183: Survey Response: Annual Income, Ward 7.............................................................280
Figure 184: Survey Response: Income by Age, Ward 7...............................................................281
Figure 185: Survey Response: Educational Level, Ward 7.........................................................283
Figure 186: Survey Response: Education by Age, Ward 7..........................................................283
Figure 187: Survey Response: Employment, Ward 7 .................................................................284
Figure 188: Survey Response: Employment by Education, Ward 7...........................................284
Figure 189: Survey Response: Employment by Age, Ward 7 .....................................................285
Figure 190: Survey Response: Household Situation, Ward 7.....................................................285
Figure 191: Survey Response: Rent, Ward 7...............................................................................286
Figure 192: Survey Response: Health Insurance, Ward 7..........................................................286
Figure 193: Survey Response: Health Conditions, Ward 7.........................................................287
Figure 194: Survey Response: Neighborhood Future, Ward 7...................................................287
Figure 195: Survey Response: Safety, Ward 7 ............................................................................288
Figure 196: Survey Response: Police Interaction, Ward 7 .........................................................288
Figure 197: Survey Response Affordability, Ward 7...................................................................289
Figure 198: Survey Response: Educational Opportunities, Ward 7...........................................289
Figure 199: Survey Response: Job Confidence, Ward 7.............................................................290
Figure 200: Ward 7 - Services Requested ..................................................................................290
Figure 201: Survey Response: Gender, Ward 8..........................................................................298
Figure 202: Survey Response: Age, Ward 8...............................................................................298
Figure 203: Survey Response: Marital Status, Ward 8..............................................................299
Figure 204: Survey Response: Race, Ward 8 .............................................................................299
Figure 205: Survey Response: Annual income, Ward 8.............................................................300
Figure 206: Survey Response: Employment, Ward 8.................................................................301
Figure 207: Survey Response: Income by Employment, Ward 8...............................................303
Figure 208: Survey Response: Household Situation, Ward 8....................................................303
Figure 209: Survey Response: Rent, Ward 8 .............................................................................304
Figure 210: Survey Response: Health Insurance, Ward 8..........................................................304
Figure 211: Survey Response: Health Conditions, Ward 8.........................................................305
Figure 212: Survey Response: Neighborhood Future, Ward 8...................................................305
Figure 213: Survey Response: Safety, Ward 8............................................................................306
Figure 214: Survey Response: Police, Ward 8............................................................................307
Figure 215: Survey Response: Affordability, Ward 8 .................................................................307
Figure 216: Survey Response: Educational Opportunities, Ward 8...........................................308
Figure 217: Survey Response: Job Confidence, Ward 8.............................................................308
Figure 218: Ward 8 - Services Requested...................................................................................309
Figure 219: Survey Response: Race, Brentwood.........................................................................321
Figure 220: Survey Response: Income, Brentwood...................................................................322
Figure 221: Survey Response: Rent, Brentwood ........................................................................322
Figure 222: Survey Response: Employment, Brentwood........................................................... 323
Figure 223: Survey Response: Brentwood..................................................................................323
Figure 224: Survey Response: Brentwood..................................................................................324
Figure 225: Survey Response: Brentwood.................................................................................. 325
Figure 226: Survey Response: Brentwood.................................................................................. 325
Figure 227: Survey Response: Brentwood..................................................................................326
Figure 228: Response: Brentwood .............................................................................................326
Figure 229: Brentwood - Services Requested............................................................................. 327
Figure 230: Survey Response: Race, Buzzard Point...................................................................328
Figure 231: Survey Response: Income, Buzzard
Figure 232: Survey Response: Employment, Buzzard
Figure 233: Survey Response: Rent, Buzzard
Figure 234: Survey Response Buzzard
Figure 235: Survey Response: Buzzard
Figure 236: Survey Response: Buzzard
Figure
Figure
Figure
Figure
Figure 241: Survey Response: Race,
Figure 242: Survey Response: Marshall
Figure 243: Survey Response: Income, Marshall Heights
Figure 244: Survey Response: Employment,
Figure
Figure
Figure 247:
Figure
Figure
Figure
Figure
Figure
Figure
Figure
Figure
Figure
Figure
Figure
Figure
Figure
Table
Community Needs Assessment Survey Questions
1)
3)
6) What is your identifying ethnicity?
7) What is the primary language spoken in your home?
8) What is your annual household income?
9) Please indicate your highest educational level.
10)What best describes your employment status?
11) Which of the following best describes your household situation?
12) If you pay rent or a mortgage, how much do you pay per month?
13) Do you have health insurance?
14) Is there anyone in your household, including yourself, who has any of the following health conditions?
15) How much do you agree with the following statement: “I feel included in the decisions of what my neighborhood would look like in the future.”
16) How much do you agree with the following statement: “I feel safer in my neighborhood than I did a year ago.”
17) From your observations and interactions with D.C. police, how respectful were police interacting with you or with others?
18) To what extent do you agree with the following statement: “I can afford to continue to live in my neighborhood.”
19) To what extent do you agree with the following statement: “There are strong educational opportunities at the schools near where I live.”
20)What is your level of confidence in your ability to obtain a job, or a higher paying job, or receive a raise, within the next year?
21) In the last twelve months, what were some of the roadblocks for your to meet your basic needs?
1) In what ways do elected officials address your concerns within your community?
2) In what ways are you involved with your community?
3) What are some ways your neighborhood makes you feel safe or unsafe?
4) What are the living conditions like in your neighborhood?
5) How do you feel about the quality of education children and adults receive in your neighborhood?
6) If there was a vacant lot on your block, what is your preference for how the city should use the land?
7) What do you think about housing affordability in DC?
Needs
Individual and Family Level Needs. Renters, especially low-income young families are at risk of being priced out of the DC housing market when rent rates increase from year to year. 1
Individual and Family Level Needs. Low-income individuals/families require multiple services to address the systemic barriers they face. 2
Community Level Needs. The community lacks sufficient affordable housing relative to the level of need in the District of Columbia. 3
Community Level Needs. Many black and residents of color who remain in the District of Columbia are considered cost burdened and even severely cost burdened by housing costs. 4
Community Level Needs. There are an insufficient number of housing vouchers in the city relative to the number of homeless families in need. 5
Individual and Family Level Needs. Youth/young adults face a higher risk of being exposed to violent behaviors. 6
Individual and Family Level Needs. Youth/young adults lack sufficient tailored mental health support. 7
Individual and Family Level Needs. Families, especially those in Ward 8 lack sufficient affordable housing options within the city. 8
Community Level Needs. The community has relatively lower homeownership rates among black and residents of color. 9
Individual and Family Level Needs. At the onset of increased economic mobility, low-income individuals/families lose supportive services sooner than they can afford to. 10
Individual and Family Level Needs. Low-income individuals/families lack the means to pay for high childcare costs in DC. 11
Community Level Needs.The community has a high rate of black unemployment and a high rate of black and persons of color underemployment. 12
Community Level Needs. Black residents of the district are migrating out of the city due to increasing cost of housing relative to their means. 13
Community Level Needs. There is a pressing need for grocery stores located within convenient proximity to residential areas, ensuring residents have easy access to fresh and affordable food. 14
Community Level Needs. DC students continue to suffer from learning loss that dates back to the pandemic. 15
Community Level Needs. The community has a high rate of black residents in poor health. 16
Community Level Needs. The community has insufficient resources available to residents who lack mental wellness. 17
Agency Needs. There is a need for enhanced inter-departmental knowledge sharing (reduced silos) between and among the different departments and staff in the organization. 18
Individual and Family Level Needs. Youth face a higher risk of falling behind educational grade-level. 19
Community Level Needs. The community has many residents who use opioids to self-medicate mental illness and has a high incidence of opioid deaths. 20
Individual and Family Level Needs. Low-income families lack gainful employment. 21
Individual and Family Level Needs. Low-income families and individuals in DC desire greater influence in shaping the policies enacted by the DC council and DC government. 22
Community Level Needs. The community has a high rate of property crime. 23
Individual and Family Level Needs. Youth/young adults are increasingly involved in crimes/violence. 24
Community Level Needs. Community residents are insufficiently informed about the employment implications of marijuana use in the District of Columbia especially for jobs that are accessible to lower-in 25
Individual and Family Level Needs. Low-income individuals/families lack the skills to obtain living wage jobs. 26
Community Level Needs. The community has a high rate of domestic violence. 27
Community Level Needs. The community lacks sufficient job opportunities located close to low-income residents. 28
Community Level Needs. Early childhood programs in DC lack sufficient funding. 29
Community Level Needs. The community has high a rate of adverse prenatal outcomes. 30
Individual and Family Level Needs. Children, especially infants and toddlers, in families in Wards 7 and 8 lack sufficient affordable, high-quality early childhood education programs. 31
Individual and Family Level Needs. Individuals/families have high incidents of high blood pressure. 32
Community Level Needs. The community has insufficient resources available to residents who lack the requisite education/credentials for the purpose of securing and maintaining living wage jobs. 33
Agency Needs. The agency lacks the level of funding needed to supplement grant funding of staff salaries in order for UPO to be a competitive employer in the DC, Maryland, Virginia region. 34
Community Level Needs. The community is faced with reduced public transportation options for low-income DC residents due to cutbacks by WMATA resulting from operational and financial challenges. 35
Agency Needs. The agency lacks the level of funding needed to fund staff incentives (gift card, coupons) that motivate accurate data entry and incentivize data system users to remain active in data entry
Agency Needs. The agency is faced with regional competitiveness gaps in staff benefits and compensation.
Agency Needs. The agency lacks sufficient unrestricted funding to provide adequate dosing of services to DC residents above the 200% of the Federal Poverty Line but who lack economic security. 38
Individual and Family Level Needs. Families engage with the city’s public education system at a level insufficient for student success. 39
Individual and Family Level Needs. Individuals/families lack sufficient knowledge of existing support programs and opportunities available for meeting their economic security related needs.
Individual and Family Level Needs. Older individuals (aged 45-64) have few options for affordable higher education opportunities, degrees, and certifications. 42
Agency Needs. The agency lacks the level of funding needed to cover the cost of stipends paid to customers who spend significant numbers of hours in training received from UPO. 43
Agency Needs. The agency’s external communications systems require improvement.
Agency Needs. The agency lacks the level of funding needed to support youth violence prevention programming, i. e. , space use, supplies, additional staff, support vendors. 45
Agency Needs. There are insufficient number of organized opportunities for internal connection and engagement among the staff. 46
Agency Needs. The agency lacks the level of funding needed to hire/maintain a Cyber Security engineer, a software engineer, additional communications and development staff, and additional legislative a 47
Community Level Needs. The community lacks sufficient summer feeding programs during the summer months when school meal programs are unavailable. 48
Agency Needs. The agency’s staff and departments possess untapped technological capacity ( e. g. move from paper to digital tools).
49
Agency Needs. The agency’s referral process for serving customers who require external or internal referrals for services lacks sufficient clarity across programs. 50
Agency Needs. The agency lacks a functional centralized event calendar. 51
Agency Needs. The agency lacks the level of funding needed for CREATE, EPIC Book Club and POWER to be effective. 52
Agency Needs. The agency provides inadequate language accessibility for nonEnglish speakers and needs more bilingual and multi-lingual materials—forms, fliers, website content.
53
Agency Needs. Multiple departments in the organization lack a statement of purpose. 54
Agency Needs. The agency provides insufficient wrap-around service tools for customers served. 55
Agency Needs. The agency does not update distributed materials consistently (flyers, forms, etc. ) to ensure current program details and contact information is available to the public. 56
Agency Needs. The agency lacks the requisite level of “boots on the ground” to conduct effective community outreach and community engagement.
Andrea Thomas, President & Chief Executive Officer
Daniel Ofori-Addo, Chief Impact Officer & Executive Vice President
Connor Zielinski, Social Science Research Analyst
Kevin Bryant, Director of Business Development and Asset Management
Ed Lazere, Director of Legislative Advocacy
Ayanna Bias, Director of Community Advocacy
Keenan Woods, Director of Performance Management
Jo Boukhira, Director of Development and Communications
Bernadette Ferrell, Volunteer Coordinator
Regina Murphy, Director of Community Impact
Kane’a Stover, Community Impact Facilitator
Krystal Gooby, Community Impact Facilitator
57
Shawntay Kent, Community Impact Facilitator
Janiya Proctor, Community Outreach Coordinator
Zohar Rom, Staff Writer & Editor
Marques Ross, Multimedia Communications Specialist
Chi Vo, Print & Digital Media Manager
Focus Group Participants