CHAPTER 1: DEVELOPMENTS IN INTERNATIONAL SEABORNE TRADE
Consequently, it may be argued that long-term trade recovery depends on trends in GDP growth as well as on how the relationship between trade and GDP unfolds and whether relevant initiatives to further stimulate demand and trade are implemented. These may include stimulating demand for investment goods (for example, capital goods, transport and equipment) that are more import intensive; reorganizing supply chains with a new scope for the division of international labour, including in South Asia, sub-Saharan Africa and South America; increasing trade finance; furthering the liberalization of trade and reducing protective measures. In this respect, the potential for greater trade liberalization is firming up with the adoption of the World Trade Organization (WTO) Trade Facilitation Agreement (TFA) and the negotiations relating to the potential expansion of the WTO Information Technology Agreement. Other initiatives including, among others, the Transatlantic Trade and Investment Partnership between the European Union and the United States, which could raise the transatlantic annual GDP by $210 billion (Francois et al., 2013) and the TransPacific Partnership, which could boost world income by $295 billion, also have the potential to further stimulate global trade (Petri and Plummer, 2012).
5
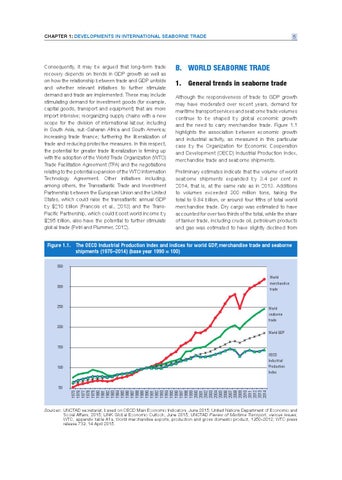
B. WORLD SEABORNE TRADE 1. General trends in seaborne trade Although the responsiveness of trade to GDP growth may have moderated over recent years, demand for maritime transport services and seaborne trade volumes continue to be shaped by global economic growth and the need to carry merchandise trade. Figure 1.1 highlights the association between economic growth and industrial activity, as measured in this particular case by the Organization for Economic Cooperation and Development (OECD) Industrial Production Index, merchandise trade and seaborne shipments. Preliminary estimates indicate that the volume of world seaborne shipments expanded by 3.4 per cent in 2014, that is, at the same rate as in 2013. Additions to volumes exceeded 300 million tons, taking the total to 9.84 billion, or around four fifths of total world merchandise trade. Dry cargo was estimated to have accounted for over two thirds of the total, while the share of tanker trade, including crude oil, petroleum products and gas was estimated to have slightly declined from
Figure 1.1. The OECD Industrial Production Index and indices for world GDP, merchandise trade and seaborne shipments (1975–2014) (base year 1990 = 100) 350 World merchandise trade
300
250
World seaborne trade
200 World GDP
150 OECD Industrial Production Index
100
1975 1976 1977 1978 1979 1980 1981 1982 1983 1984 1985 1986 1987 1988 1989 1990 1991 1992 1993 1994 1995 1996 1997 1998 1999 2000 2001 2002 2003 2004 2005 2006 2007 2008 2009 2010 2011 2012 2013 2014
50
Sources: UNCTAD secretariat, based on OECD Main Economic Indicators, June 2015; United Nations Department of Economic and Social Affairs, 2015; LINK Global Economic Outlook, June 2015; UNCTAD Review of Maritime Transport, various issues; WTO, appendix table A1a, World merchandise exports, production and gross domestic product, 1950–2012; WTO press release 739, 14 April 2015.