






Notes
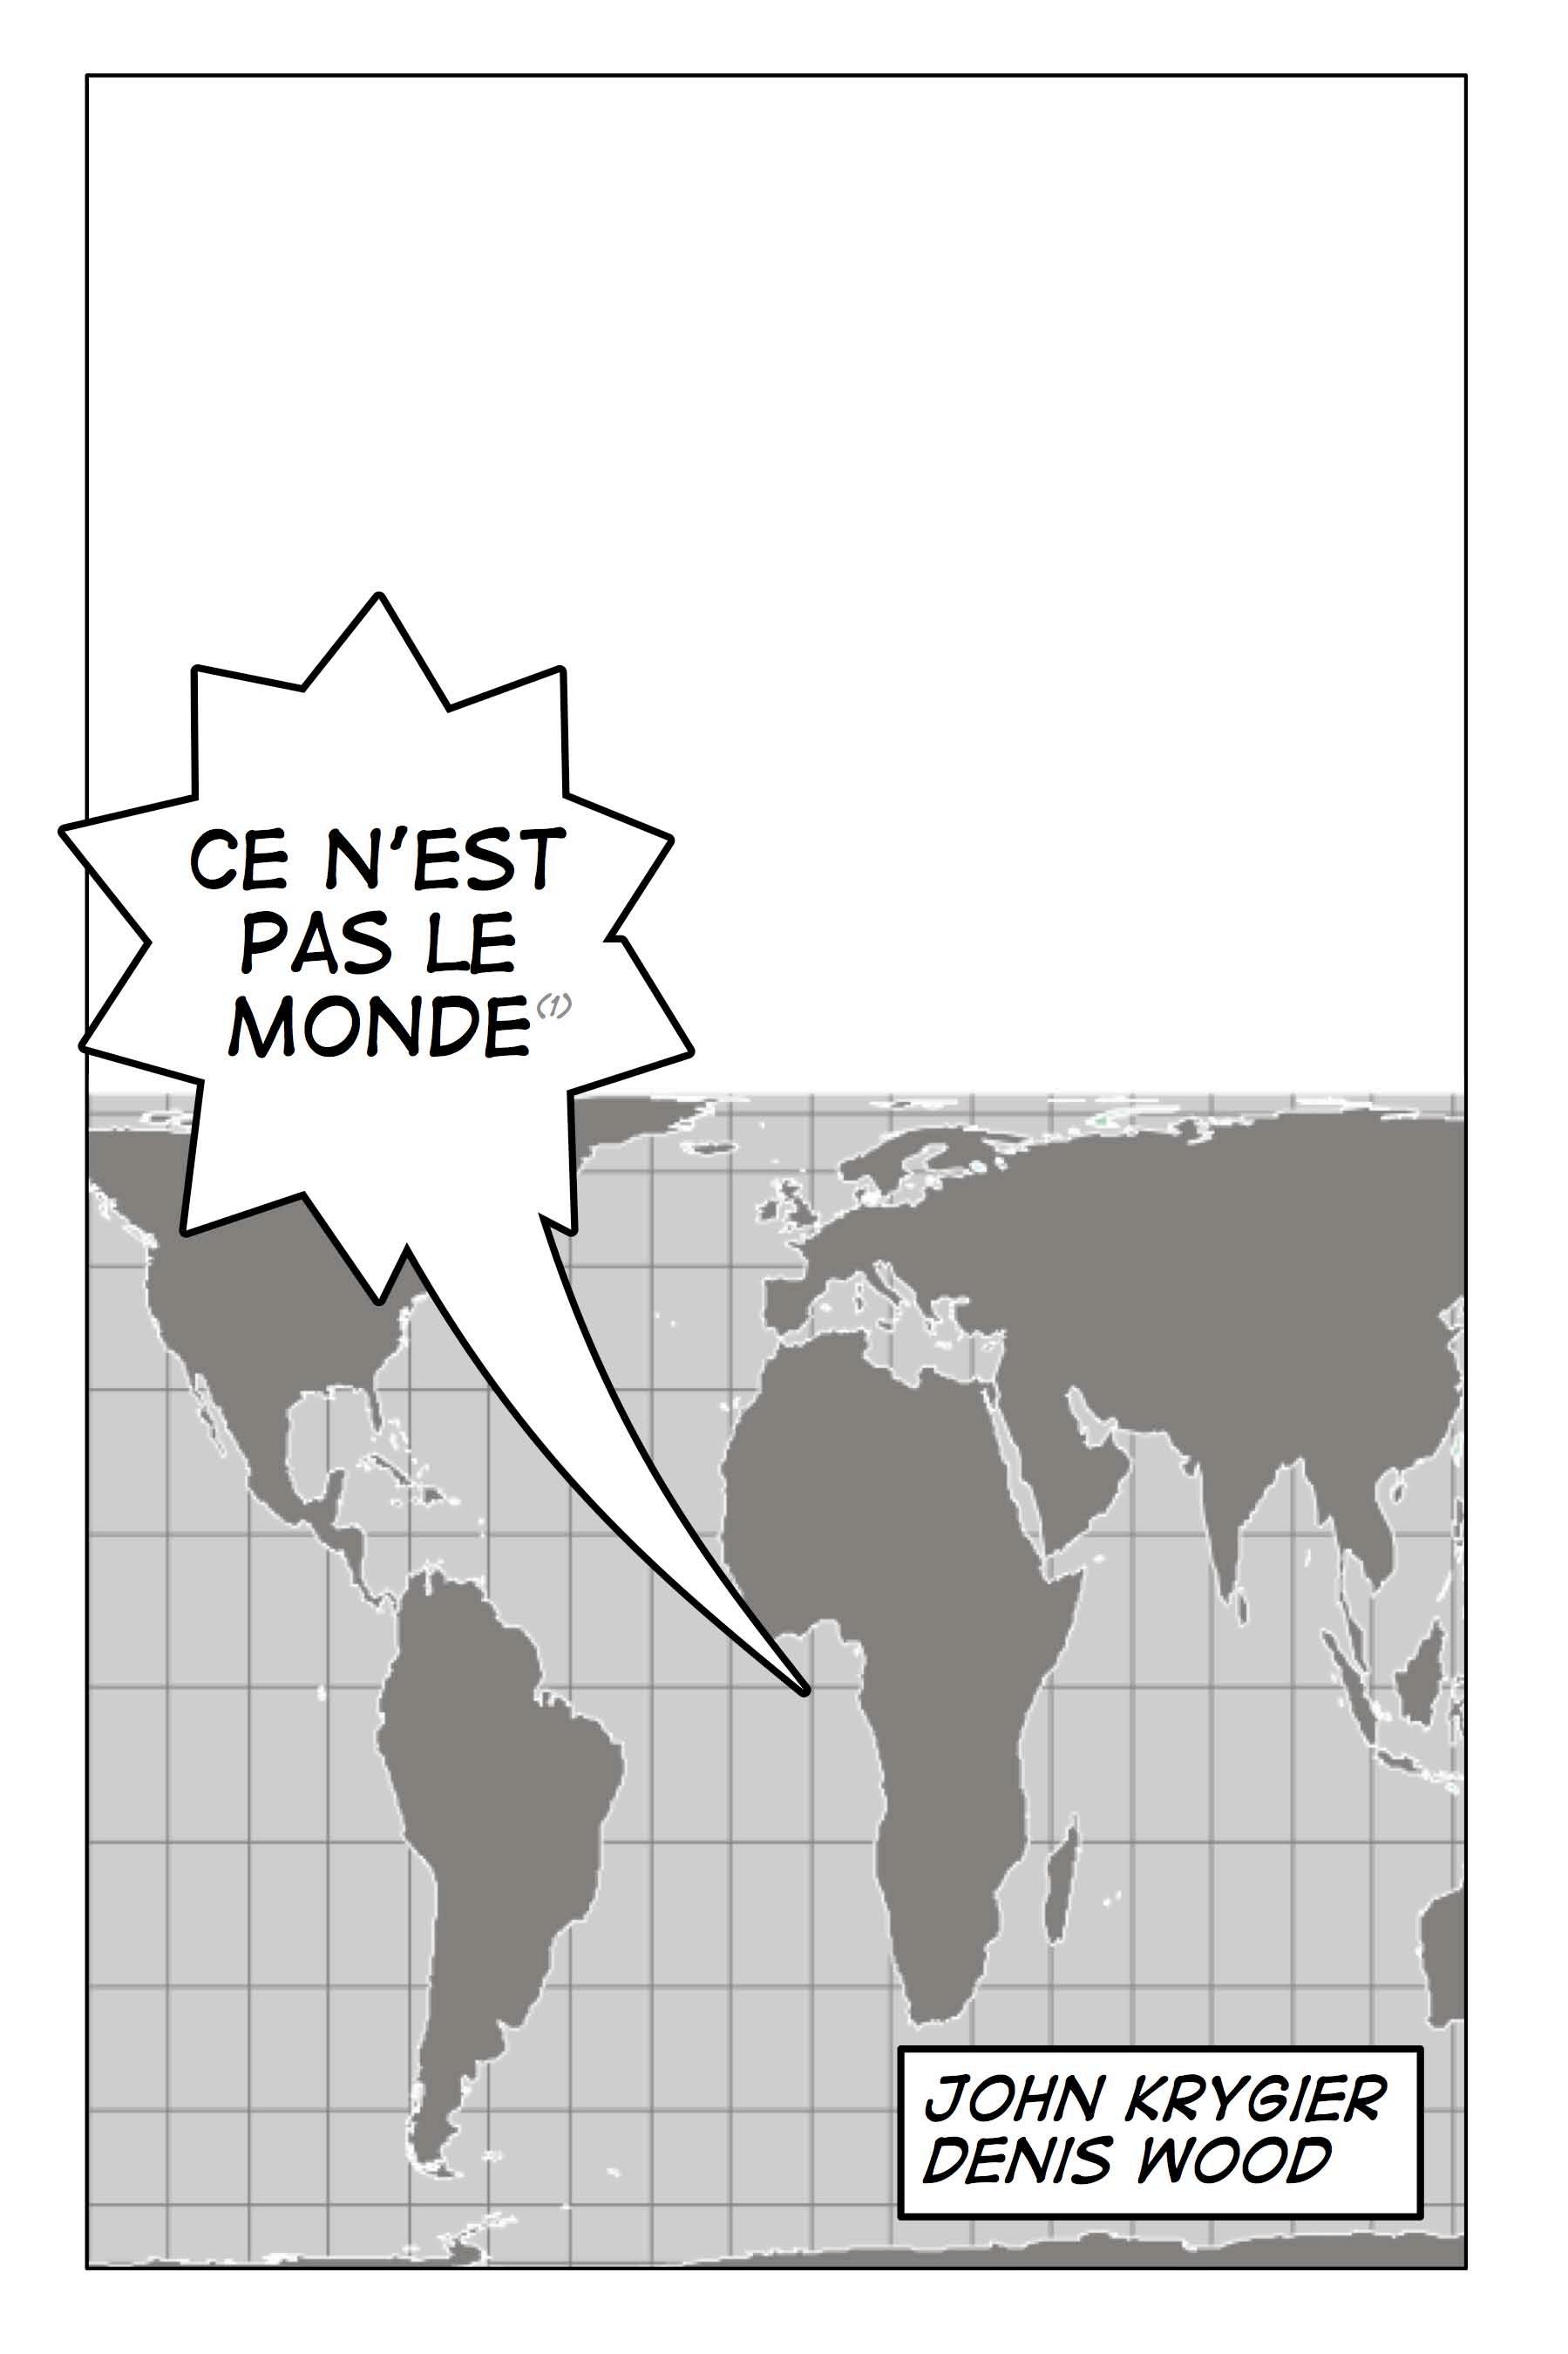
[1] Ce n’est pas le monde is an experiment in rethinking maps and discourse about maps: a proposition about maps as propositions and about comic books as academic discourse in the form of a comic book of propositional maps. We created “Ce n’est pas le monde” in June, 2006, with Comic Life software, presenting it at the Critical Geography Mini Conference (Columbus, Ohio) and the North American Cartographic Information Society (Madison, Wisconsin), both in October, 2006, and the Geography and Humanities Symposium (Charlottesville, Virginia) in June, 2007. Comments received helped us bring it to its current form which we hope recalls the alternative comics that emerged in the 1960s (see Charles Hatfield, Alternative Comics: An Emerging Literature, University Press of Mississippi, Jackson, 2005) while at the same time profiting from Scott McCloud’s comicbook reading of comics through the lens of C. S. Peirce’s semiotics (in McCloud’s Understanding Comics, Kitchen Sink Press, Northampton (MA), 1993). In particular, McCloud exploits Peirce’s understanding of icons, indices, and symbols (see Alan Manning, “Scott McCloud – Understanding Comics,” IEEE Transactions on Professional Communication 41, March 1998, pp. 60-69).
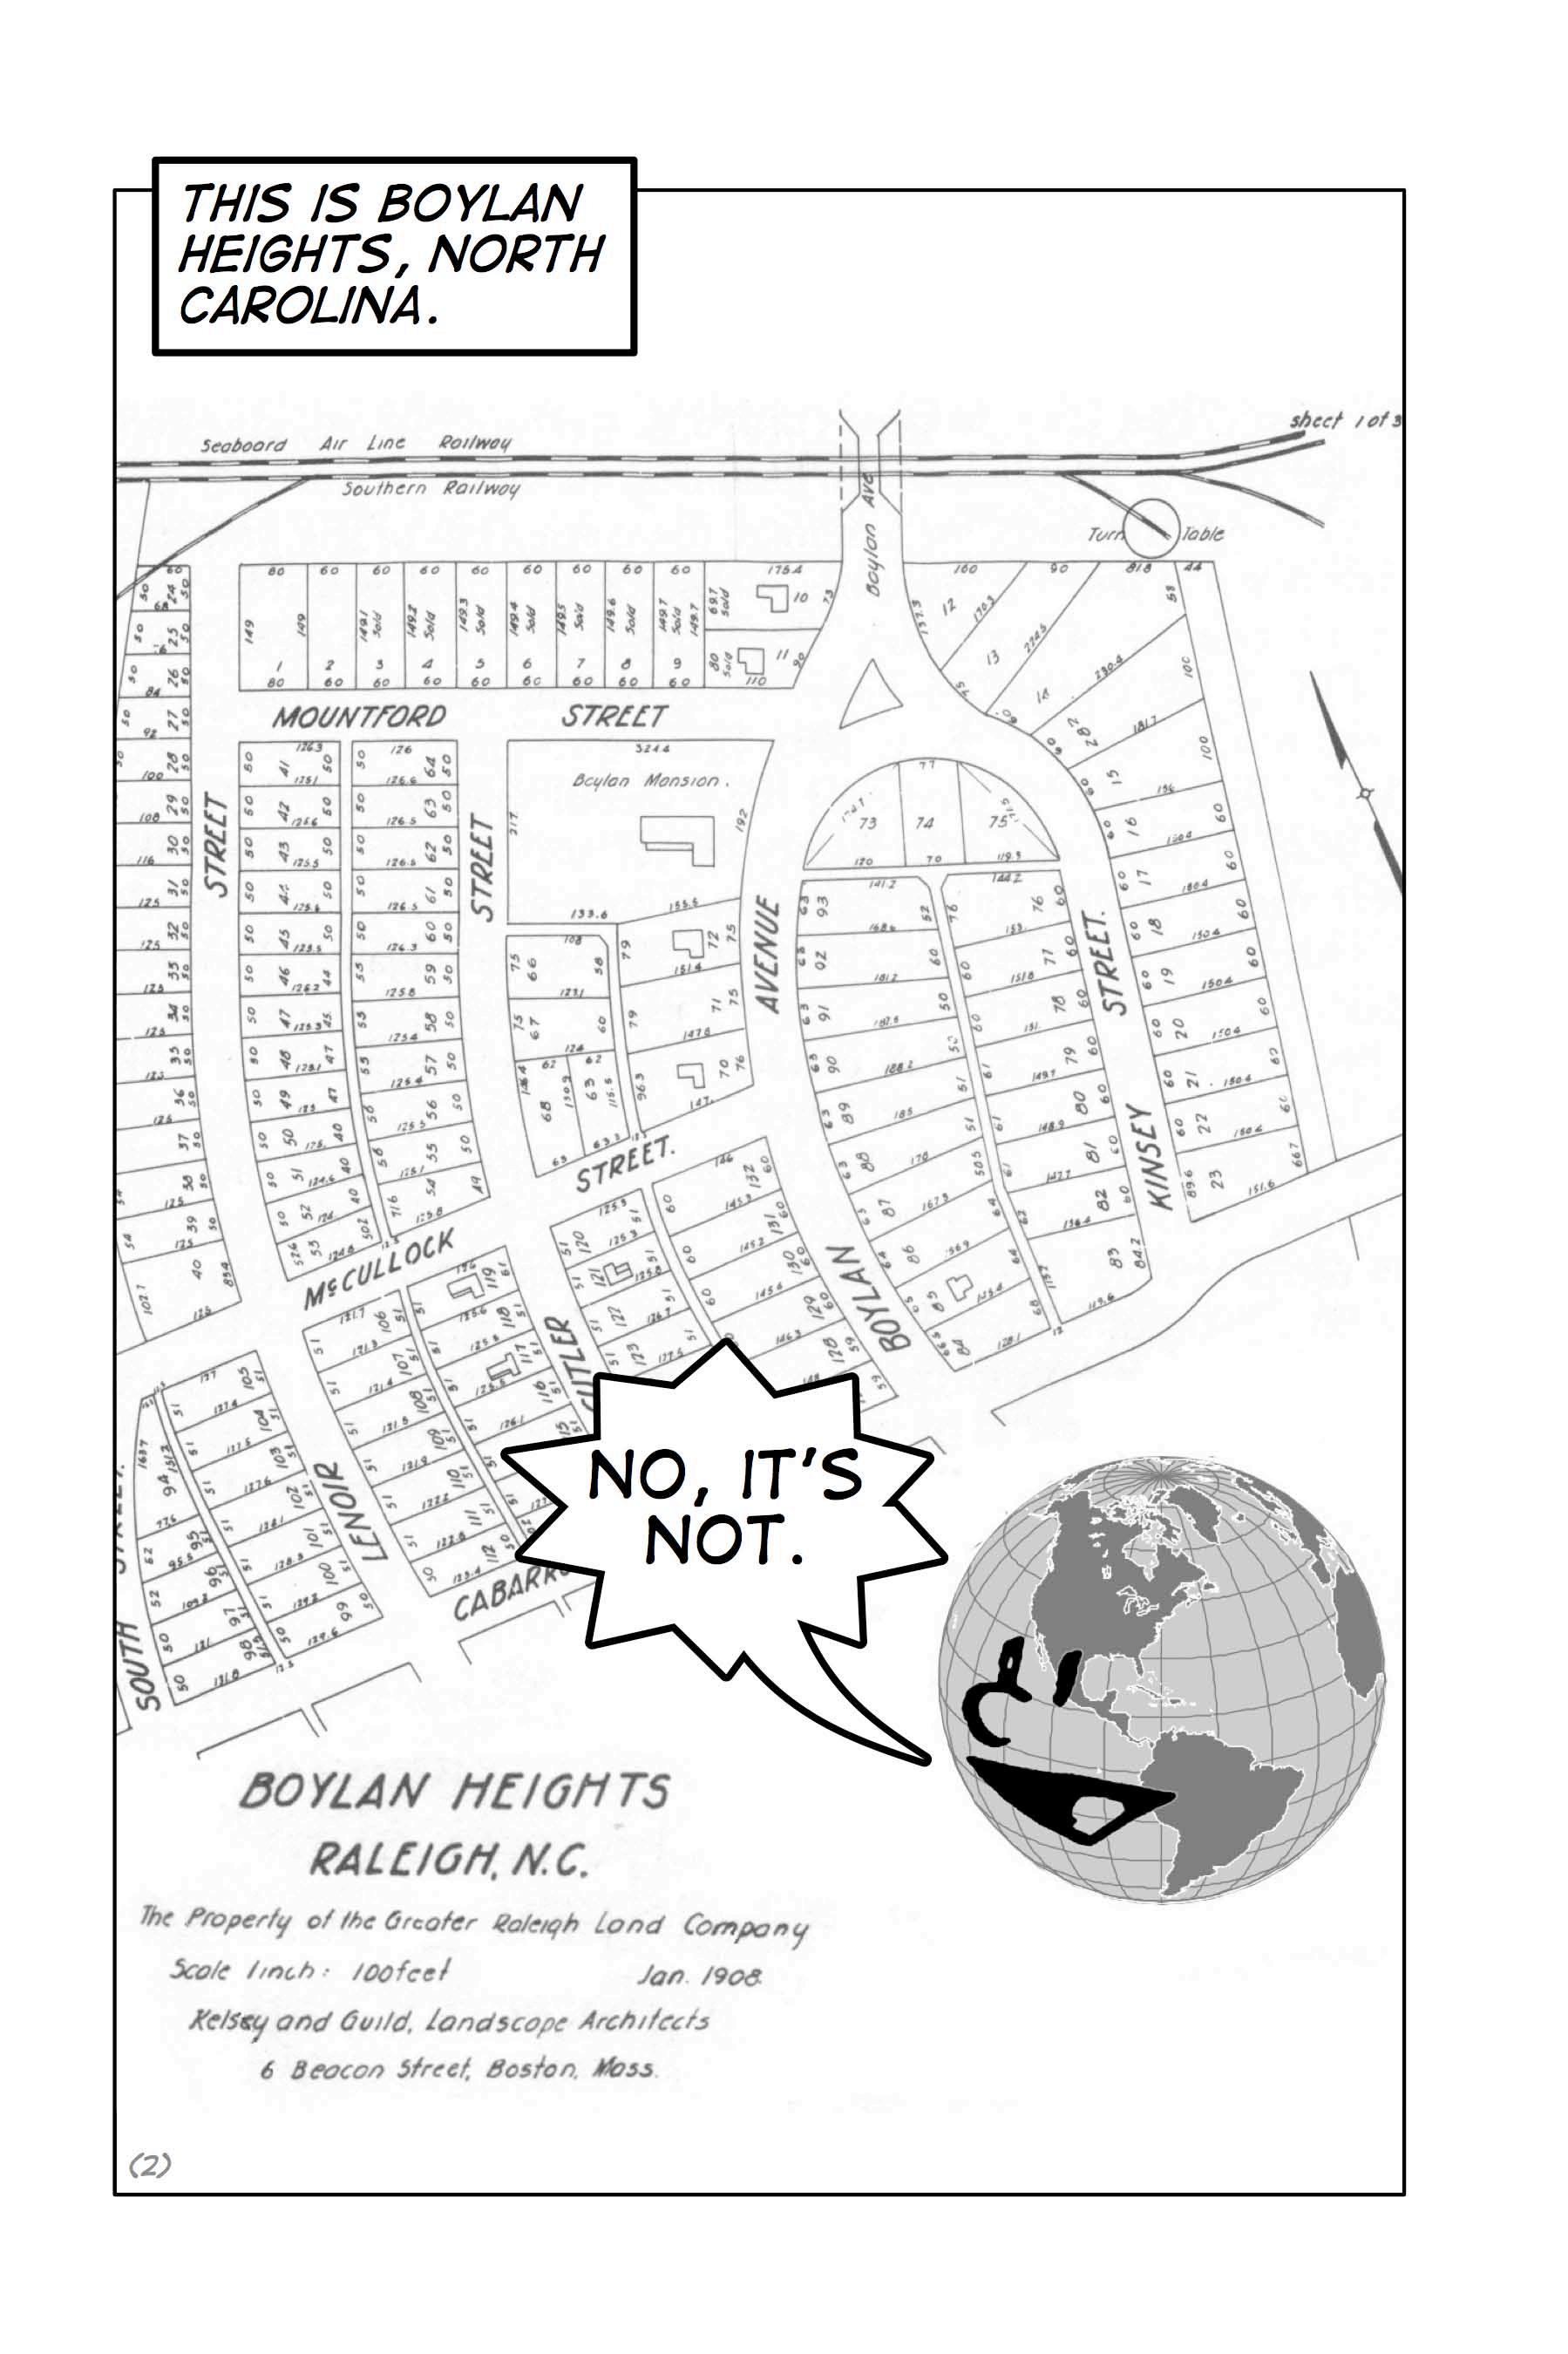
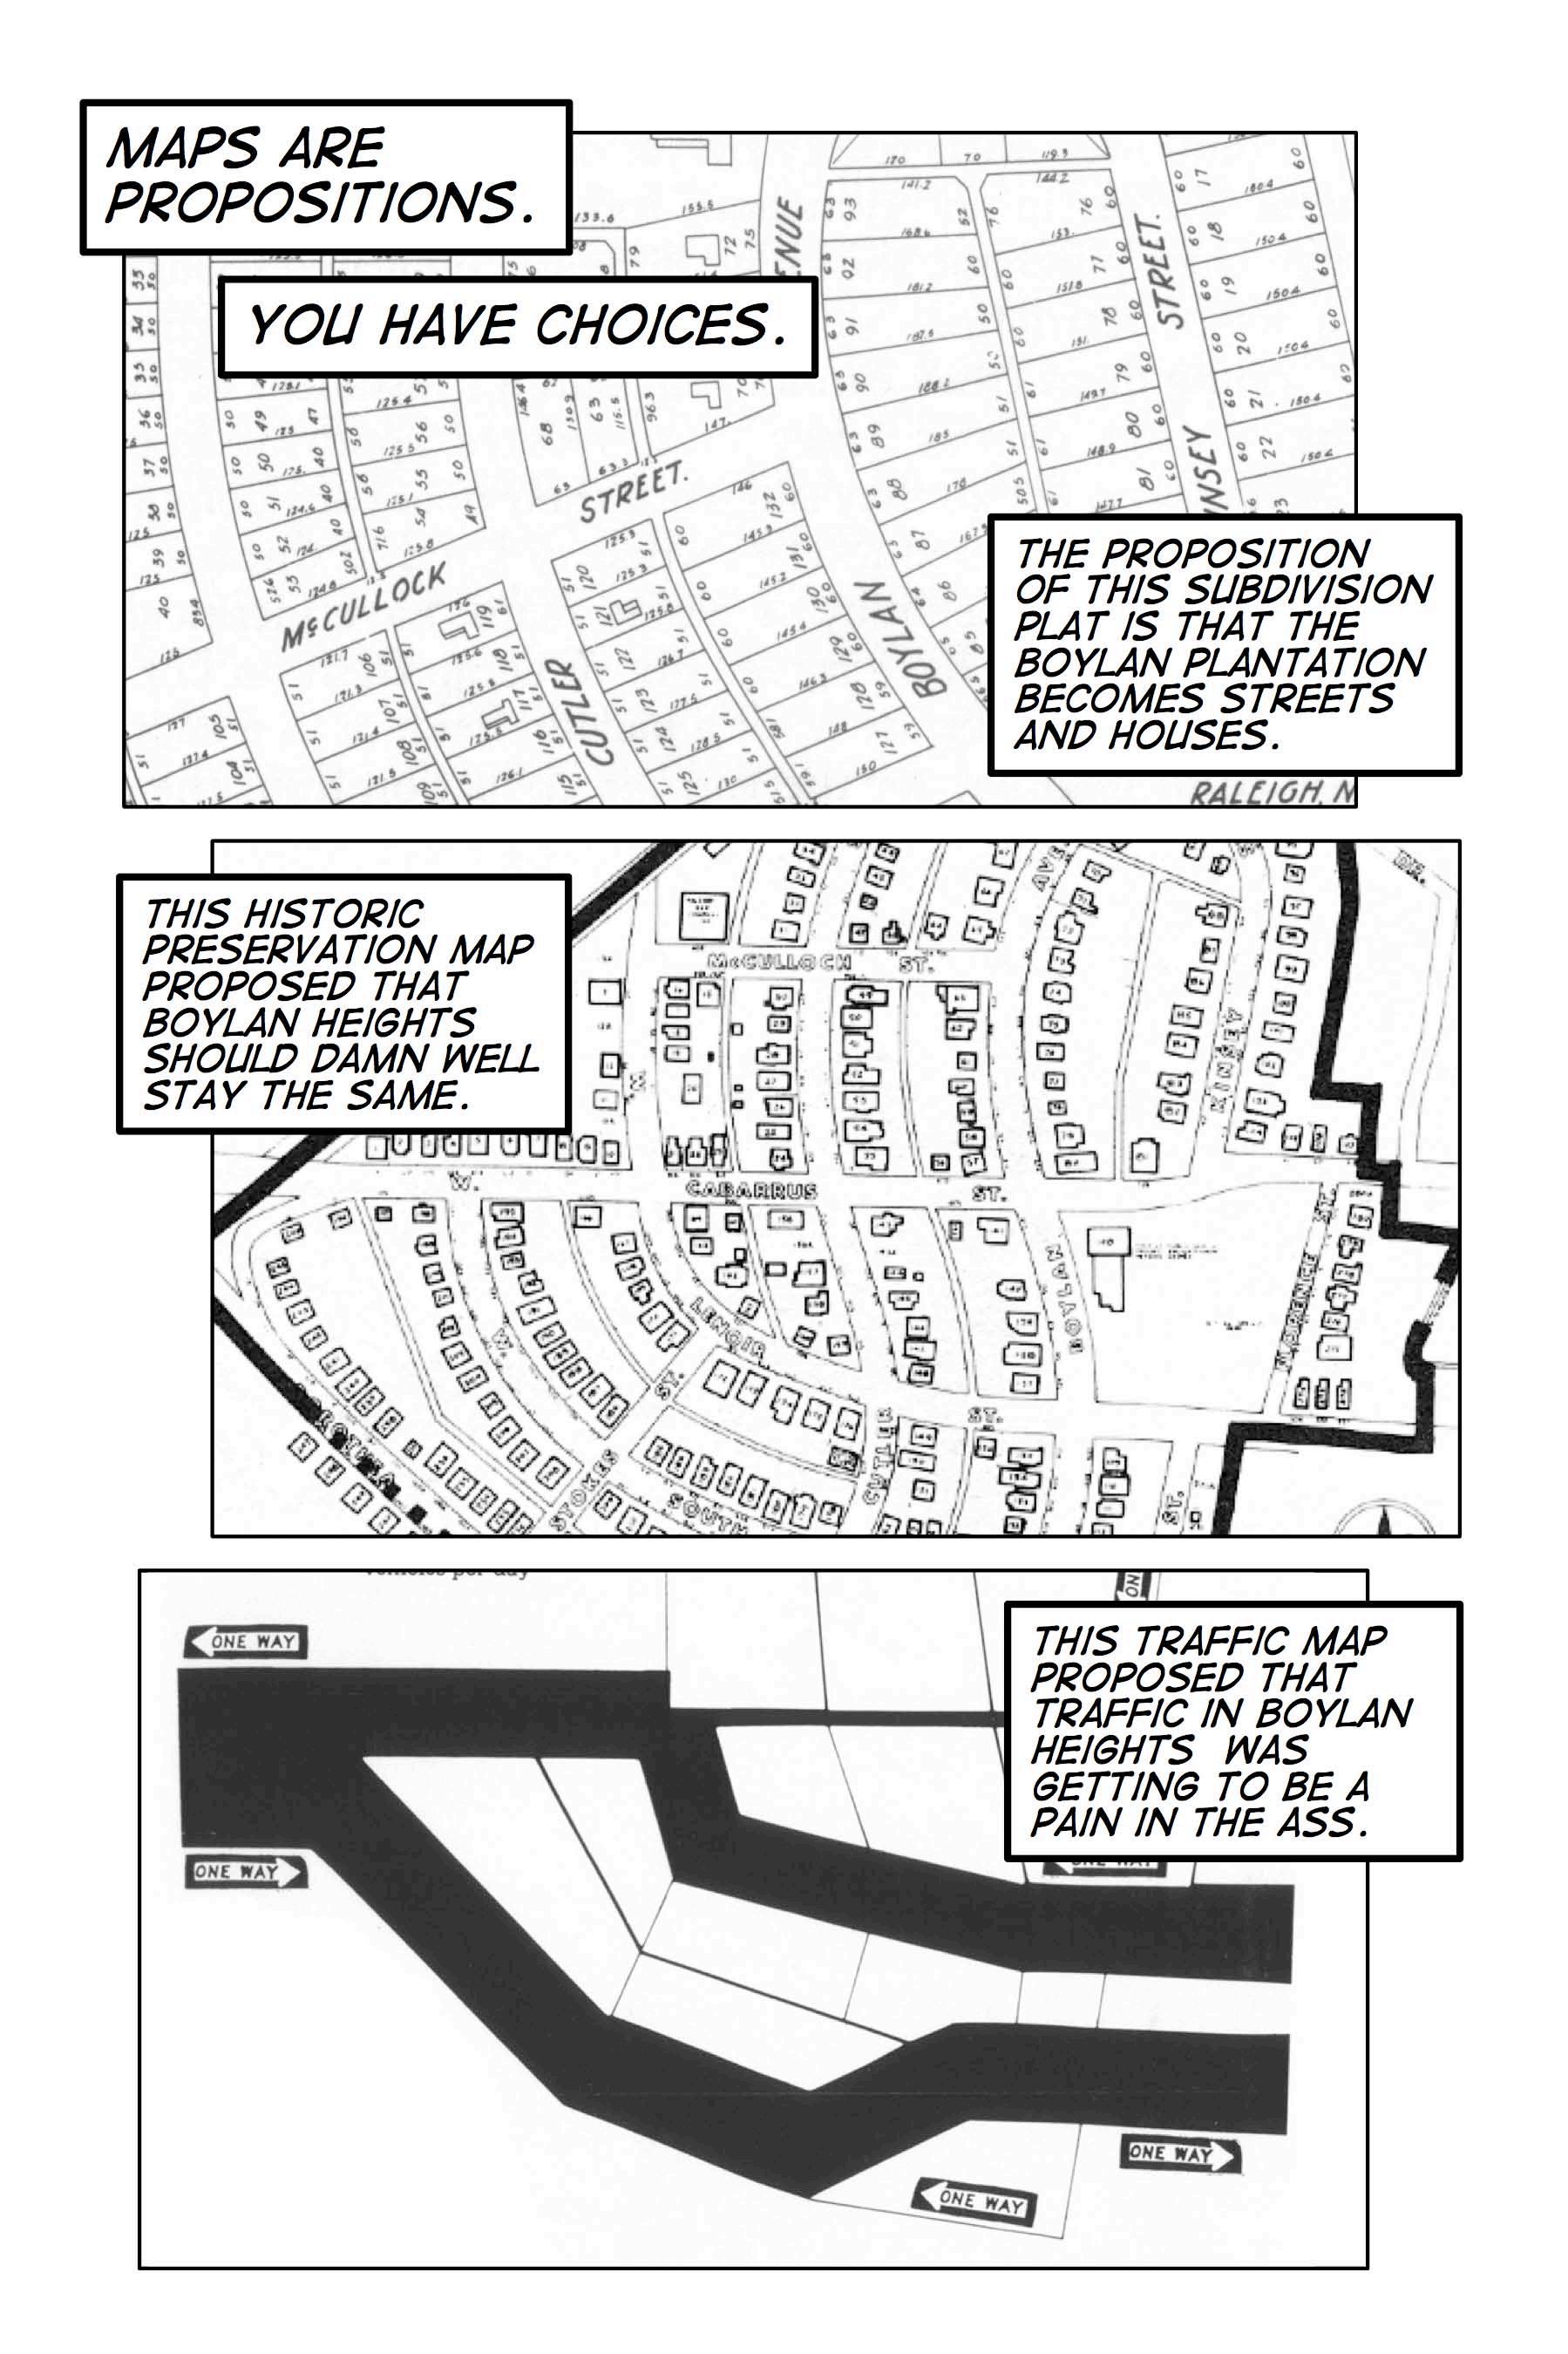
[2] We are far from the first to argue that maps are not representations but propositions (for example, see H. B. Acton. “Man-made Truth.” Mind, New Series 47(186), 1938, pp. 145-158), or to allude to René Magritte’s Treachery of Images (1928-29), his famed painting of a pipe inscribed, “Ceci n'est pas une pipe.” Our map here, Boylan Heights, Raleigh, N.C. (1908), by Boston landscape architects Kelsey and Guild, literally proposed Boylan Heights as a place, since before the building of the houses and the moving in of the residents, this map was the sole form in which Boylan Heights existed. As built, the neighborhood realized this proposal. Reproduced from the Book of Maps 1885 (p. 114), Wake County [North Carolina] Registry.
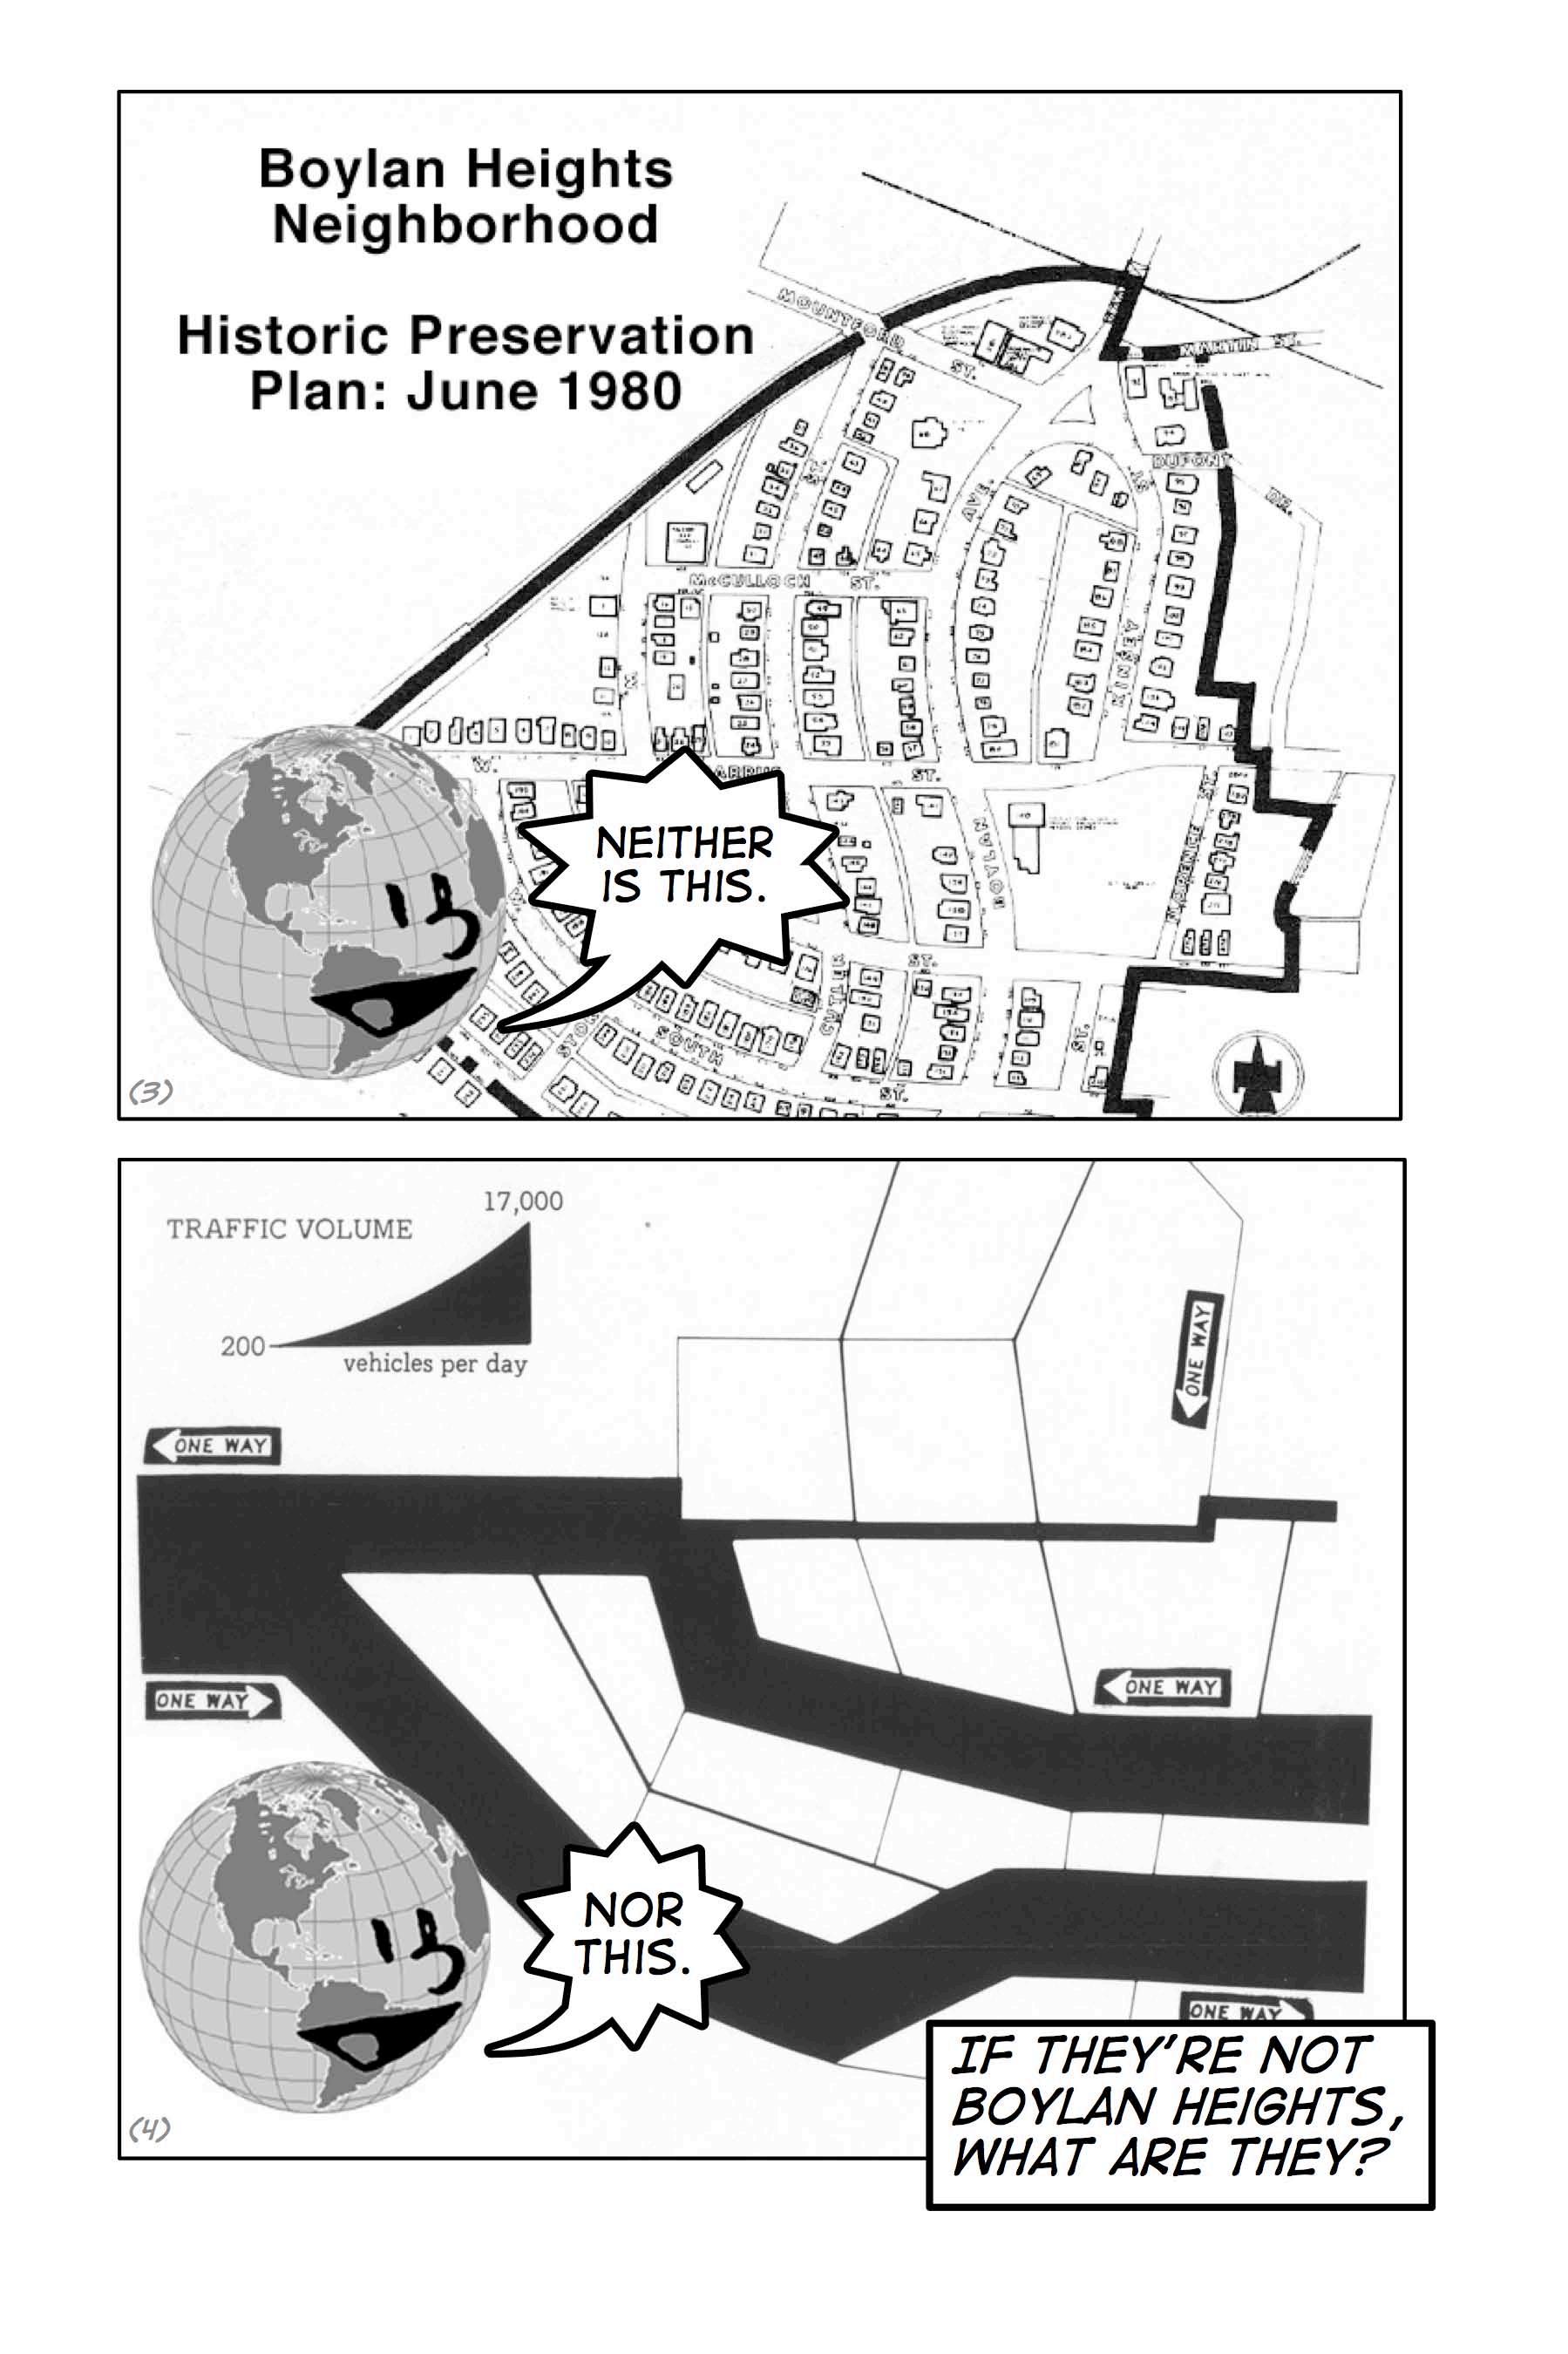
[3] Boylan Heights Neighborhood Historic Preservation Plan (1980) advances an alternative proposition, that of Boylan Heights an historic exemplar, “a classic early 20th century neighborhood,” worthy of having its character preserved.
[4] The propositions advanced by Boylan Heights Traffic Volume (1981), from Wood’s unpublished Dancing and Singing: A Narrative Atlas of Boylan Heights, are that traffic flowed through Boylan Heights in the volumes indicated. The argument advanced was that the traffic played a profound role in the neighborhood’s life. The study of arguments was first given rigorous treatment in Aristotle’s Organon. That Aristotle’s syllogistic logic presupposed the more fundamental logic of propositions was established in the wake of Leibniz’s work on the logical calculus, subsequently the calculus of propositions. We are attracted to the calculus of propositions because, as Bertrand Russell put it, “A proposition, we may say, is anything that is true or that is false,” and “The propositional calculus is characterized by the fact that all its propositions have as hypothesis and as consequent the assertion of a material implication” (Principles of Mathematics, Second Edition, Norton, New York, 1938). Certainly this is true of maps as well. Also see Howard Pospesel’s Introduction to Logic: Propositional Logic (Prentice Hall, Upper Saddle River, 1998).
[5] J. H. Andrews collected 321 definitions of “map,” dating from 1649 to 1996, in preparation for his article “What Was a Map? The Lexicographers Reply” (Cartographica 33(4), 1996, pp. 1-11). We loaded them into the Analys.icio.us semantic cloud generator that produced the display of which we present a detail. The visual is often more effective than the verbal, a claim we make about both maps and comics (see Mariam Ginman & Sara von Ungern-Sternberga, “Cartoons as Information,” Journal of Information Science 29(1), 2003, pp. 69–77).
[6] Here Andrews turned to three twentieth century voices for definitions of the map. Max Eckert wrote the influential Die Kartenwissenschaft Die Kartenwissenschaf: Forschungen und Grundlagen zu einer Kartographie als Wissenschaft (W. De Gruyter, Berlin, 1921/25), but Andrews quoted from his more accessible paper, “On the Nature of Maps and Map Logic,” Bulletin of the American Geographical Society 40(6), 1908, pp. 344-351, with the quoted remark on p. 345. Arthur Robinson was Eckert’s principle intellectual heir, dominating cartography in the second half of the twentieth century as Eckert had the first. Andrews pulled the “map is a representation of the milieu” definition from Robinson and Barbara Bartz Petchenik’s The Nature of Maps: Essays Toward Understanding Maps and Mapping (University of Chicago Press, Chicago, 1976, pp. 15-16). Andrews quoted Wood
from his paper, “How Maps Work” (Cartographica 29(3 & 4), 1991, pp. 66-74, the quotation on p. 66).
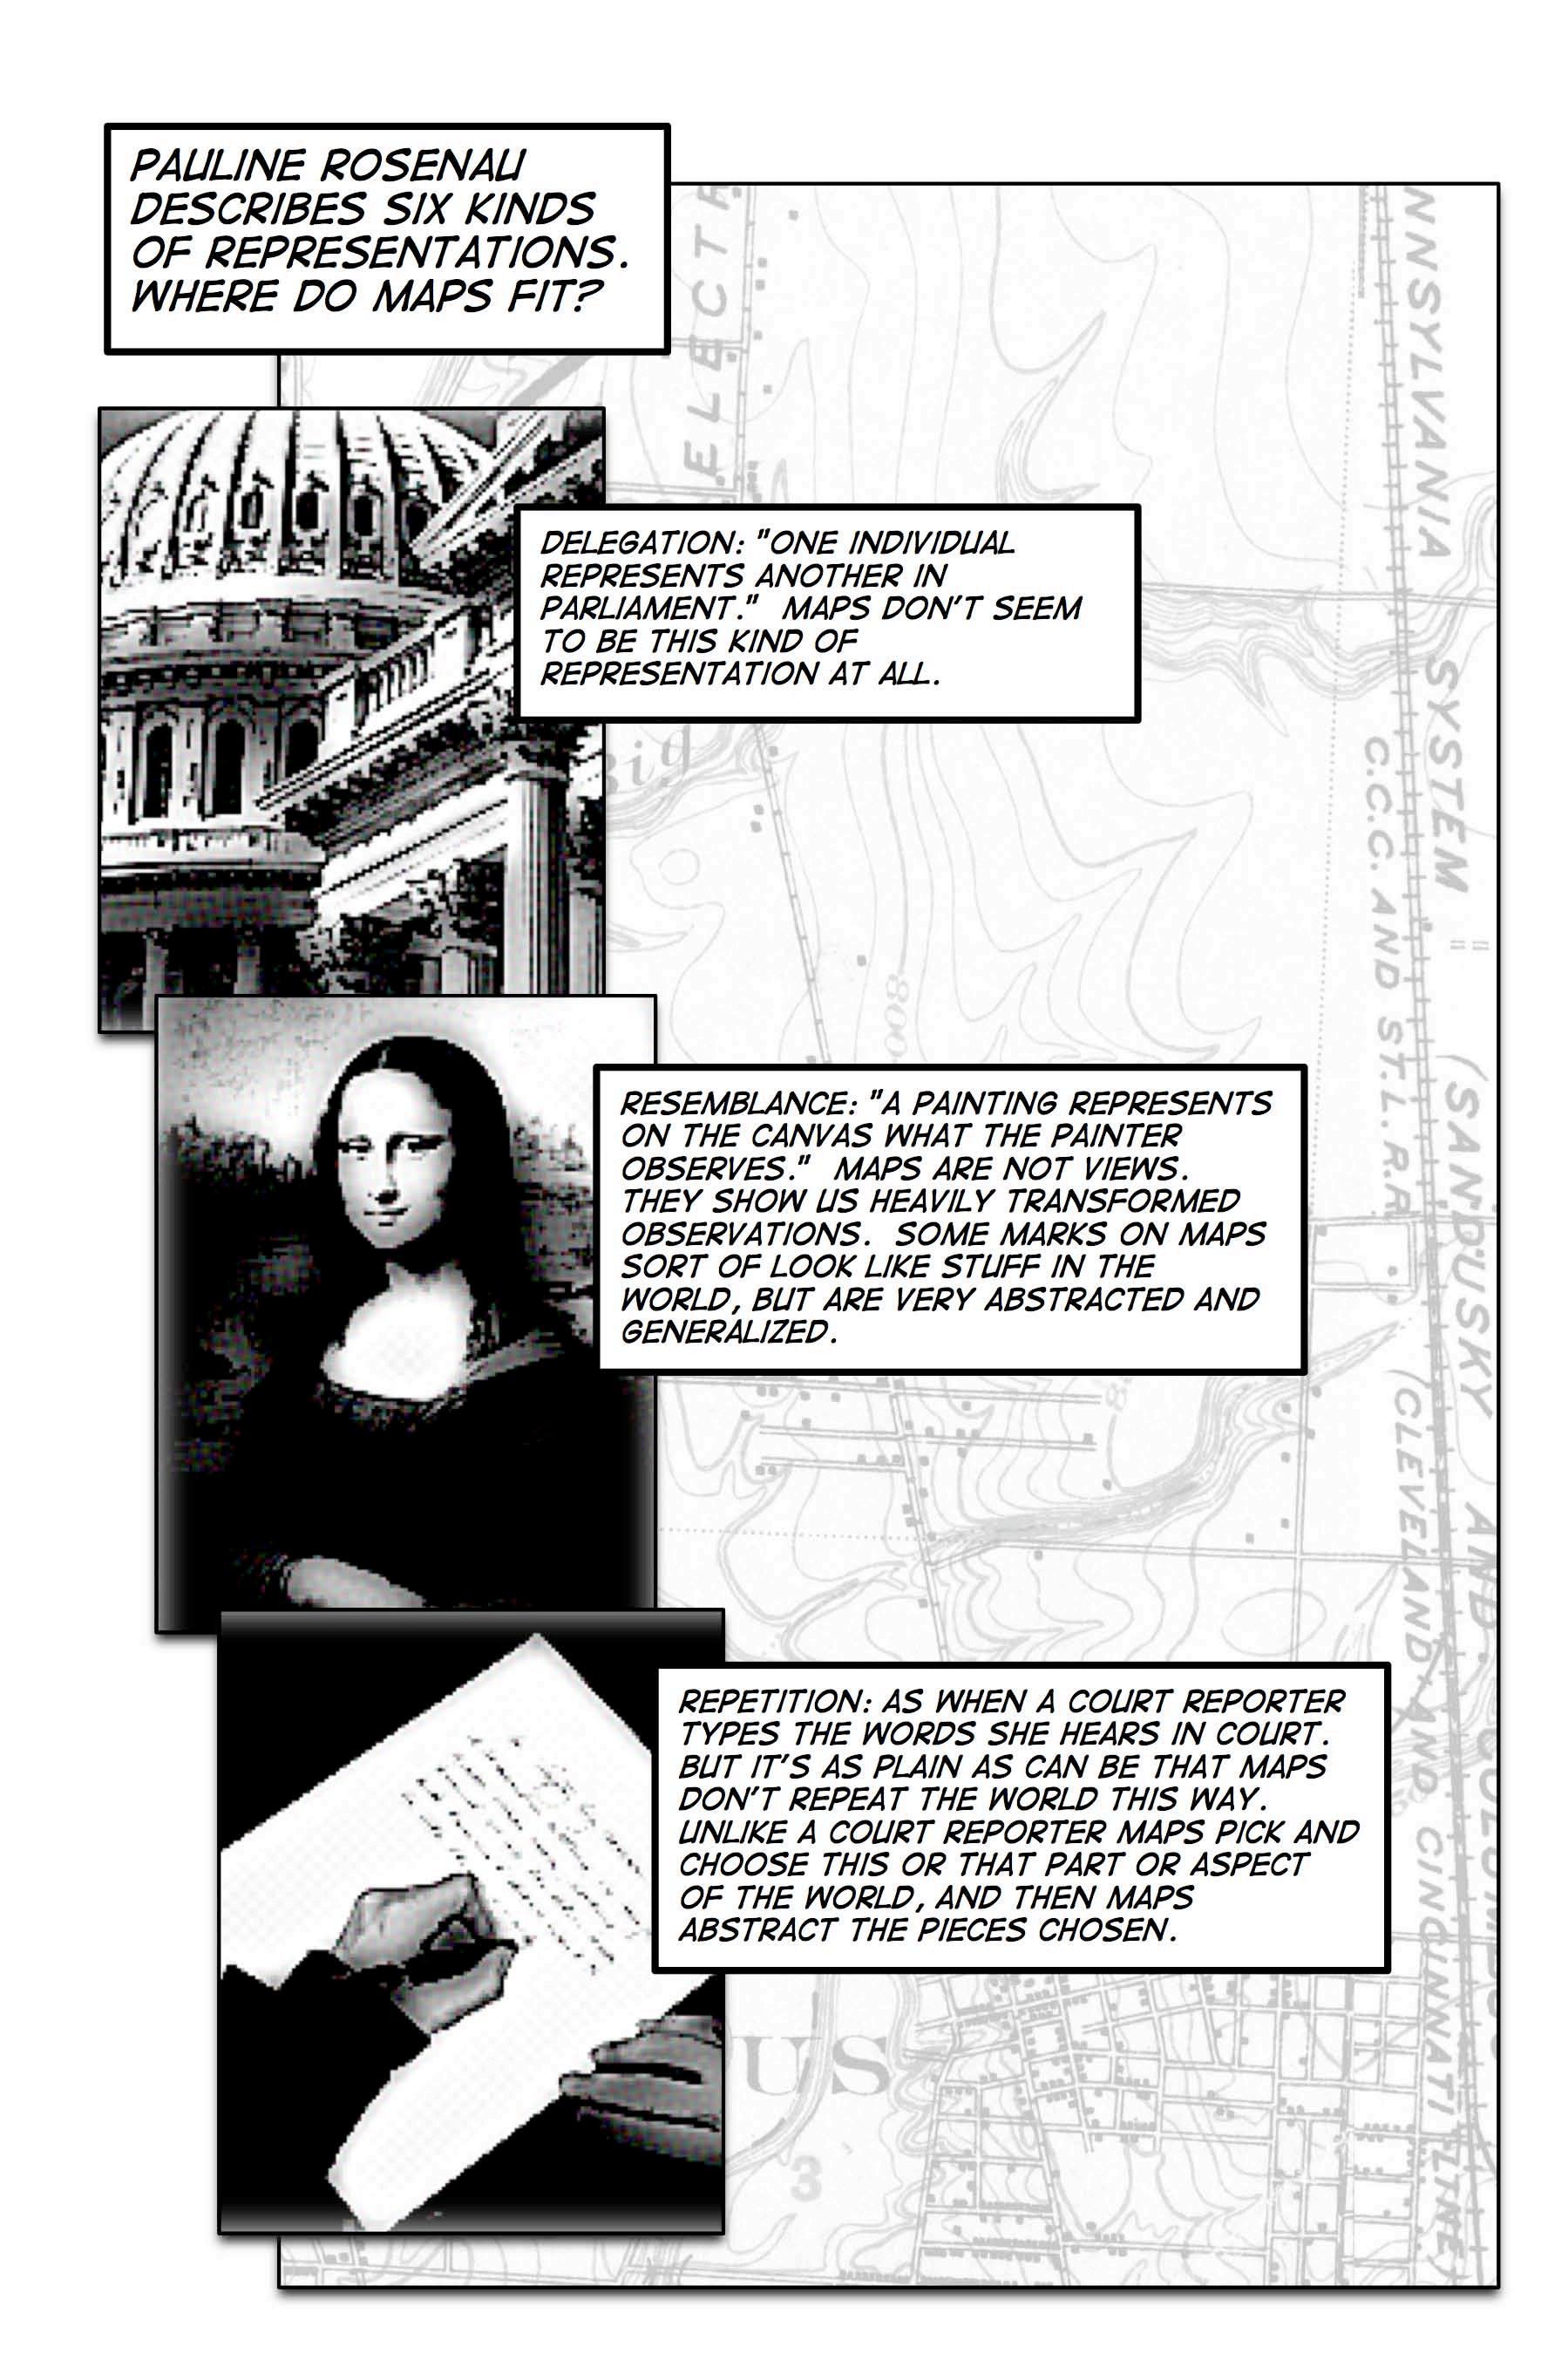
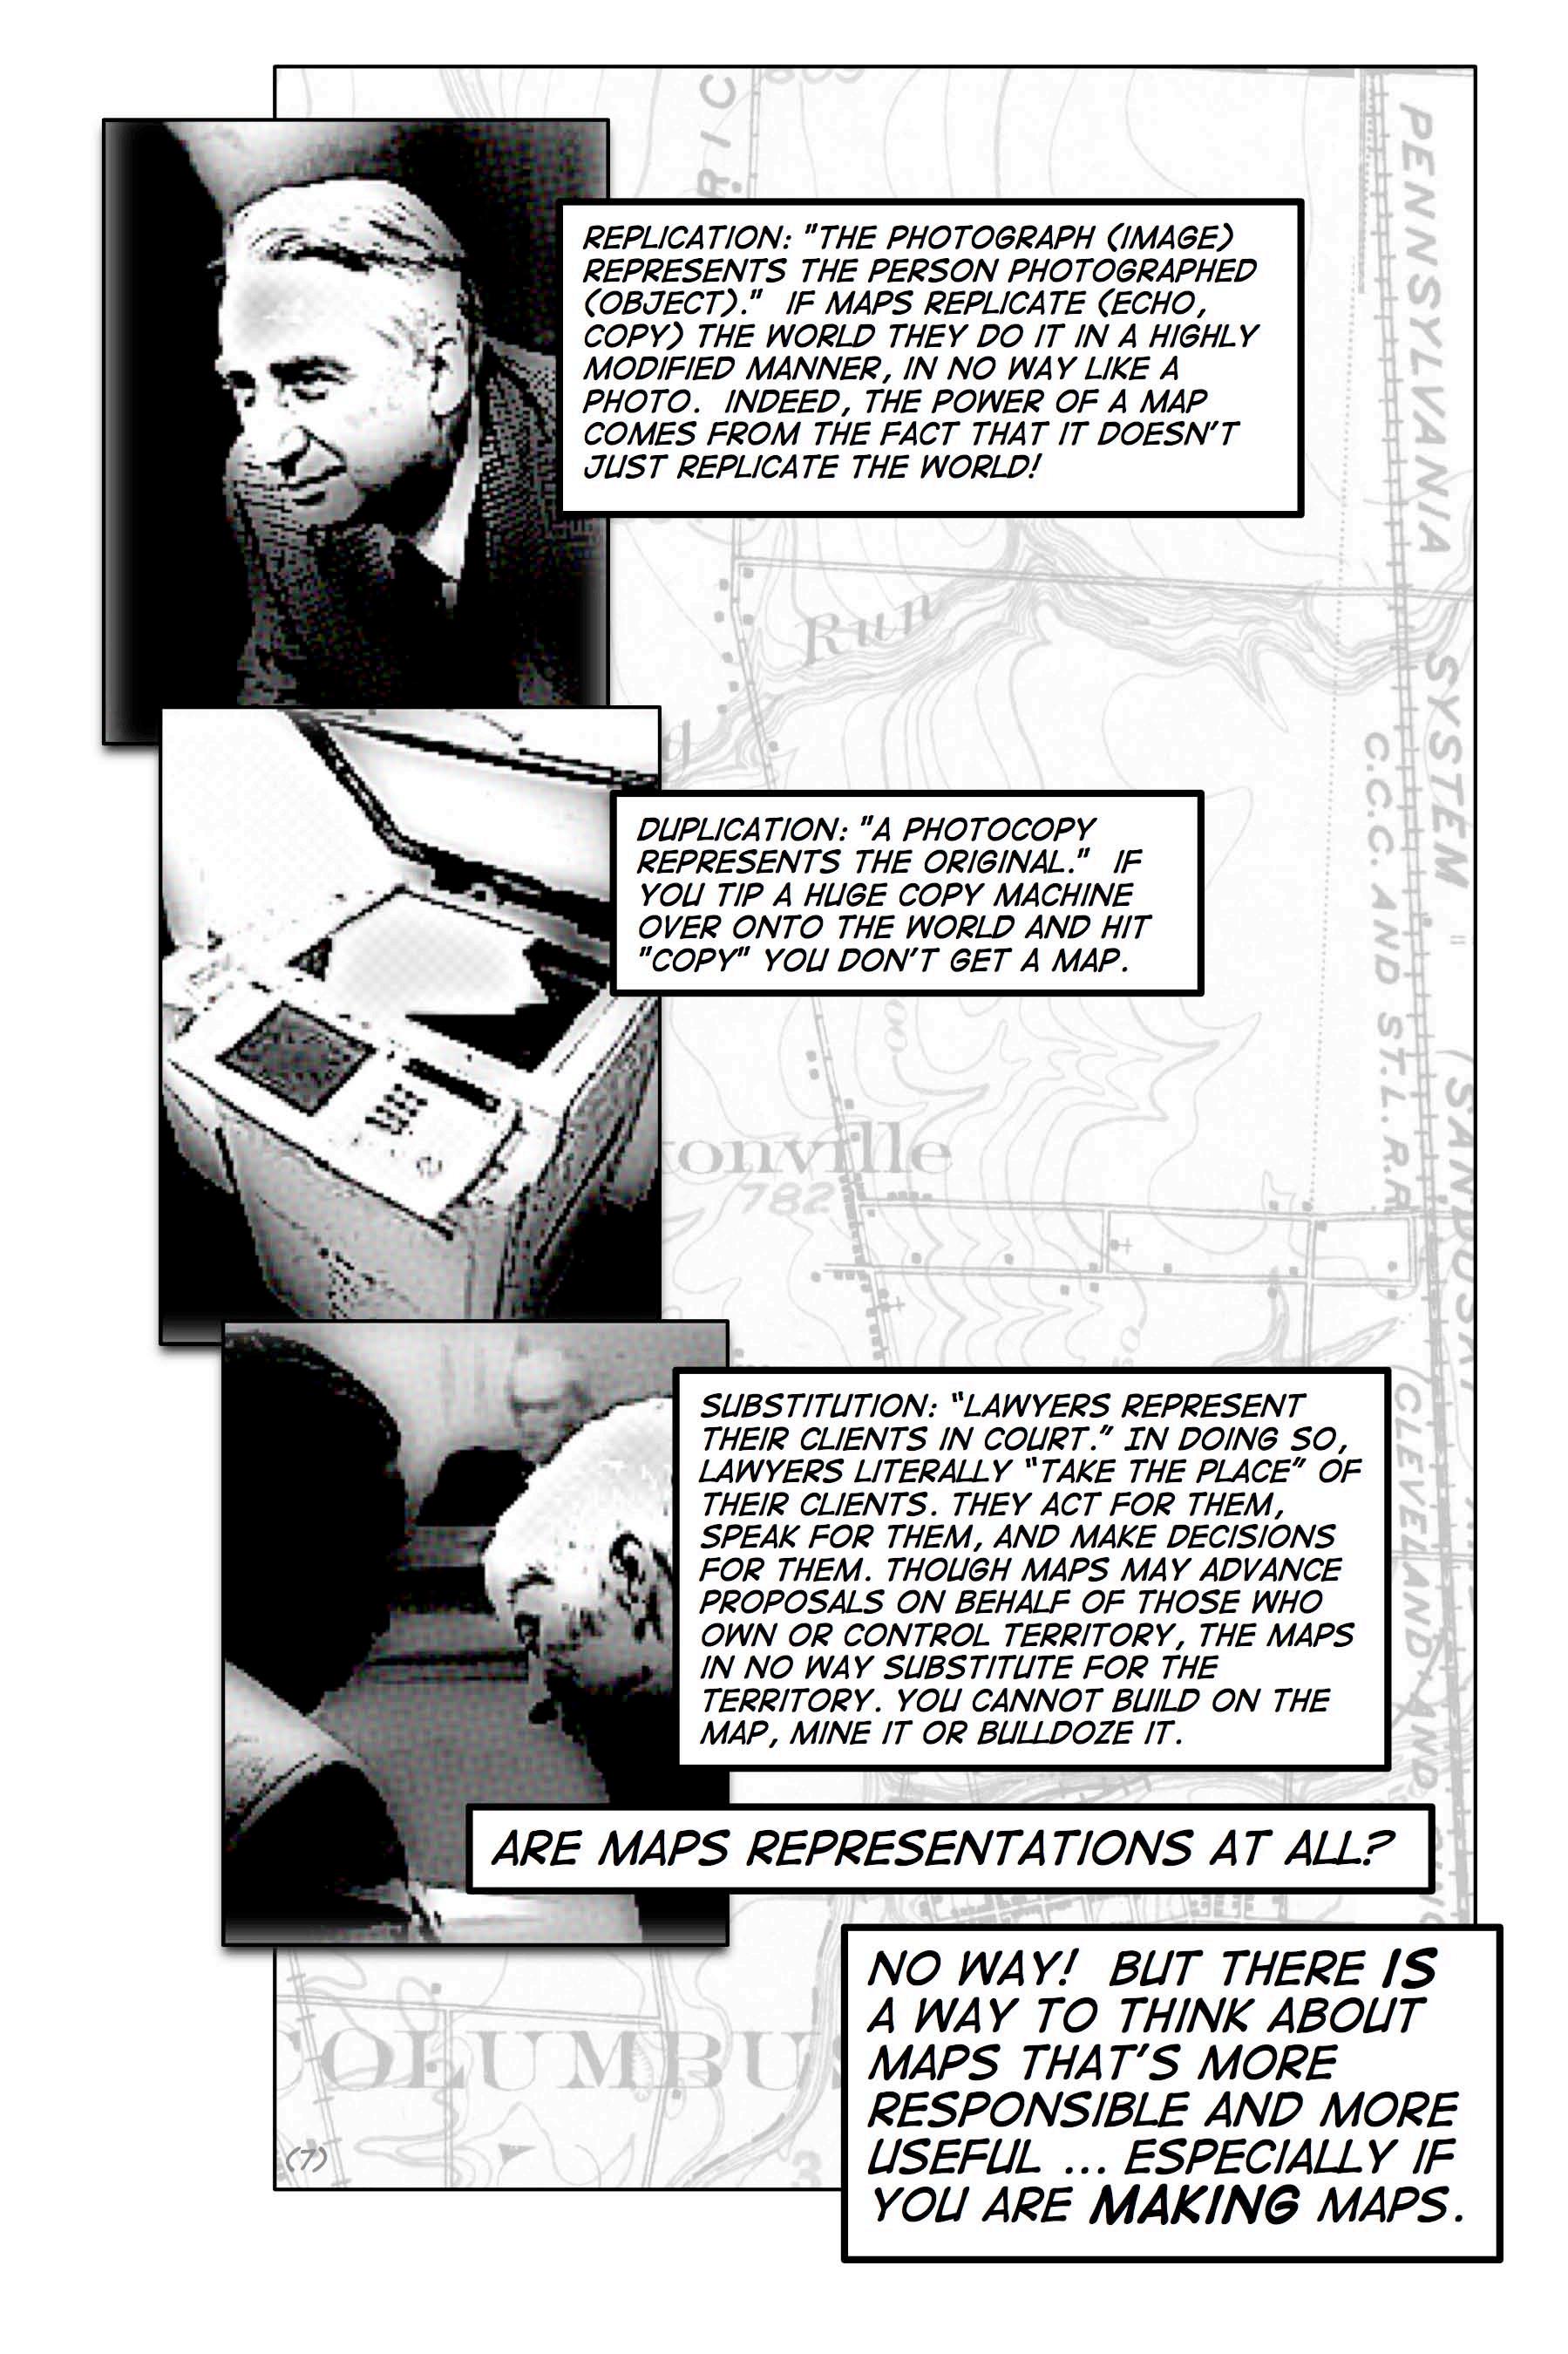
[7] The sixth chapter of Pauline Rosenau’s Post-Modernism and the Social Sciences: Insights, Inroads, and Intrusions presents her understanding of the post-modern attack on representation that she fears makes modern social science impossible (Princeton University Press, Princeton, 1992). A defender of traditional notions of representation, Rosenau presents her arguments as a “balanced appraisal.” That her argument is fundamentally reactionary makes it the more pertinent for our purposes here, a succinct and encompassing survey of what people mean by representation. Our reactions to her suggestions draw on a range of sources including Richard Rorty’s Philosophy and the Mirror of Nature (Princeton University Press, Princeton, 1979); Nelson Goodman’s Ways of Worldmaking (Hackett, Indianapolis, 1978); Michel Foucault’s The Archaeology of Knowledge (Pantheon, New York, 1972), and Paul Feyerabend’s Against Method (New Left Books, London, 1975). We are also indebted to Andrew Pickering’s The Mangle of Practice: Time, Agency, and Science (University of Chicago Press, Chicago, 1995), and J. B. Harley’s The New Nature of Maps (Johns Hopkins University Press, Baltimore, 2001).
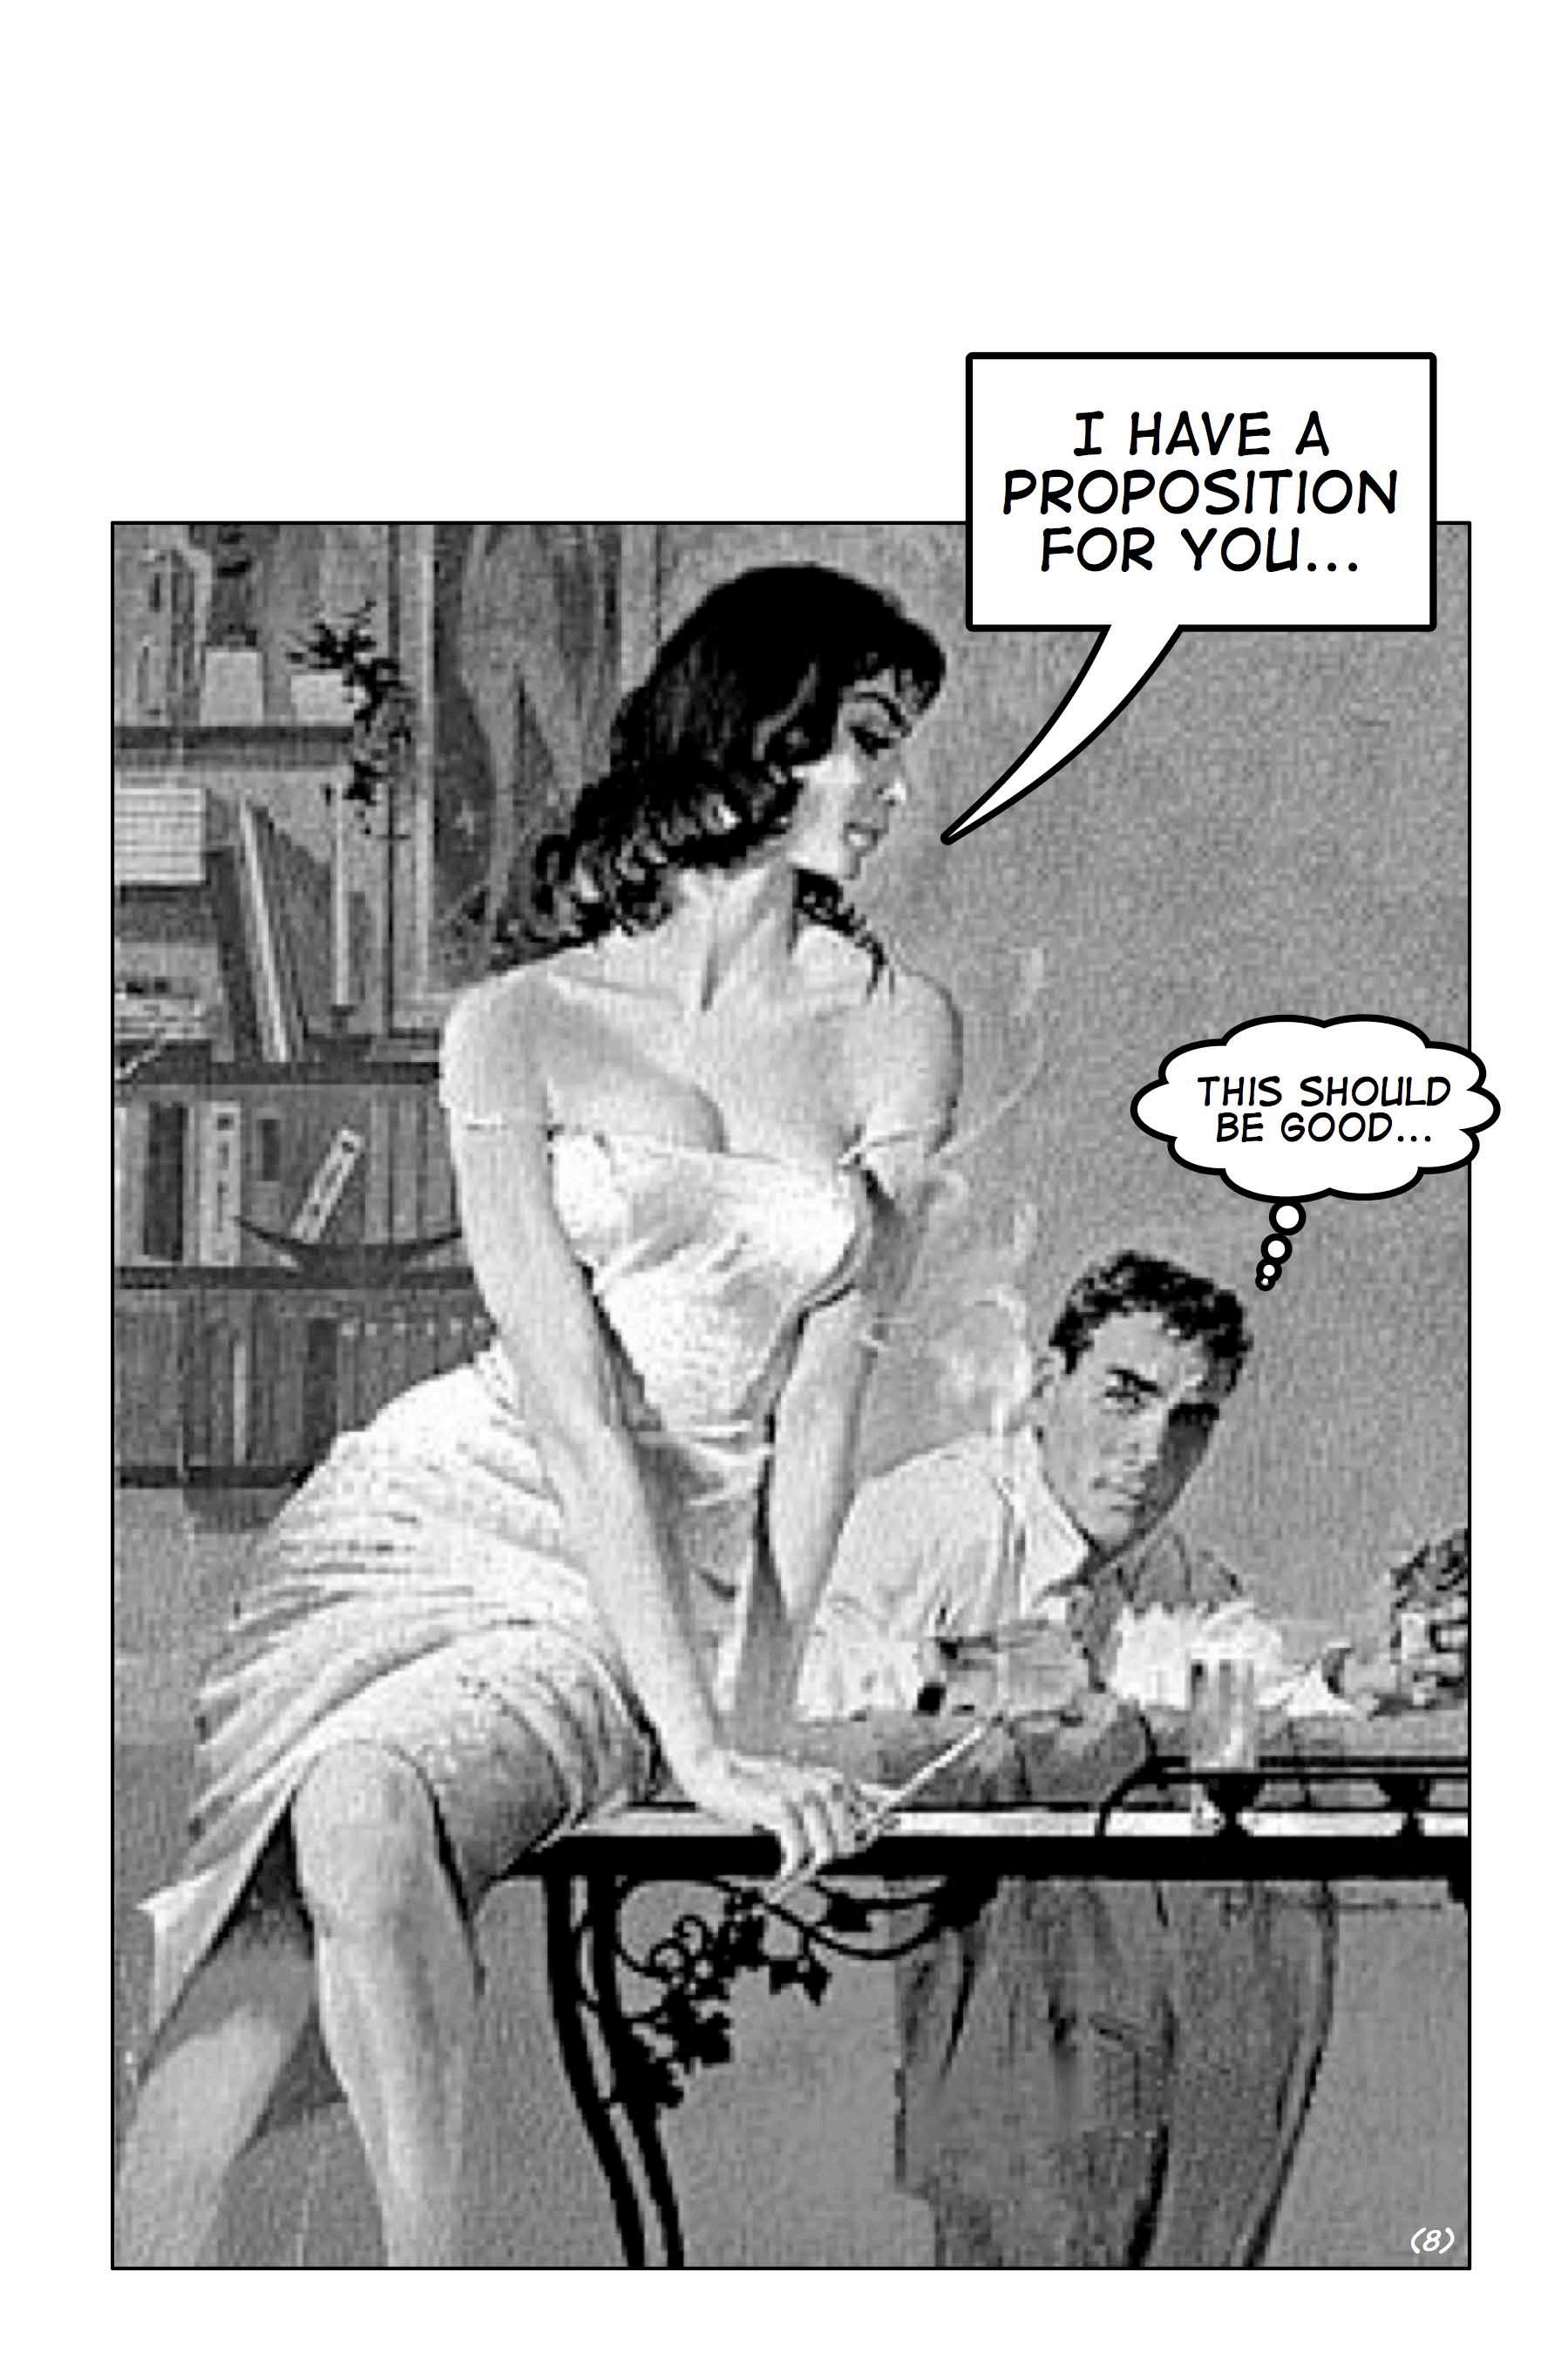
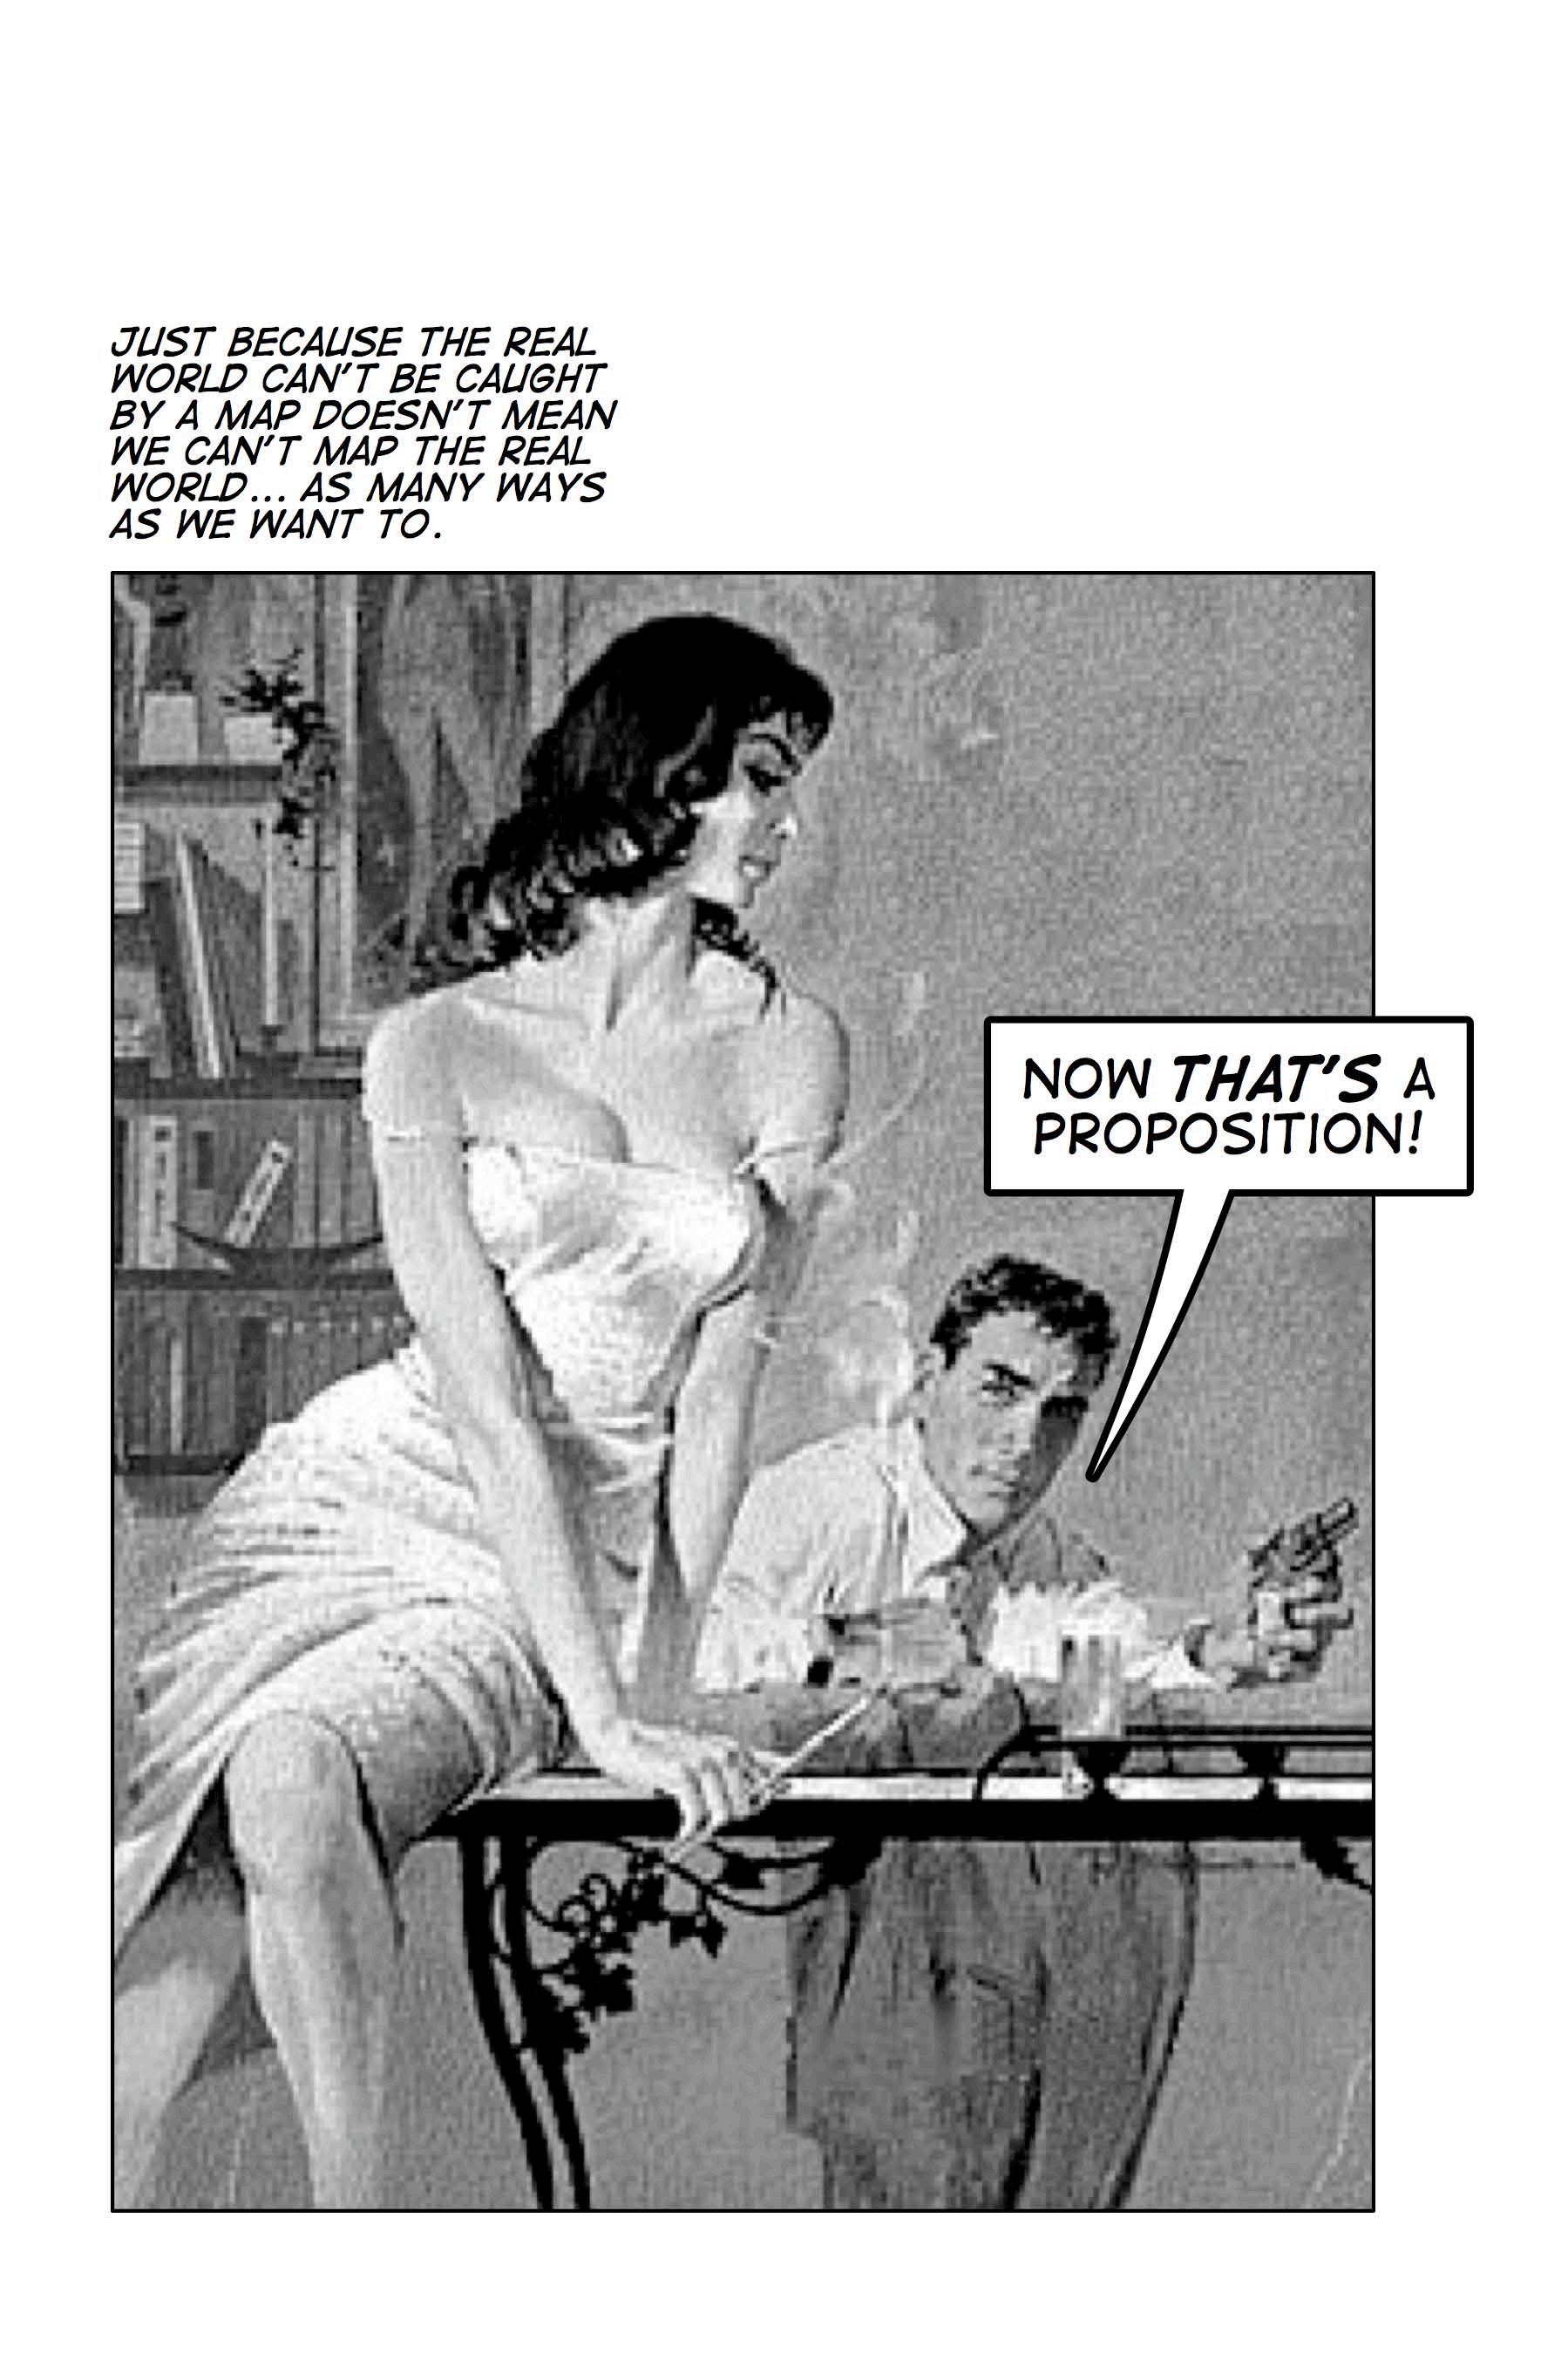
[8] Can an image of seduction suggest the seductive qualities of a map? Is a map that kind of proposition? Is it seductive? Seducing? Does the allure lie in the proposition? Or in the delusional desire for direct representation? Or both? Like “representation,” “image” too implies some sort of correspondence to and mirroring of “reality” but refers to the visual more broadly. David Freedberg’s The Power of Images: Studies in the History and Theory of Response, for example, deals with fine art, masks, photographs, illustrations, icons, sculpture, statuary, and so on (University of Chicago Press, Chicago, 1989). James Elkins’ The Domain of Images deals with fine art, pictographs, monograms, photographs, graphs, charts, indigenous paintings, schemata, money, seals, stamps, engineering drawings … and so on (Cornell University Press, Ithaca, 2001).
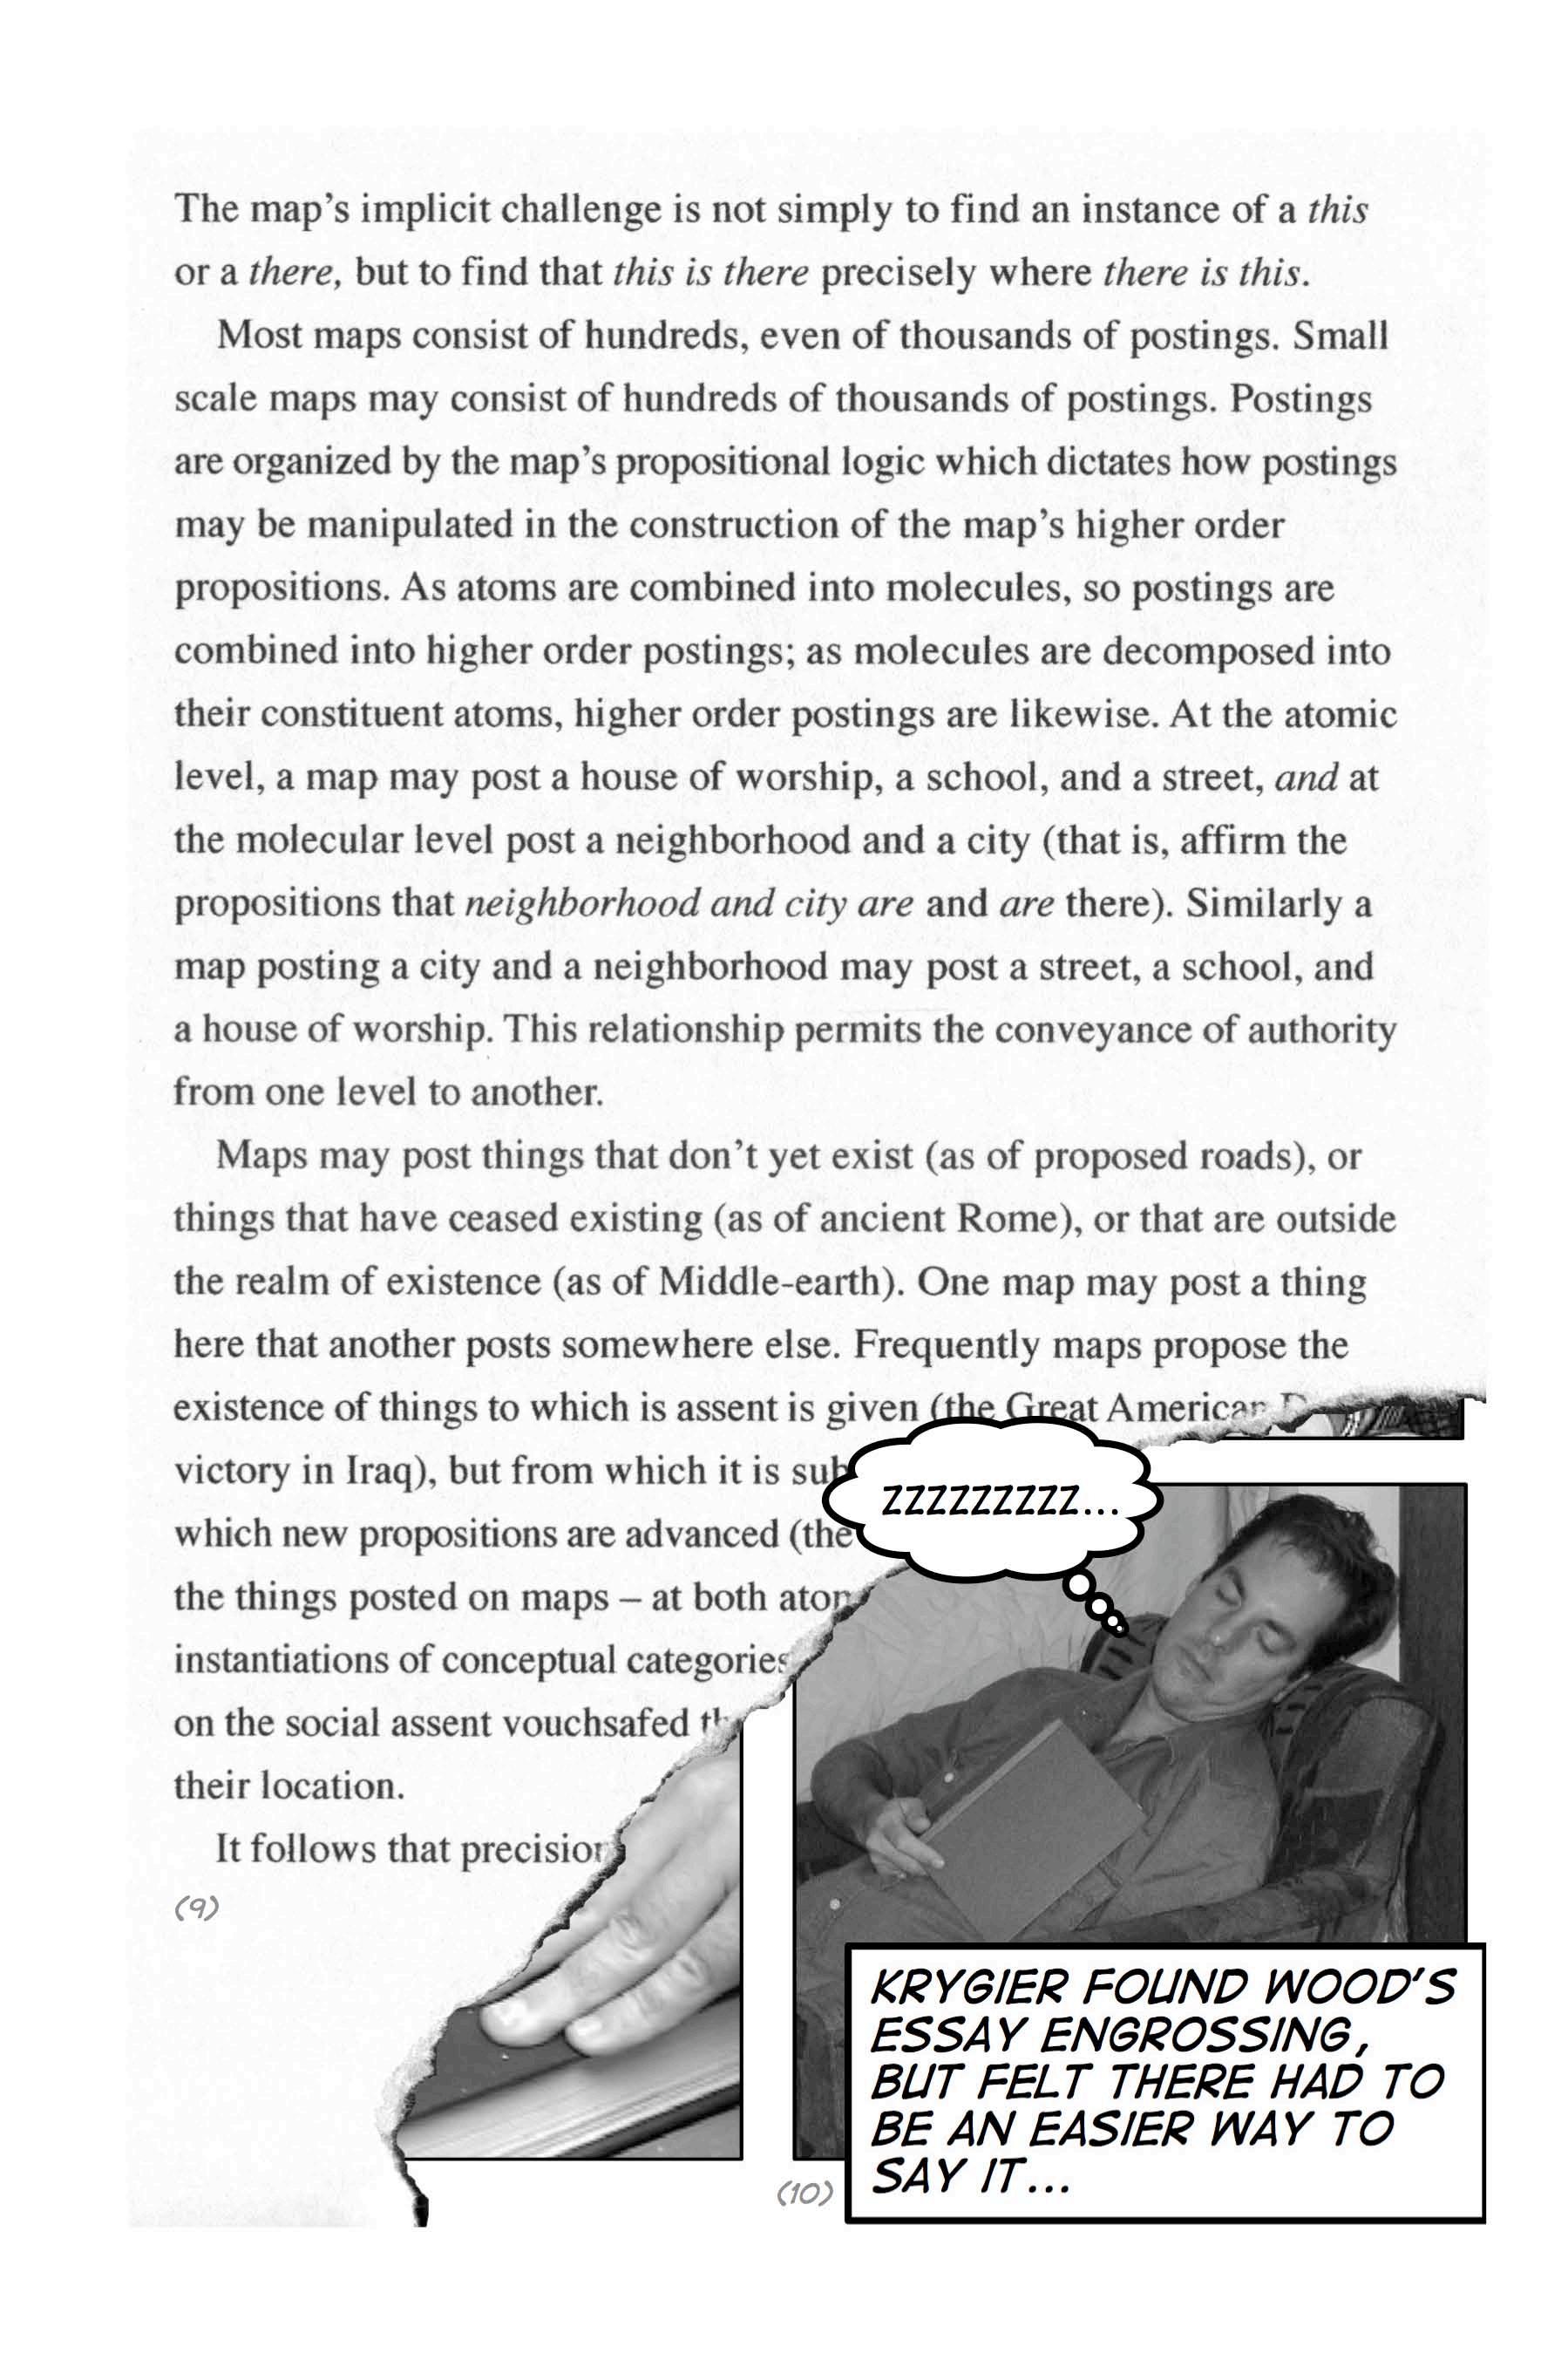
[9] The text on these two pages abstracts a collage of the following texts: Wood’s “Thinking About Maps as Talk Instead of Pictures,” presented at the annual meetings of the National Council on Geographic Education in Philadelphia in 2002; Wood’s “Thinking About Maps as Propositions Instead of Pictures,” presented at the annual meeting of the North American Cartographic Information Society in Jacksonville, Florida, in 2003; and the text, “Are Maps TALK Instead of Pictures?” that Wood wrote for his, Ward Kaiser’s and Bob Abramms’ Seeing Through Maps: Many Ways to See the World (ODT, Amherst, 2006, pp. 107-117). All draw on the work Wood had been doing since 2000 with John Fels on the propositional logic of the map, crystallized in Wood and Fels, The Natures of Maps (University of Chicago Press, Chicago, 2008). We all – Wood, Fels, and Krygier – recognize that the propositional logic of the map must be graphic, and Wood and Fels develop their “spatial/meaning calculus” graphically.
[10] Visual rhetoric and comics studies seriously engage the visual in a manner appropriate to our thinking about maps as propositions (see Carolyn Handa, Visual Rhetoric in a Digital World, Bedford/St. Martins, Boston, 2004). Visual rhetoricians ask questions like how and why we argue visually, how we understand the myriad visual arguments aimed at us, and how we ourselves can become better at visual arguments (also see Andrea Lunsford and John Ruszkiewicz, Everything Is an Argument, 4th ed., Bedford/St. Martins, Boston, 2006, especially the chapter on visual arguments). Visual rhetoric also makes strong links to semiotics and related approaches to understanding and interpreting diverse visual materials, art, advertising, movies, comic books, photographs, graphs, house plans, and maps (see Charles Hill and Marguerite Helmers, Defining Visual Rhetorics, Lawrence Erlbaum, Mahwah NJ, 2004). The idea of visual expressions as arguments, indeed as propositions, runs throughout the visual rhetoric literature. Comics studies are newer, but already an interdisciplinary field with conferences, journals (The Comics Journal, International Journal of Comic Art, Image & Narrative, and ImageTexT, the latter two online), academic centers (for example, at Michigan State, Ohio State, and Bowling Green State Universities), and reflective texts (in an already enormous literature numerous Barker’s Comics: Ideology, Power, and the Critics (1989), Inge’s Comics as Culture (1990), Gordon’s Comic Strips and Consumer Culture (1998), Diereck and Lefevre’s Forging a New Medium (1998), Carrier’s The Aesthetics of Comics (1999), Pustz’s Comic Book Culture (1999), Carrier’s The Aesthetics of Comics (1999), Varnum and Gibbons The Language of Comics (2001), Wright’s Comic Book Nation (2001),
Heer and Worcester’s Arguing Comics (2005). Academic acceptance of comics studies was in large part spurred on (and exemplified) by Scott McCloud’s Understanding Comics (op. cit.), a comic book about comics as academically sound as it is approachable. McCloud’s work in comic book form (including his subsequent Reinventing Comics [Paradox Press, New York, 2000], and Making Comics [Harper, New York, 2006]), established the fact that the comic form can work as intellectual discourse, a visual intellectual discourse. A case for geographers engaging comic books, at least at an interpretive level, has been made by Jason Dittmer who situates research on comic books as part of a broader interest in the visual components of popular culture (“The Tyranny of the Serial: Popular Geopolitics, the Nation, and Comic Book Discourse,” Antipode 39(2), 2007, pp. 247-268; but also see his “Captain America’s Empire: Reflections on Identity, Popular Culture, and Post-9/11 Geopolitics,” Annals of the Association of American Geographers 95(3), 2005, pp. 626-643). Our proposition about the comic as an appropriate form of academic discourse (like textual articles, or verbal presentations) raises many questions. What is wrong with the visual that makes it so inappropriate as formal academic discourse? Why do scholars who study the visual (maps) express themselves primarily with text/words? Could a comic, a map, or any other largely non-textual expression be considered appropriate as academic discourse (without the need to use notes, like these, to explain everything with words?)
[11] Like the traffic map, the pumpkin map is from Wood’s unpublished Dancing and Singing: A Narrative Atlas of Boylan Heights, although this particular map has been previously published, where the argument it advances is made explicit in a comparison with a map of some of the contents of the Boylan Heights neighborhood newsletter. See Katherine Harmon’s You Are Here: Personal Geographies and Other Maps of the Imagination (Princeton Architectural Press, New York, 2004, pp. 104-107). You can also hear Wood make the argument in a radio interview with Ira Glass on Glass’ This American Life (archived at www.thislife.org , selected maps from the Boylan Heights atlas can be found at the Making Maps blog: makingmaps.net)
[12] Each map proposes a different Boylan Heights, which is precisely why the atlas Wood has been working on will contain over a hundred maps of the neighborhood, though it would take thousands more to really begin to close in on something that, in the end, can never be caught.
[13] Each map proposes a different “Kashmir.” Maps of disputed territories are very easy to accept as propositional maps, because “everyone” acknowledges that boundaries and territory are human constructs.
[14] Each map proposes a different region of caribou calving in the Arctic National Wildlife Refuge. A rogue U.S. Government employee placed maps of alleged caribou calving areas in the Refuge on his web site. The official U.S. Government position was that caribou calving in the Refuge is not well understood, and should not be publicized. It also denied that the employee who created the maps was an expert on caribou calving. There is thus no “official” U.S. map of caribou calving in the Refuge.
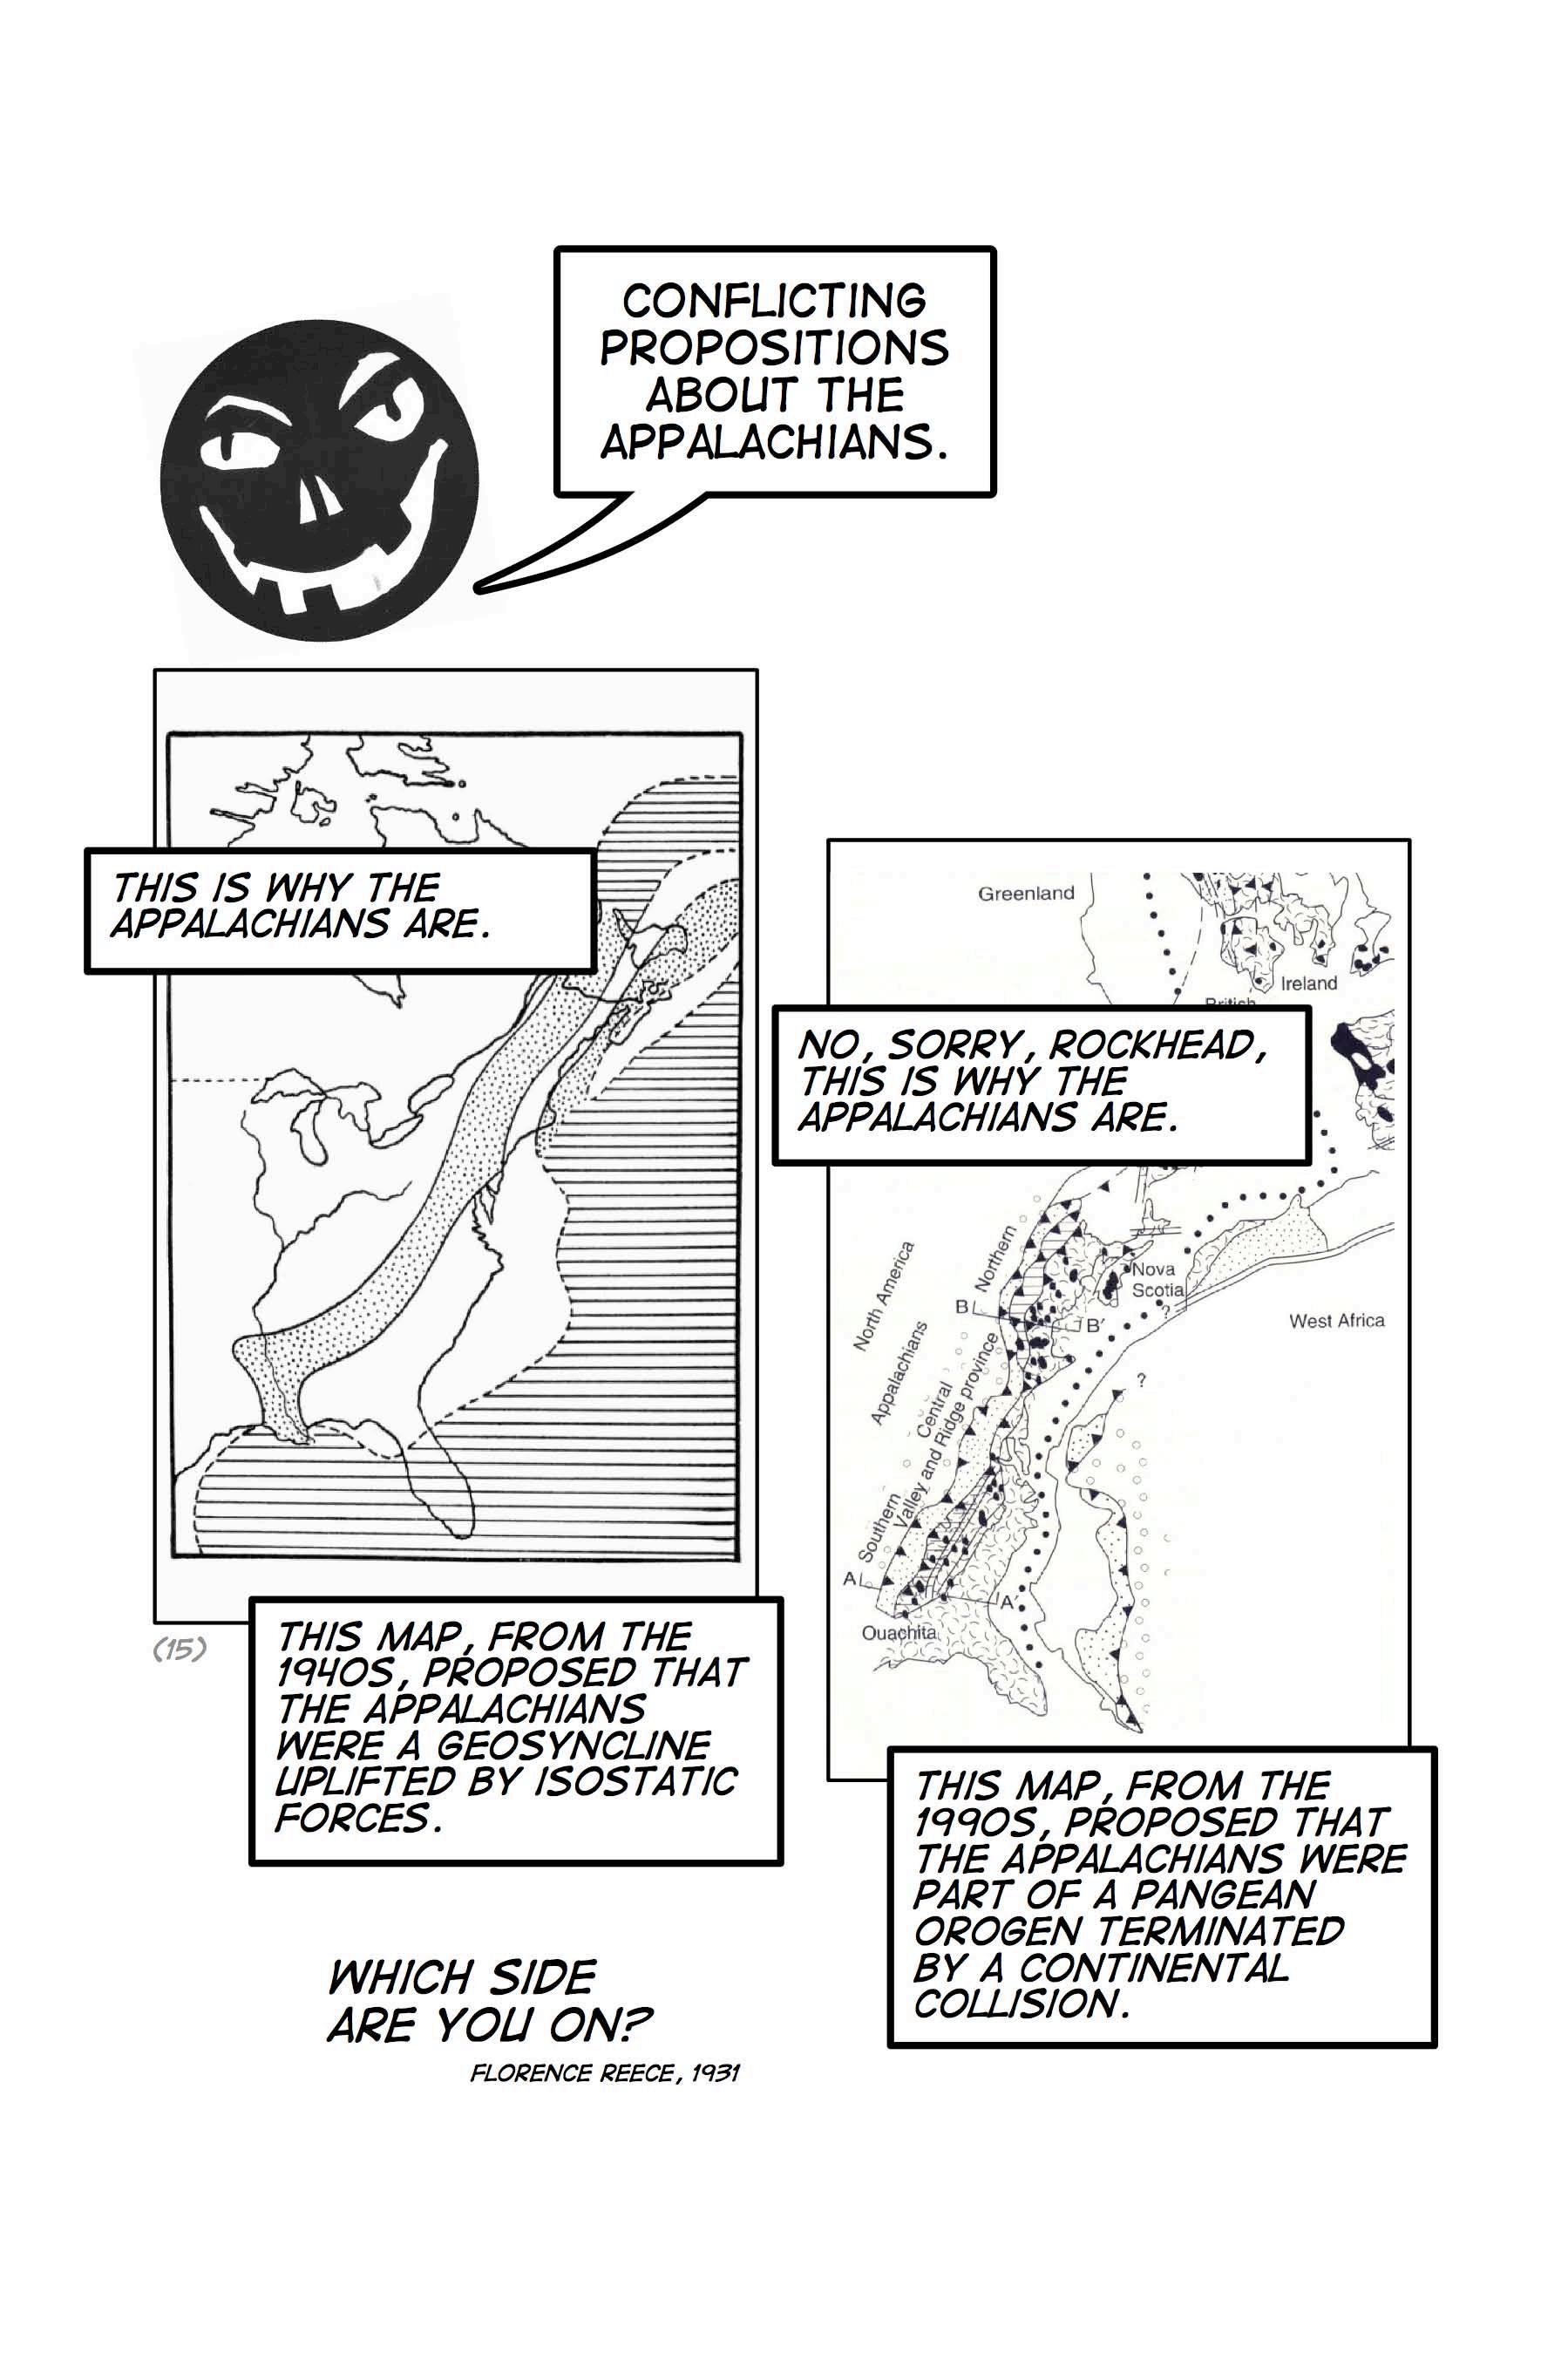
[15] One of the reasons it’s important to show these maps is because “hard science” is so often the redoubt of choice for those defending the representational character of maps. “Sure,” they say, “that may be true of national boundaries or in political squabbles, but those aren’t scientific maps.” But “scientific” maps are not a whit less propositional. When Wood took geology in college isostatic rebound was the argument advanced for the uplift of mountains. A generation later this notion makes people smile indulgently, as at the foibles of a toddler. If you line maps up chronologically, you see continuous change in the way humans think about things. It’s plain to us how … wrong our ancestors were, and how completely speculative, hypothetical, propositional their thinking was. Why do we imagine we’re any different, imagine that we finally know how the world really is, when all those before us have been so misguided? The map of the geosyncline is from O. D. von Engeln’s Geomorphology: Systematic and Regional, where it is added in the caption that: “The inferred extension seaward of the ancient land mass, Appalachia, is indicated by a dashed line” (Macmillan, New York, 1949, p. 341). The map of the Pangean orogen is from Eldridge Moores and Robert Twiss, Tectonics, where the caption calls it a, “Map of Appalachian-Caledonian-West African mountain system” (Freeman, New York, 1995, p. 357).
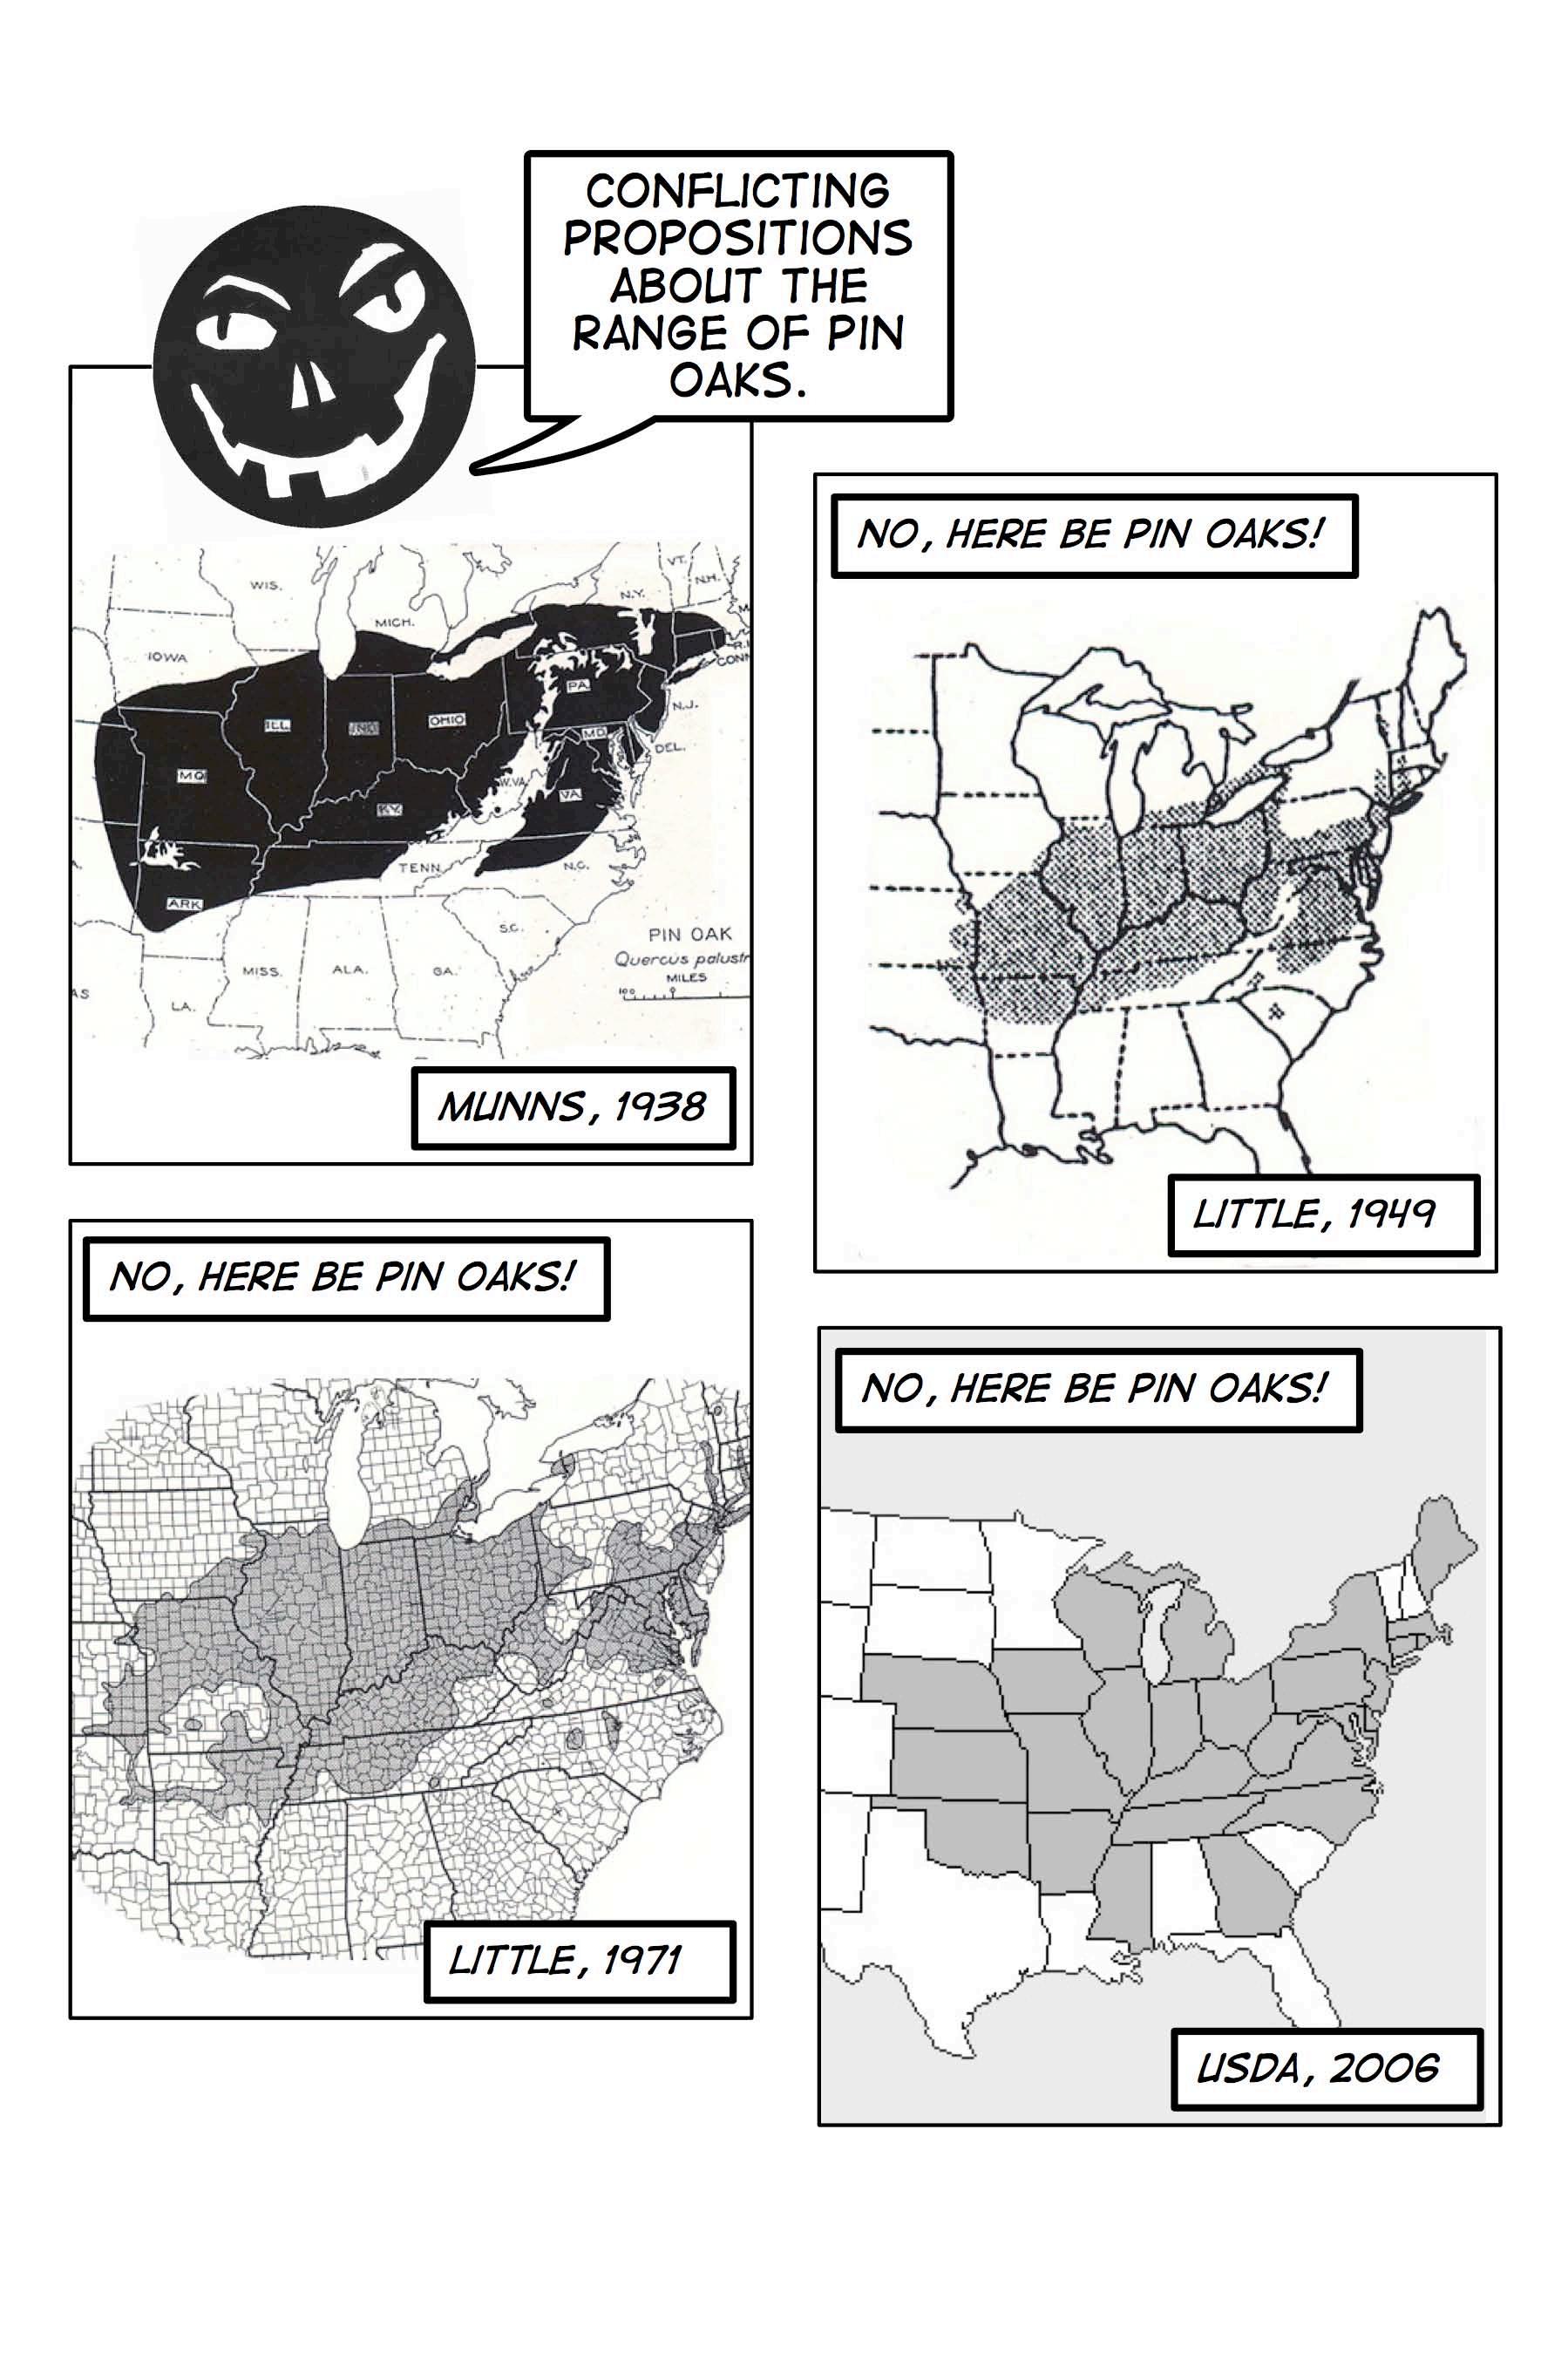
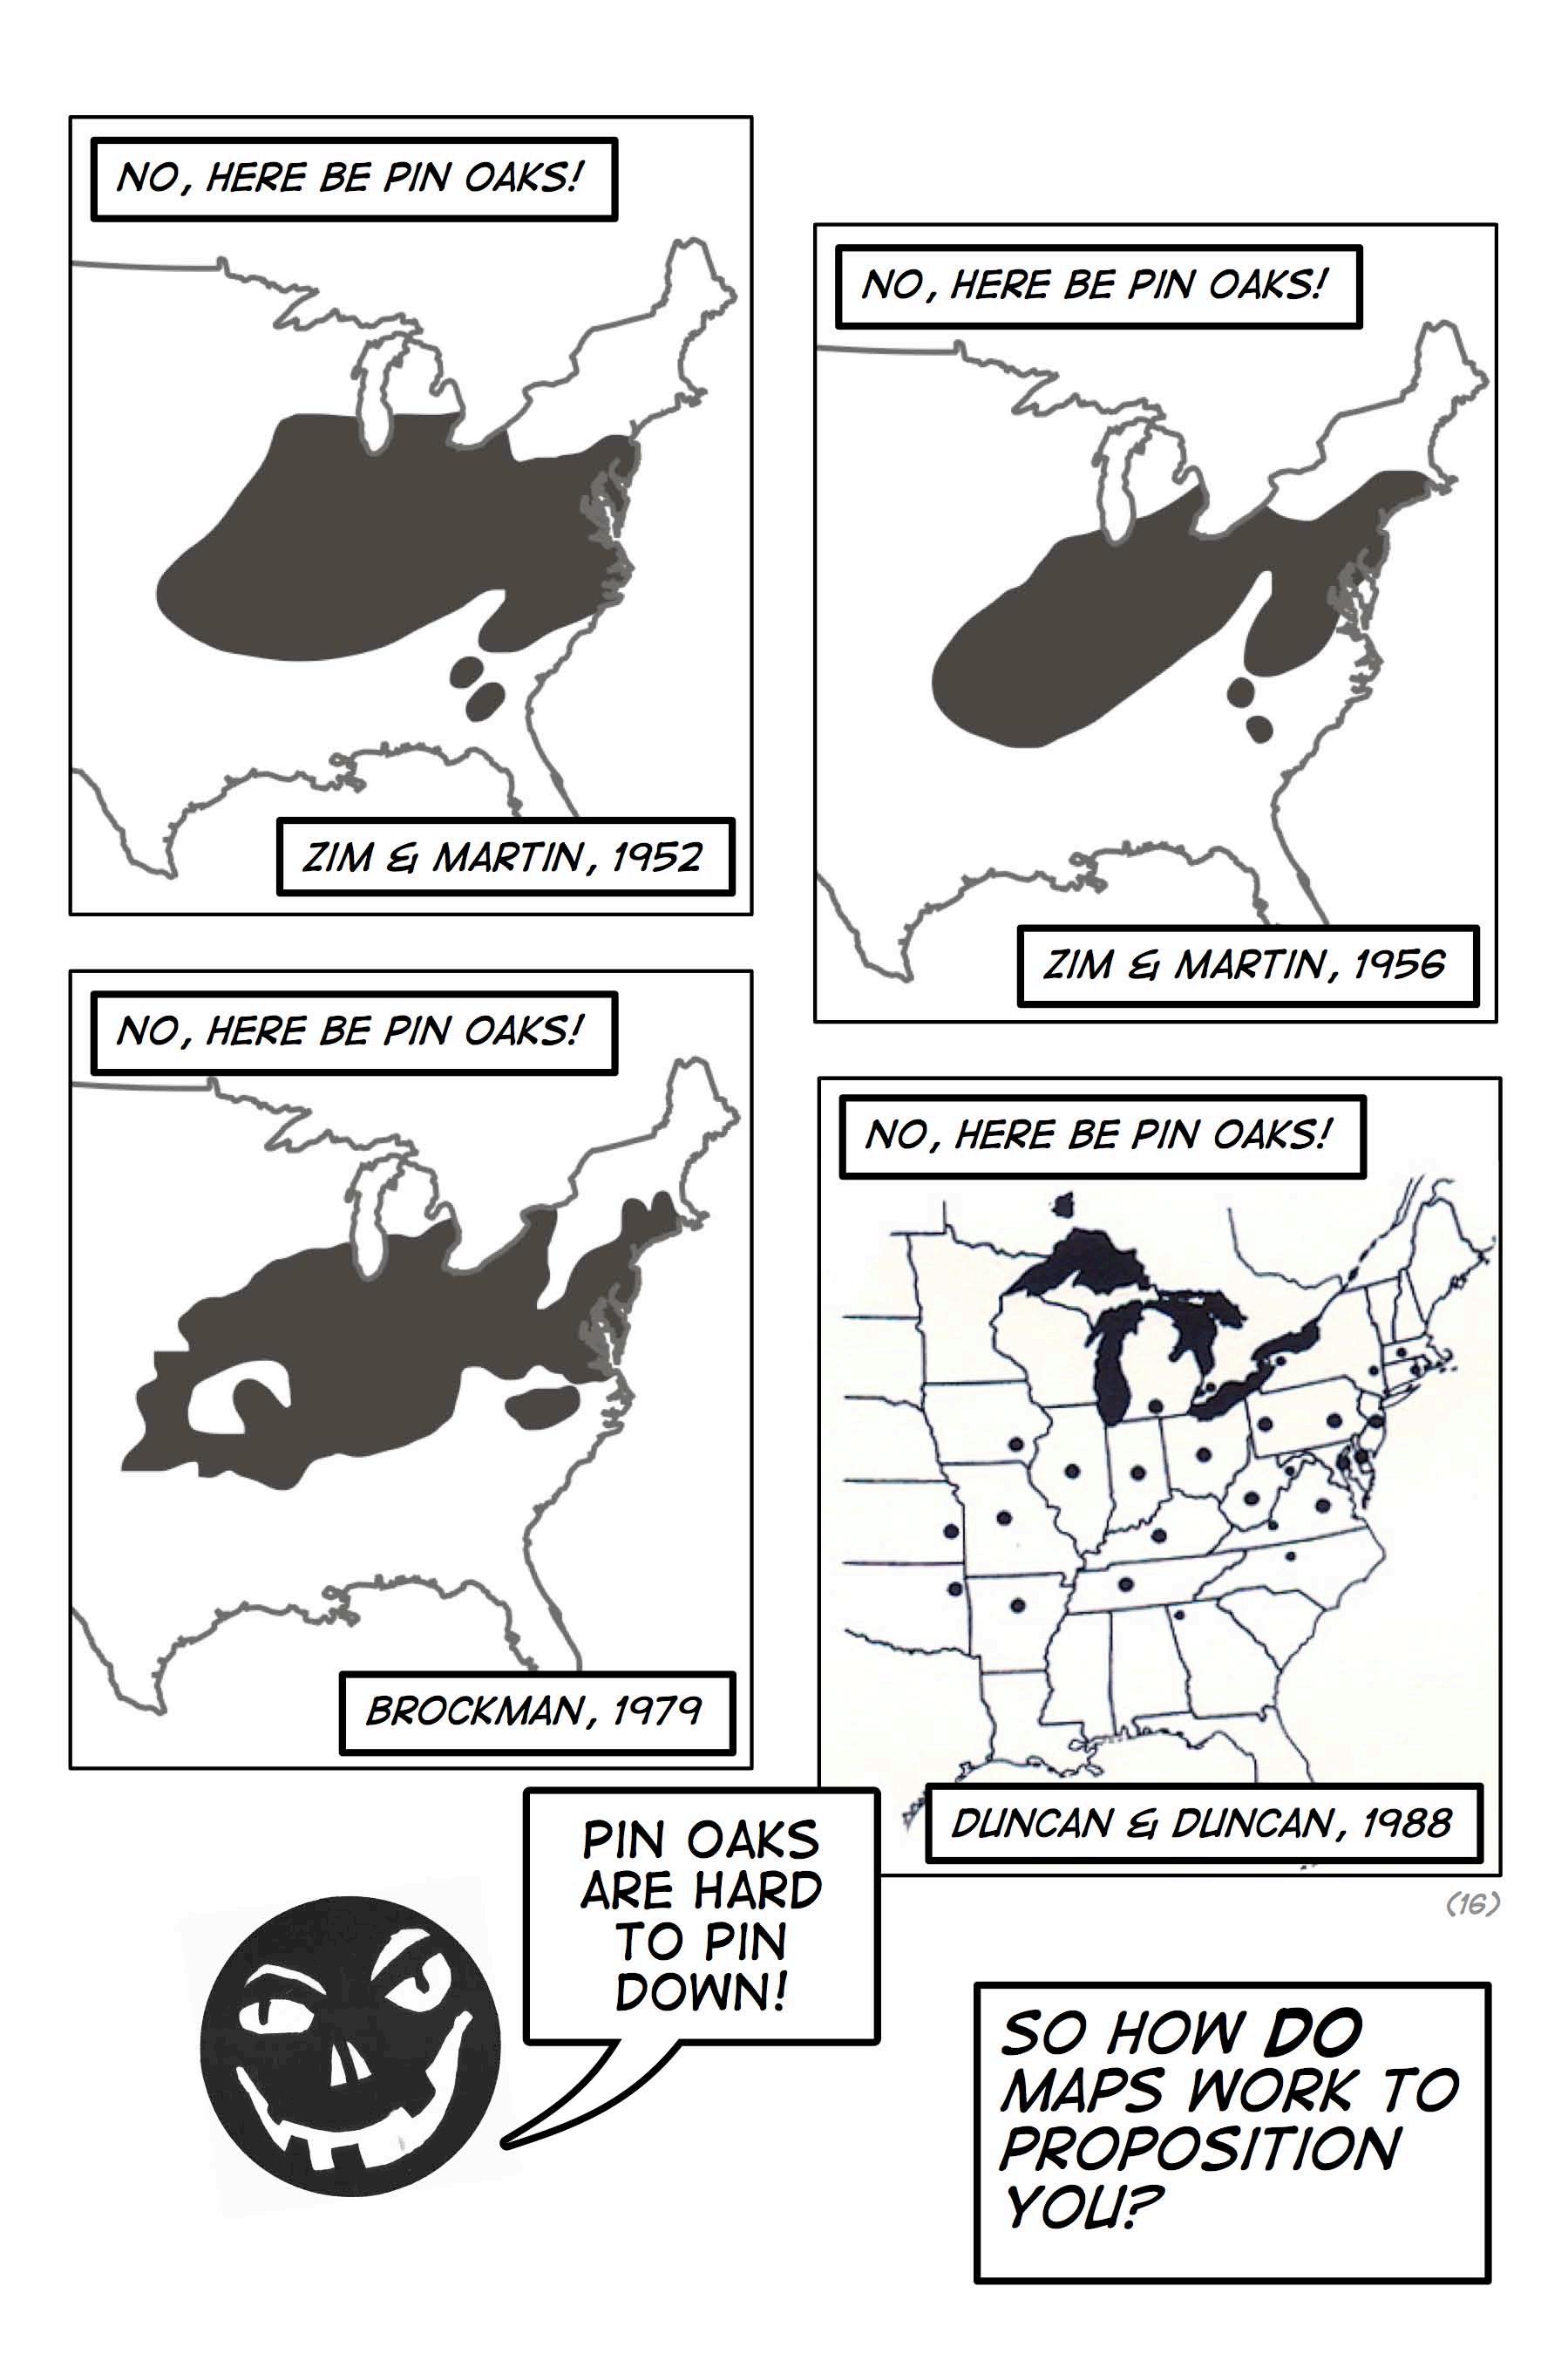
[16] Here eight propositions, from a multitude, about the range of the pin oak. See the exhaustive discussion of these range maps in Wood and Fels, op. cit., pp. 146-163.
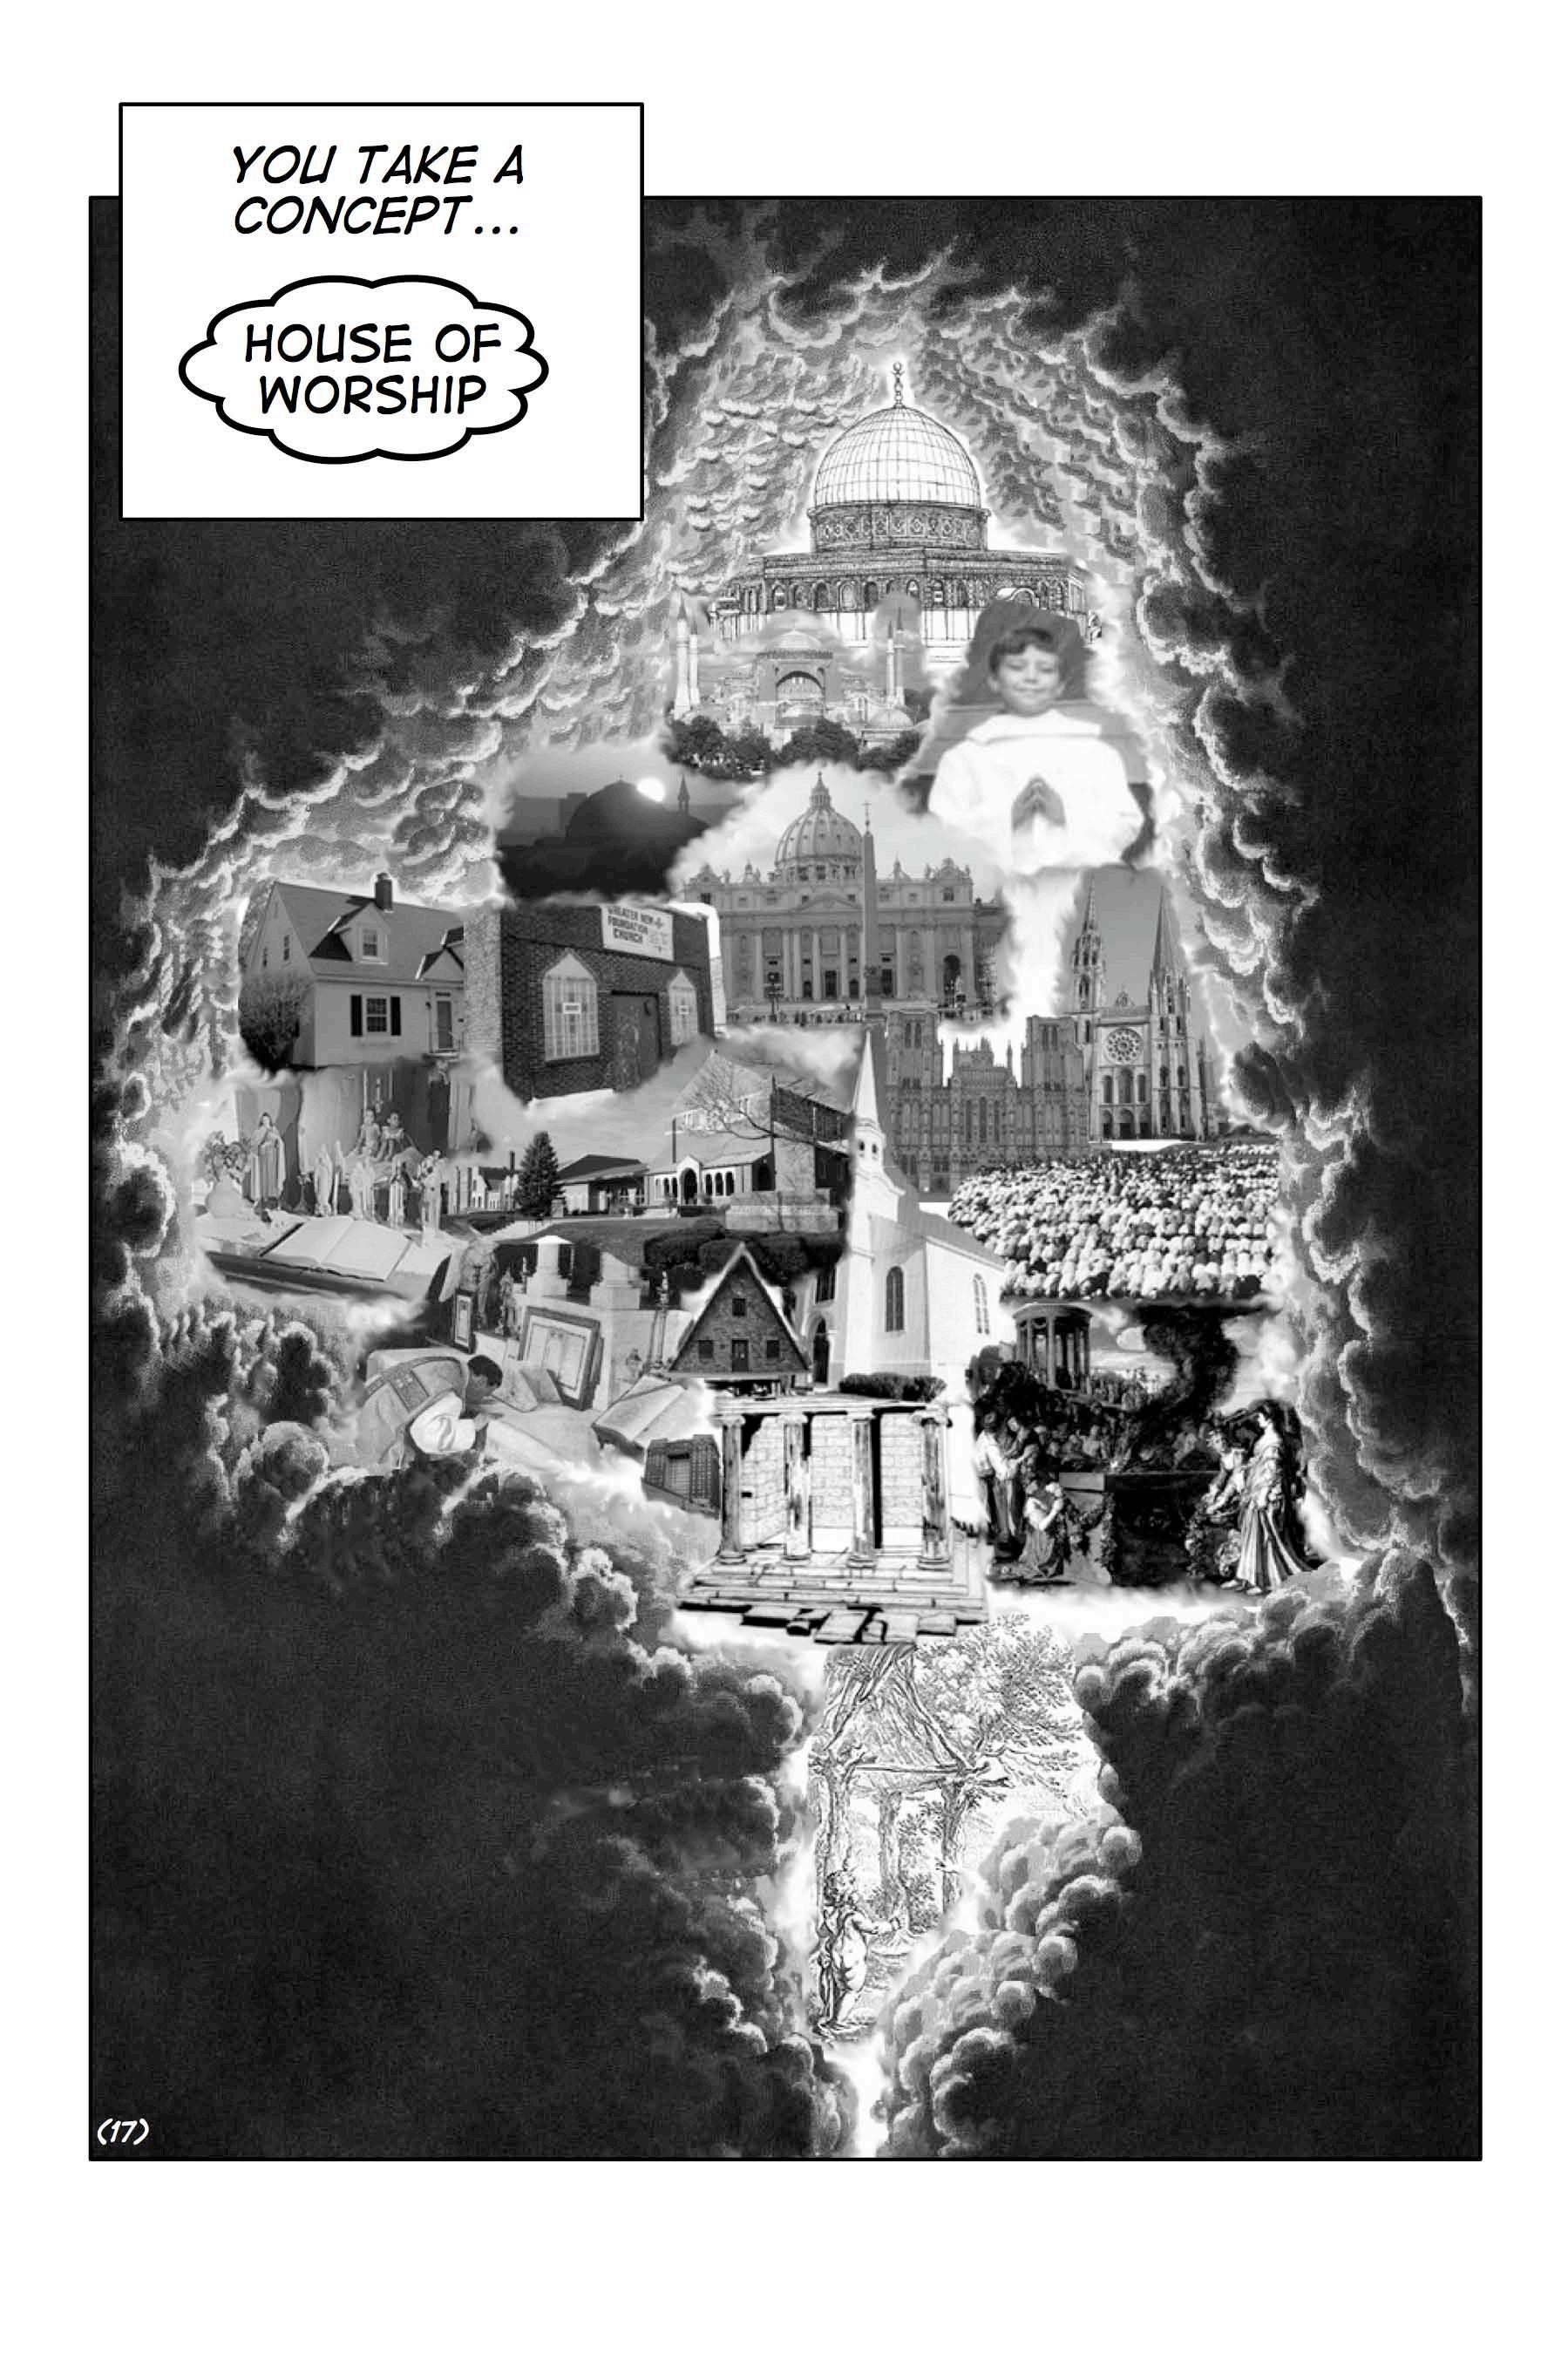
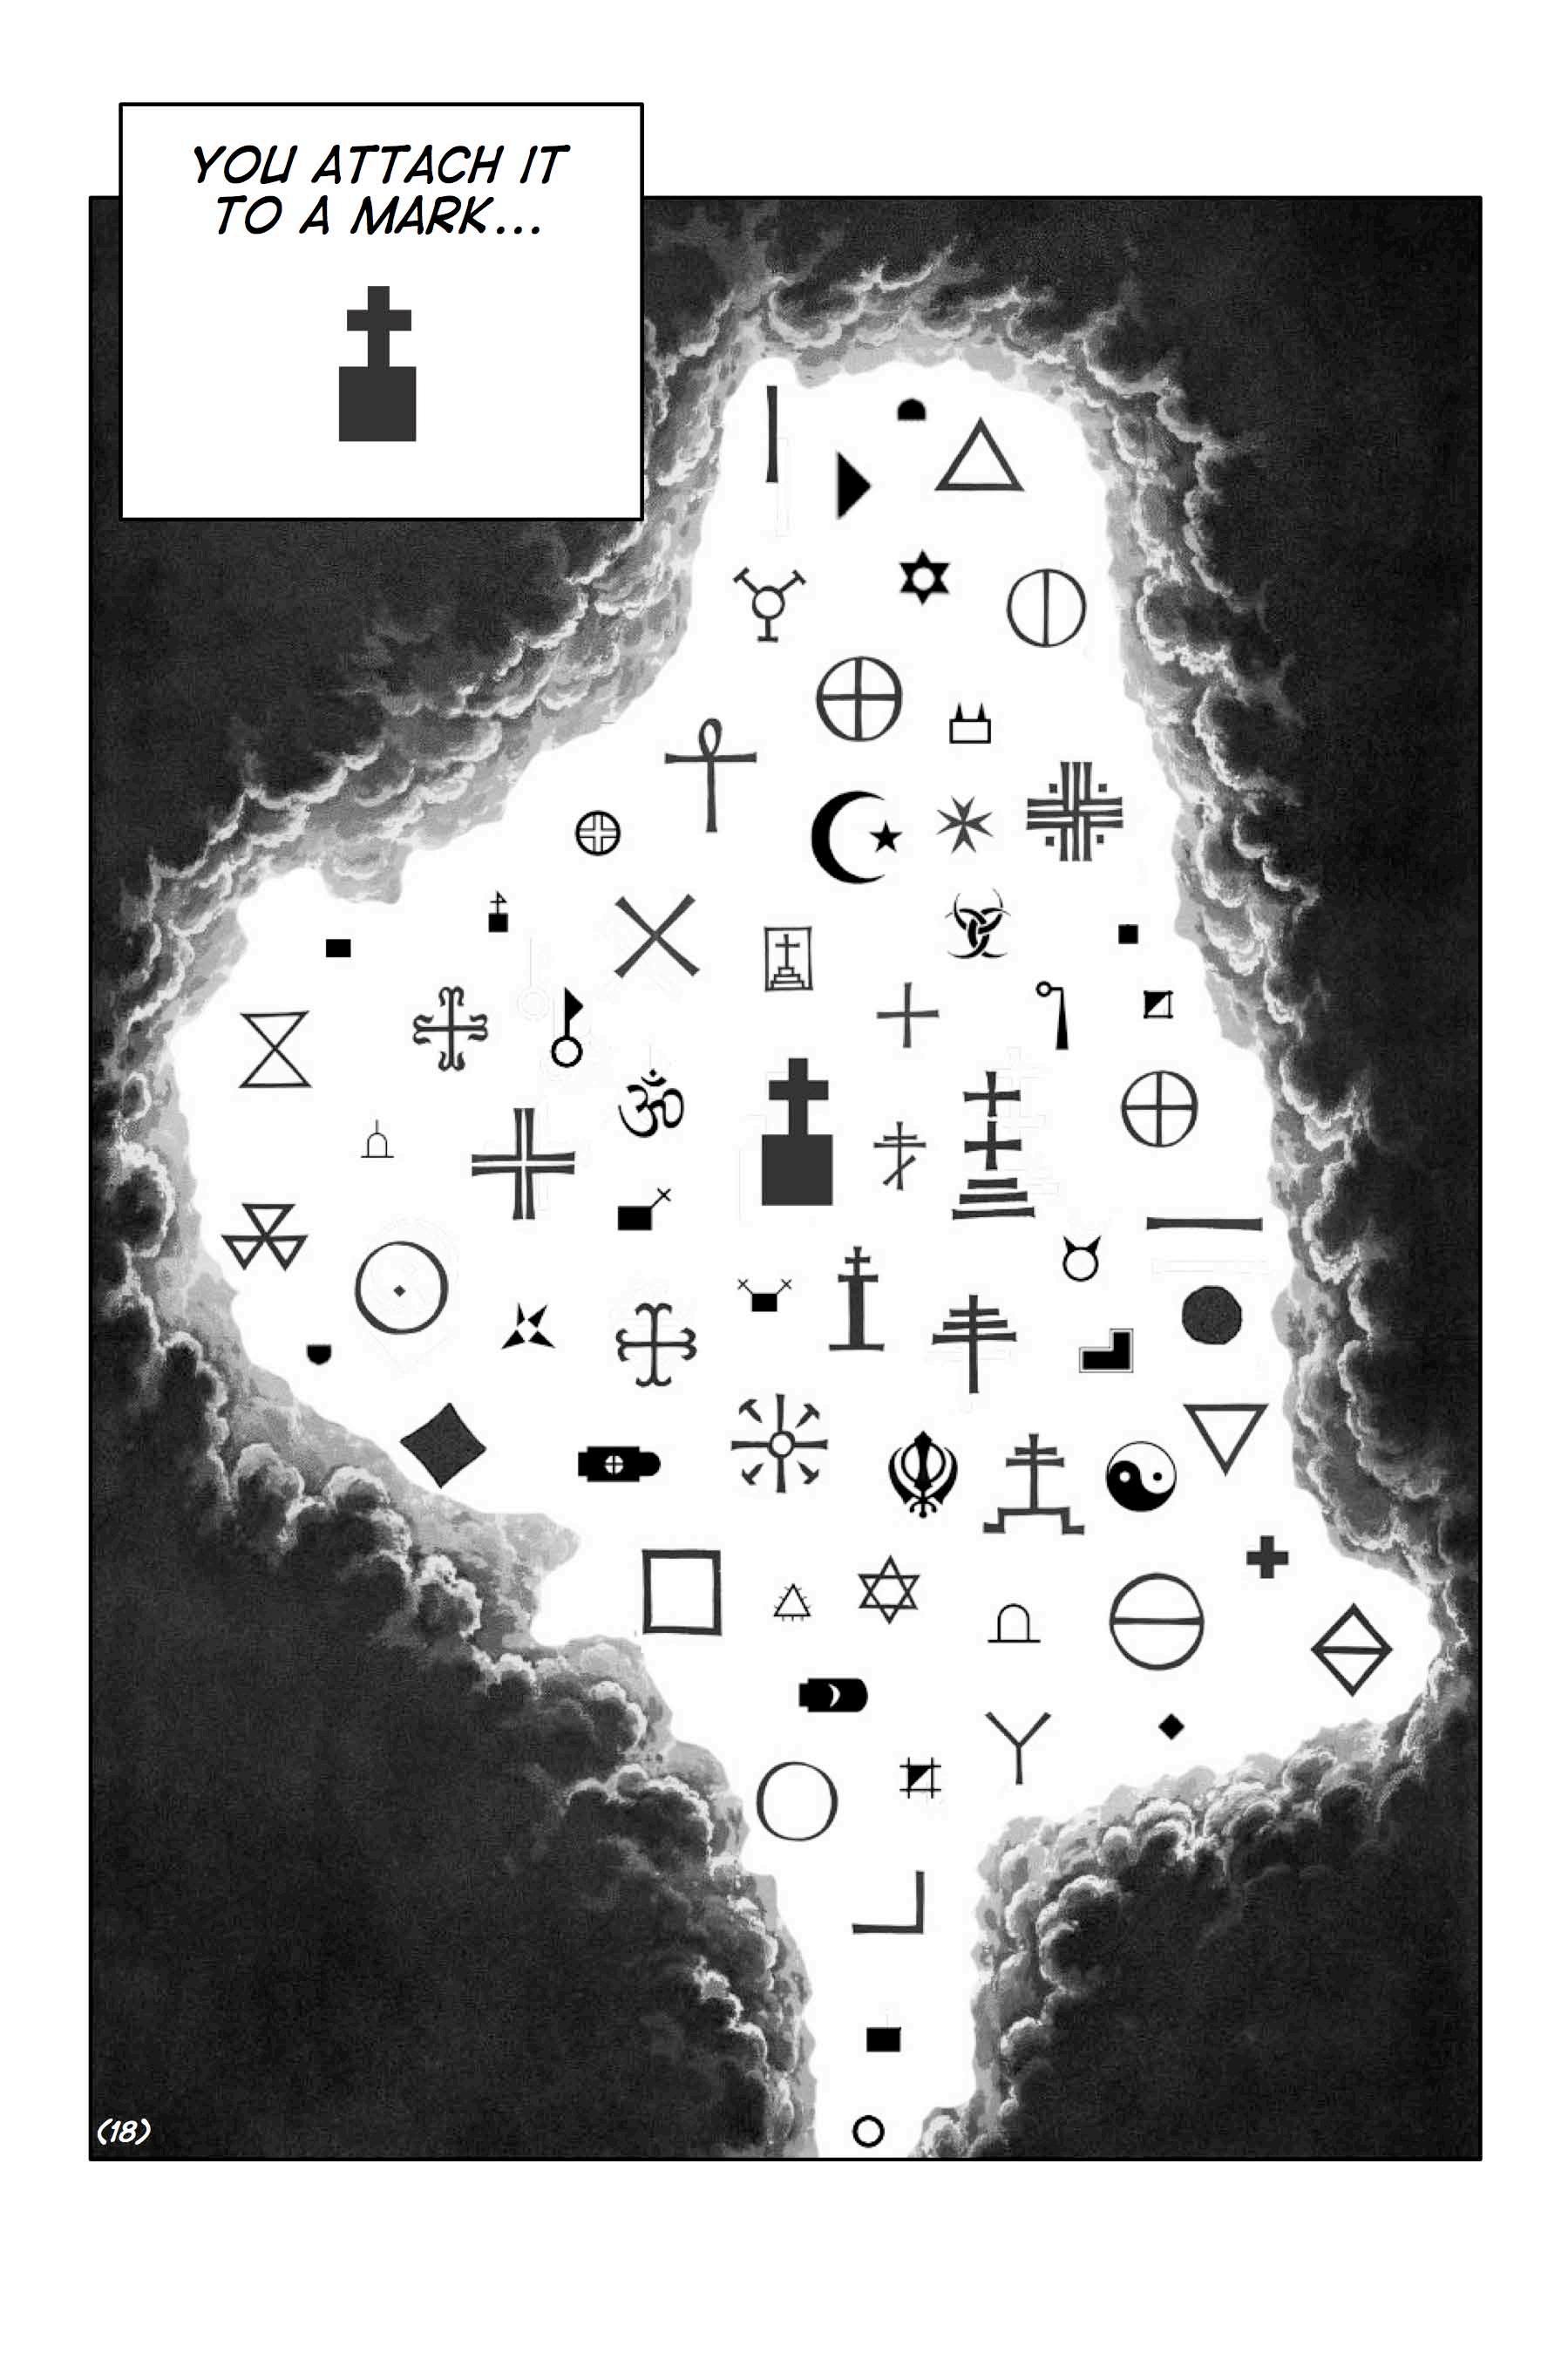
[17] Here we enter the realm of the sign since, after all, the posting is constituted of a sign on the cartographic sign plane. We follow de Saussure, Barthes, and Eco, among others, in taking a sign to be compounded of a signifier and a signified. This is Barthes’s definition of the linguistic sign and his definition of the semiological sign-function (from his Elements of Semiology Hill and Wang, New York, 1973 [1964], p. 39 and p. 41). Umberto Eco defines a sign as “an element of an expression plane conventionally correlated to one (or several) elements of a content plane,” though he insists, “Properly speaking there are not signs, but only sign-functions … realized when two functives (expression and content) enter into a mutual correlation” (A Theory of Semiotics, Indiana University Press, Bloomington, 1976, p. 48 and p. 49). Both derive their definitions directly from Ferdinand de Saussure’s Course in General Linguistics where Saussure says, “I call the combination of a concept and a sound-image a sign,” and later, “I propose to retain the word sign to designate the whole and to replace concept and sound-image respectively by signified and signifier” (Philosophical Library, New York, 1959 [1915], p. 67). The signified (concept, content, categorical type, or whatever we’re going to call it), resides in some sort of conceptual space, conceptual universe, content space, content plane, or semantic field. This is what we’re attempting to suggest here in this … evocation … of a semantic cloud. In order to evoke it, of course, we’ve had to marry the concepts (house of worship, worship, house) to … marks, and so in fact these are signs (in fact, actually, the pertinent expressive elements of signs), not concepts. We know this, but let’s pretend. (For an interesting, and occasionally hilarious, account of Saussure’s fate at the hands of Chomsky, Barthes, Derrida, et al., see Roy Harris’s Saussure and His Interpreters, New York University Press, New York, 2001, not that we buy into all of Harris’s complaints either.)
[18] Here we’ve attempted to evoke the plane of expression, the graphic potential, the field of marks, the domain of signifiers, or of visual-images (in describing the signifier as a “sound-image” Saussure revealed his focus on speech and language), more successfully we feel, since this realm is material to begin with.
[19] Presumably these signs lead to some kind of action. Why else make signs, why else advance propositions, unless to affect the behavior or state of another? Without this motivation it is hard to understand why people would make, publish, and disseminate maps. The sign theorist who made this point most straightforwardly was Colin Cherry who defined a sign as a “a transmission, or construct, by which one organism affects the behavior or state of another, in a communication situation” (On Human Communication, MIT, Cambridge, 1957, p. 306). Contrast his definition of a sign with those of de Saussure, Barthes, and Eco that we just gave. It’s as though they came from different worlds, which in a way they did. Although written in the 1950s his text is wholly Peircean in spirit, and indeed his definition of a sign is a generalization of Peirce’s, which Cherry distinguishes, “by the requirement that a sign must be capable of evoking responses which themselves must be capable of acting as signs for the same (object) designatum” (p. 220). Peirce’s sign formed an essential part of his idea of logic – his approach was philosophical not linguistic like de Saussure’s – and a sign, he said, was “something which stands to somebody for something in some respect or capacity” (Charles Hartshorne and Paul Weiss, eds., Collected Papers of Charles S. Peirce, Harvard, Cambridge, 193135, Vol. 2, paragraph 228, but see also 227, 231, 303, and 418). Peirce distinguished three triadic semiotic relations of significance, of which the second trichotomy of the sign consisted of his famous icon, index, and symbol (which we referred to earlier), ad infinitum (almost literally, since Peirce identifies sixty-six classes of signs). No matter how deep we dive we won’t be finding many points of contact between Peircean and Saussurian signs, nor between Cherry’s somewhat individual transformation of the Peircean sign and the Saussurian sign. (In fact the only connection between Cherry and de Saussure that we can point to is their joint appearance in a few paragraphs in Roman Jakobson’s “Linguistics and Communication Theory,” where Jakobson is explicitly attempting a wedding, in fact a shotgun wedding, which didn’t take, in Structure of Language and Its Mathematical Aspects: Proceedings of Symposia in Applied Mathematics 12, American Mathematical Society, Providence, 1961, 245-252). It’s too bad, because the Saussurian sign lacks the motivation of Cherry’s sign, and Cherry’s sign desperately needs de Saussure’s clarifying and simplifying formalism. Meanwhile analytic linguistic speech-act theorists like J. L. Austin are in a third world altogether, which again is too bad, because Austin’s efforts at understanding what one is
doing in saying something – especially his concept of the performative (yes, it originated here) –would be so much more valuable if they ever made contact with communication theory and/or semiology (but see Austin’s terrific How To Do Things With Words, Oxford, Oxford, 1962). Understanding how maps work – and how they accomplish work – really requires Peirce’s and Cherry’s motivation, de Saussure’s sign, and Austin’s performativity.
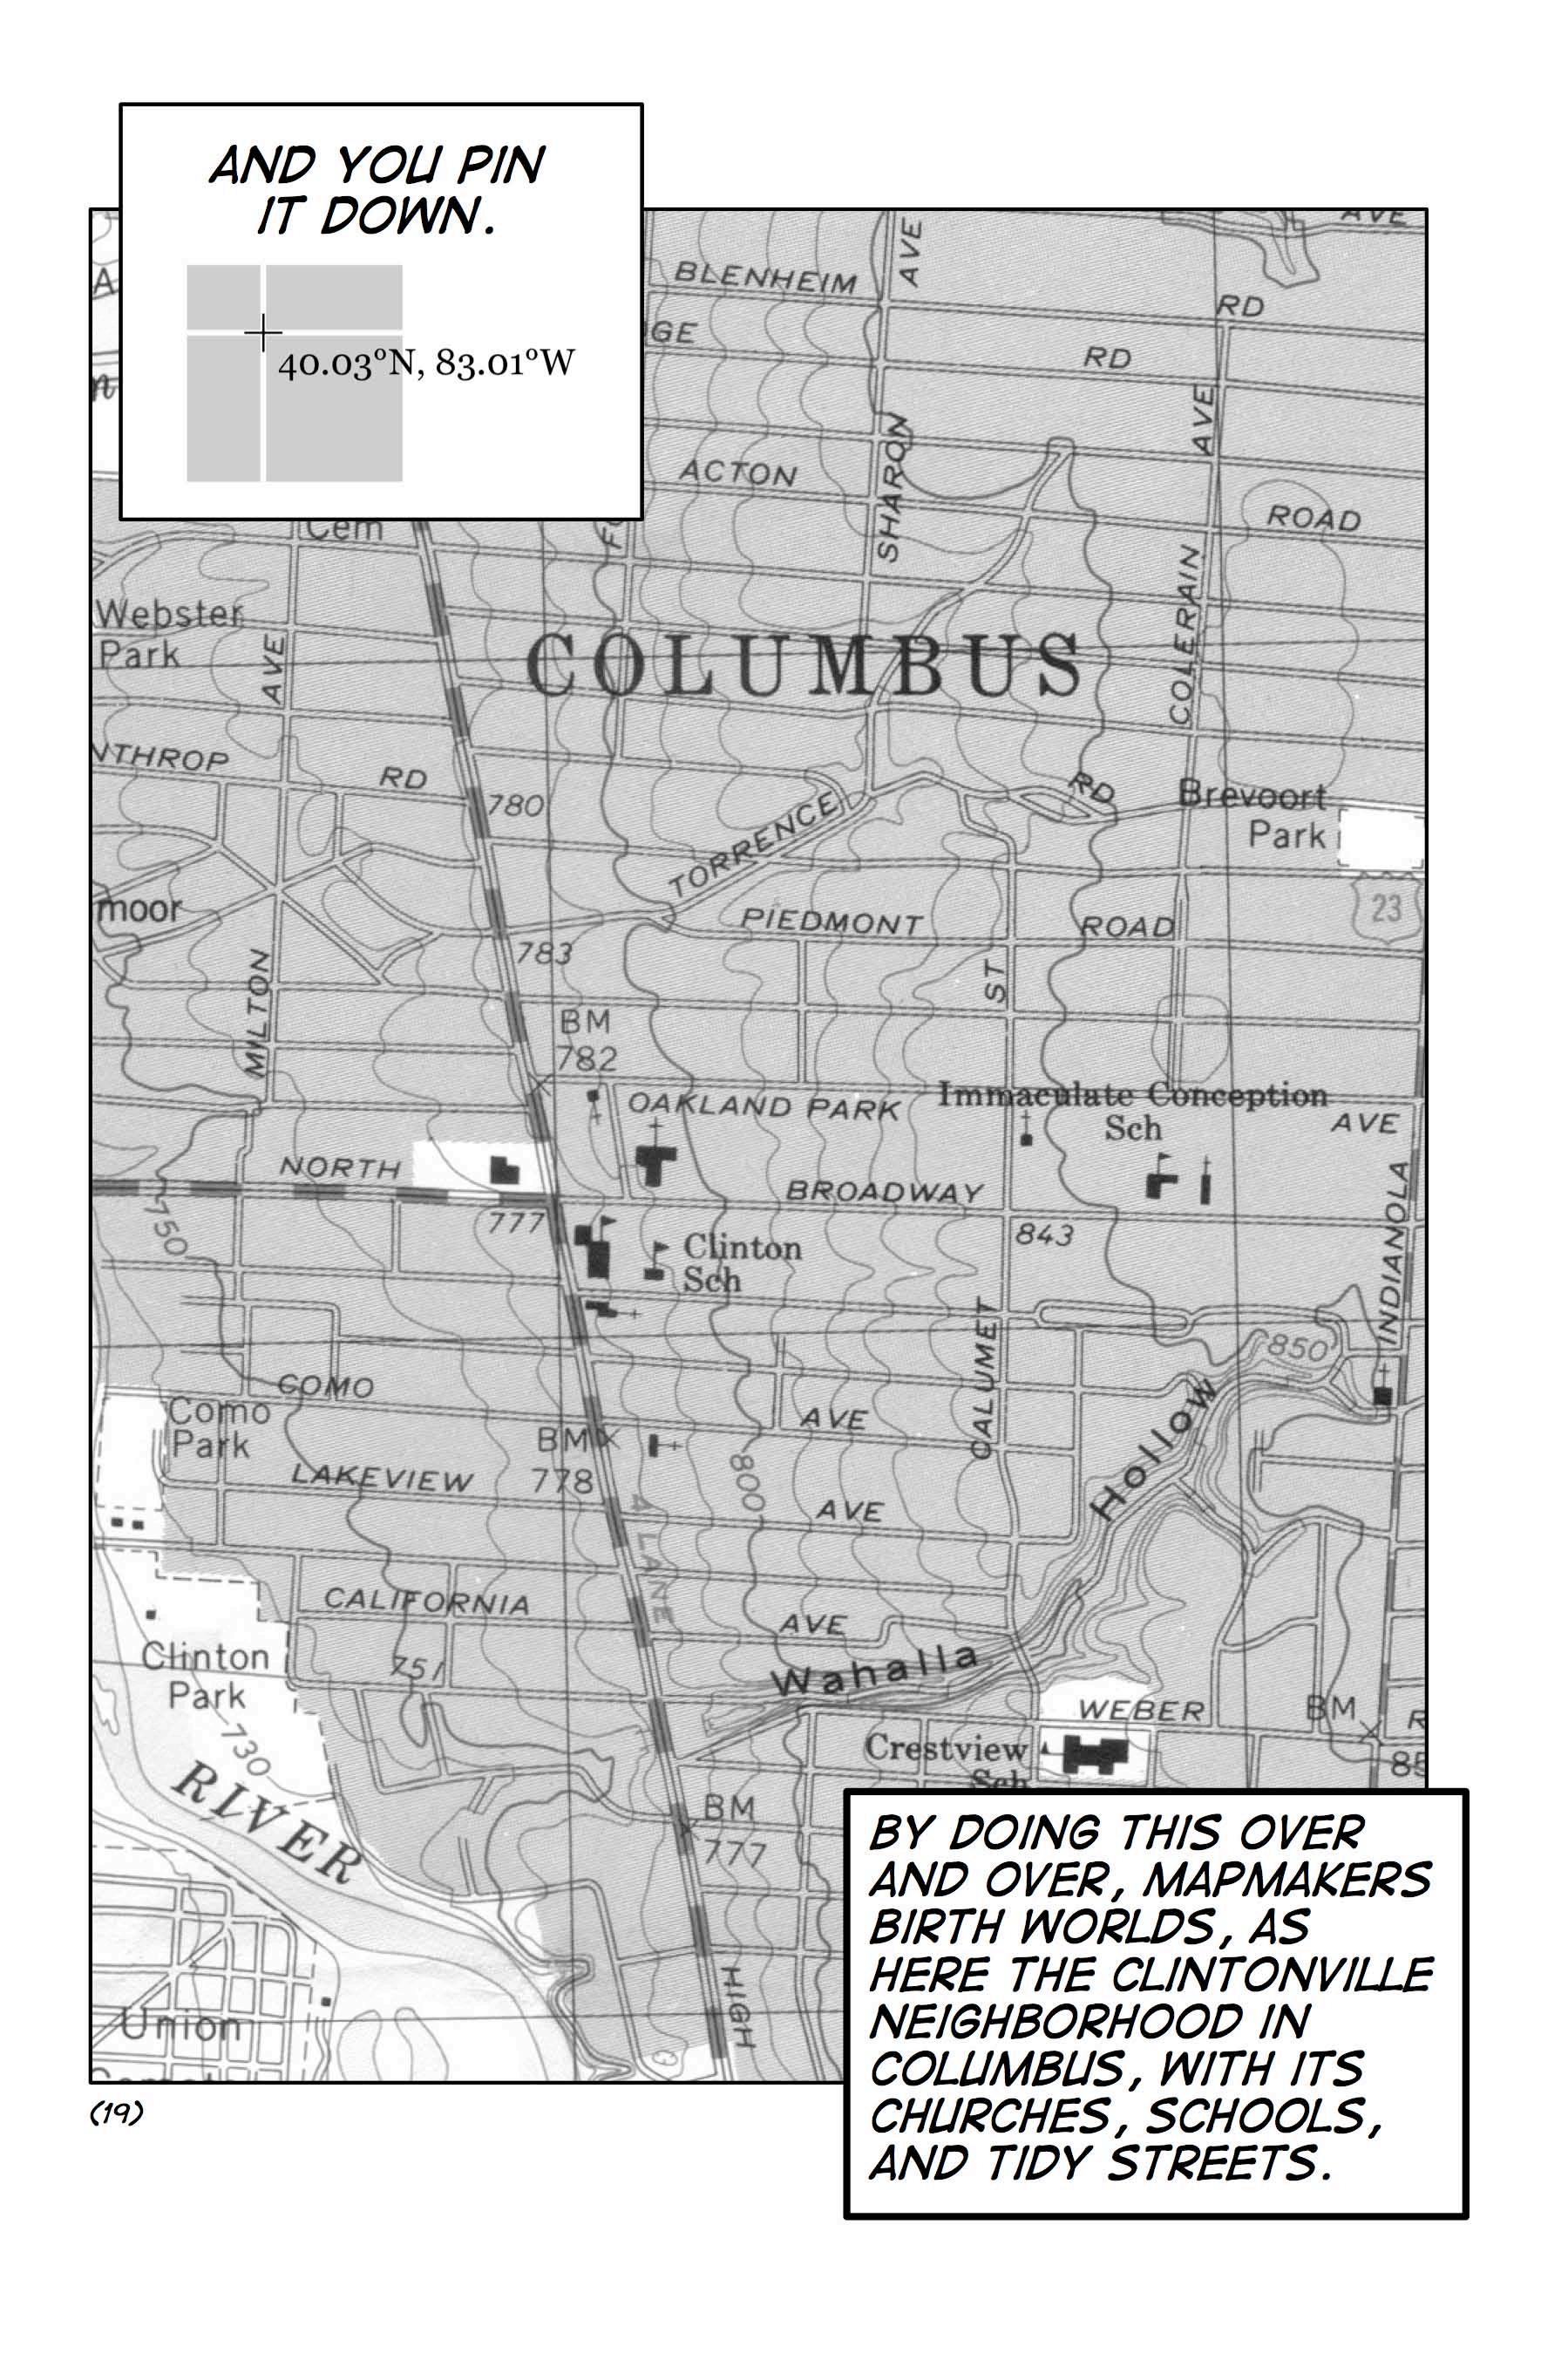
[20] The differences in motivation behind these two additional propositions about Clintonville reflect a resident’s critical perspective of the gentrifying, stereotypically progressive 1920s neighborhood in the city of Columbus. The map of political contributions reveals that a few Republican donations are as large as many Democratic donations. This suggests the need for debate about campaign financing based on the imbalance of wealth. More to the point, the map proposes that, within one of the most progressive neighborhoods in Columbus, there are a handful of wealthy Republicans who may be held partially responsible, from a local perspective, for the diverse failures of the Bush administration. Stop by and ask them how they justify their financing of the administration. The map of black residents of Clintonville proposes that the progressive residents think about the fact that racial diversity in the neighborhood is low. Clintonville is typical of progressive, gentrifying neighborhoods, where the politics are loud but the “practical” worries about property values and schools – code words intimately tied to race – trump politics. Both maps actively propose action – as with the topographic map that precedes them, engaging neighbors about the effects of their political contributions and addressing the contradiction of politics and diversity.

