


Smith Equity Research (SER) is a new program created by the Office of Experiential Learning at the Robert H. Smith School of Business. The program aims to provide students with a more hands-on approach to finance during the school year. In this program, students conduct research using the industry-edge Bloomberg Terminals that are present at the Smith School of Business.
With over 100 students in the program, SER provided a collaborative environment for the industry teams. As a group, the program produced complete reports on 13 companies which were then edited by RBC Capital Markets, our company partnership for this semester.
Through Smith Equity Research, students can use their financial knowledge and resources around them to create research that not only showcases their knowledge but also provides them with concrete deliverables to flex in interviews.
Total Members
113
11 Industries Covered
13 Companies Covered
99% Bloomberg Terminal Use
1 Company Partnerships
I wanted to create something for students that built on basic financial research principles. I knew the Bloomberg Terminals were not heavily used at Smith and it was something I could leverage for this program.
The program has brought people from all majors and walks of life eager to learn and apply their learning in their future interviews and internships. I am glad to say that while writing this report, I know that a few students have already been able to recieve internships from this program because of the work we do. The goal is experiential learning and that is what Smith Equity Research does.
Ayman Bootwala Founder

As a consistent user of the Bloomberg Terminal over the last two years, activity in the lab has skyrocketed this past semester with the inception of Smith Equity Research. Serving as the CoFounder and Executive Vice President has been extremely rewarding. Throughout the semester, a goal of mine was to teach members about utilizing the Bloomberg Terminals to understand cross-asset relationships and macroeconomic trends. In today's market, understanding the macro environment and its impact is crucial for students to excel in stock pitches, interviews, personal financial management, and even classwork. I am very proud of the inaugural membership class of Smith Equity Research and am looking forward to next semester!
Hannah WilletsCo-Founder
This section highlights those individuals who heavily contributed to the start of this program, thank you for all of your support!


Nima Farschi
Nima Farschi is one of the staff who works in the Office of Experiential Learning and has been pivotal in the success of this program.
Aditi Balachandran
Aditi Balachandran reached out to Smtih Equity Research and offered her support. As an Equity Research Associate at RBC Capital Markets, Aditi worked with students to improve their research.
Shourjo Saha
Smith Equity Research Treasurer
Shourjo Saha supported the program's work from the backend. Keeping the group on track to finish research, he is poised to lead the program next semester.
Eileen Chen
Eileen Chen assisted as the Office of Experiential Learning liaison and allowed Smith Equity Research to succeed in its first semester as a program. She also assisted with the creation of this report.

Whether you want to join as a student, faculty champion, or corporate partner, reach out to us by using the contact information below!
Website
https://bit.ly/3VbnXI7
Email smithequityresearch@gmail.com

Florida-based NextEra is in a saturated market in which they compete in three different segments: solar power, wind power, and utilities. After selling one of their strongest segments, Florida City Gas, they look to regain their previous peak share price while undergoing management changes. The future is not looking too promising as they deal with ESG concerns, raising interest rates, and a tough fight for market share. For a company that focuses on renewables, it will be very difficult to rebrand their image while also attaining more market share in such a competitive environment. Projections indicate that a seemingly unattainable growth rate will be necessary to maintain their current share price.
Therefore, NextEra Energy (NEE) is a SELL.
Growth is stunted by worries in ESG and value generation
NextEra Energy currently sits in an industry that has a lot of potential, but is currently quite stagnant in terms of value generation, a problem compounded by their high R&D costs. As ESG is playing a more vital role in how the average investor spends their available cash, it is important to consider how this will affect their target price in the future.

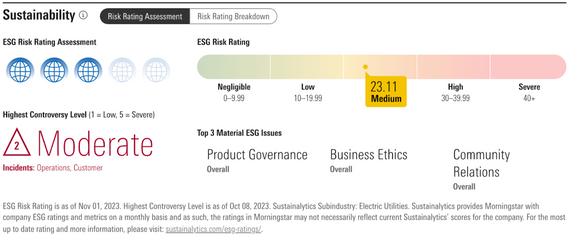
Although their business seems to be very ESG favorable since they are using renewable energy, Morningstar Sustainalytics gives them a 23.11 rating (“moderate”) primarily due to their product governance and business ethics. Another problem that stunts their growth and image is the regulatory processes that NEE is tied to. This rating indicates that they have a few problems regarding how they handle sustainability and also governance.
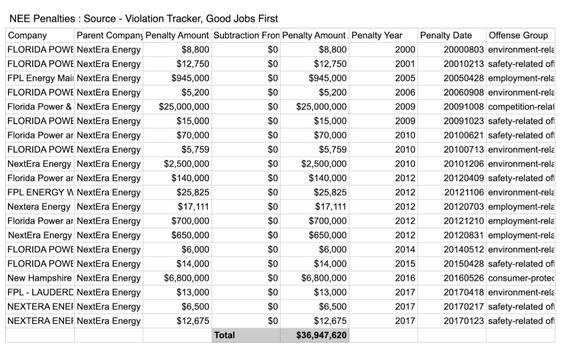
As an energy company, they are sensitive to any type of legal change in regards to how Florida controls their energy sector. Florida specifically has very strong regulatory policy when it comes to energy. NextEra paid $36 million in penalties related to environmental violations according to the Energy and Policy Institute. More recently, they have been involved in a class action lawsuit and allegations of campaign finance violations from the 2020 election cycle.

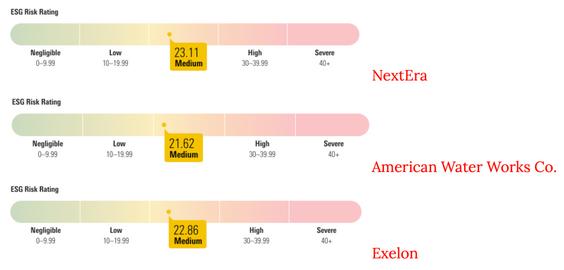
Comparing their Morningstar Sustailytics rating to their competitors, NextEra is slightly higher in terms of risk. However, the industry itself seems to be at similar risk levels. The significance lies in the type of risks that they currently bear. In NextEra’s case, they have product governance and business ethic risks based their legal troubles. Litigation is constantly changing for renewables which puts their future up in the air.
NextEra has been in key legal battles that continue to tarnish their image as a renewables company. In order to make up for environment and consumer violations, they have had to pay very hefty fines. Not only does this decrease their cash, but ESG-focused investors will most likely veer away from NEE in the future if they continue to stray from their mission statement. They have not gone more than 4 years without some sort of violation according to the Energy and Policy Institute. Their recent legal battles stretch their resources and decrease their brand value.
High-interest rate creates problems for shareholders
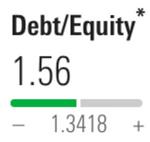
NEE has a debt to equity ratio of 1.56, meaning that they finance their business with mostly debt. The loans they take from banks accrue high amounts of interest, especially in this economy. Since the cost of borrowing is going up significantly, they will need to pay more in interest in order to fund the growth of their company. NextEra is looking to invest $80 billion into their business through 2027; they may struggle to have enough revenue to service this level of debt.
In addition to borrowing pains, they have demonstrated that they may not be financially stable enough to keep their dividend growth rate. They have slashed their dividend growth rate from 12%-15% to 5%-8%. This decreases investor morale as it indicates that they do not have the financial backing to keep paying consistent dividends. Slashing dividends can lead investors to question the reasoning behind why they are being paid less than projections.
Finally, the total yield this year for NextEra is negative. All of these points paint the picture that NextEra may not be able to fund their projected growth.

NEE is currency yielding negative returns for the year as they look to grow in the renewables space. With the selling of Florida City Gas, their target price dropped significantly and their financials most likely also took a hit.

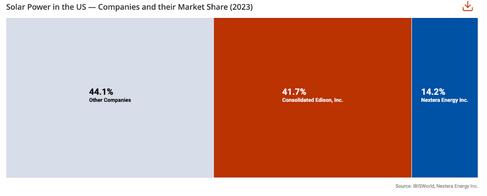
NextEra currently is competing in three specific sectors: Wind energy, solar energy, and utilities. Their best performing industry is their wind energy segment which is classified as an incumbent according to IBISWorld. Despite this, they only have a very small portion of the market share.
Although they are profiting from this sector, they have lost a lot of market share and revenue growth is looking bearish There are many other competitors, and research and development costs will continue to increase as other companies try to find a cheaper way to provide renewable energy. Their solar energy sector has more market share, but they are fighting a very strong incumbent in Consolidated Edison. In this segment, they are still losing market share as productivity also wanes further from the market average. With many competitors in this landscape, NextEra needs to find an innovative edge to hold on.
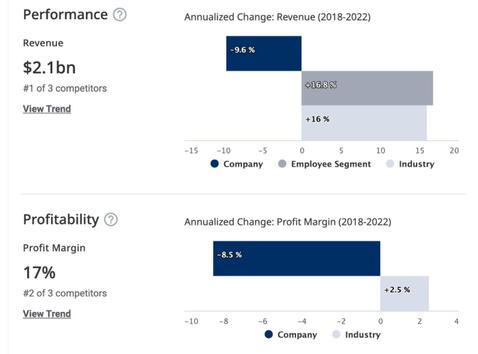
In their wind energy sector, they are lagging behind in terms of performance and profitability compared to the rest of the industry. Although they are the incumbent, these results in conjunction with the small market share that they have leads investors to have a bearish outlook on how much their revenues will grow in this sector.
Their final sector, utilities, is also very competitive. They own very little market share and there are issues with profitability. There are two strong incumbents in this sector and this will stretch NEE thin as they try to battle it out with everyone in the different sectors. Overall, NEE has to rely on the optimizations they are making in their business models to provide a competitive edge in a harsh and saturated market.

Although NextEra is labeled as a disruptor, they have a lot to prove before they can beat two very strong incumbents. Gaining a competitive edge in this industry is not very easy as customers are looking for reliability in order to power their everyday businesses. In addition to this, they have two other segments to attend to. With the recent selling of Florida City Gas, their leadership team is in a scramble.

How they manage their money will be up in the air and face challenges as they undergo management shifts. Good management is necessary as they pick what to invest in during their growth stage.
For all of these reasons, I will assign NextEra a Sell rating. They are competing in a very tough industry while going through financial challenges. In addition, they need a high growth rate to sustain their current share price which is difficult with the current high interest rates


Morgan Stanley is a bank holding company that provides diversified financial services worldwide. MS operates a global securities business, serving individual and institutional investors along with investment banking clients. They have 54 offices across 25 countries and over $1.4 trillion in assets under management. A combination of current market conditions, relevant catalysts, and Morgan Stanley’s strong performance and diversification in wealth and asset management have come together to create a perfect opportunity to buy into MS and create a long-term position.
Multiple catalysts, including a dip in stock price and a shift in leadership, indicate that present conditions have created a great opportunity to invest in Morgan Stanley (MS), one of the world’s largest and oldest banks.
MS is one of the most prestigious and reputable banks in the world. By market capitalization, they are the 8th largest bank across the globe at a current market cap of $140.83 billion. Historically, Morgan Stanley’s stock has grown at a strong and consistent rate. Since James Gorman became CEO in 2010, MS stock has grown 141%, outperforming all of its peers outside of JPMorgan Chase.

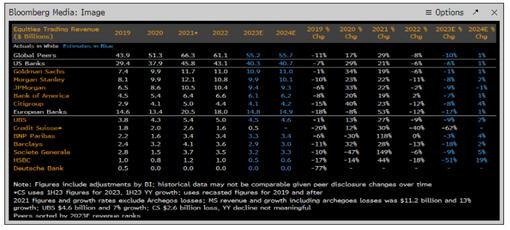
Additionally, MS earned $10.8 Billion in equities trading revenue in 2022, beating all rivals other than Goldman Sachs (see figure below). MS is forecasted to continue outperforming many of its peers in terms of revenue moving forward, and for years has been a strong and safe investment.
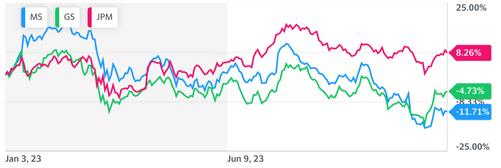
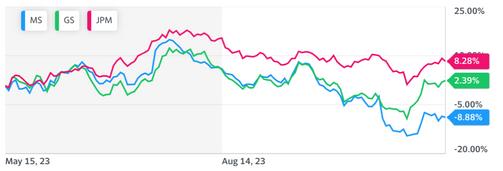
Morgan Stanley’s stock was valued at $75.92 as of the close on November 6th. Due to poor market conditions and slow recovery in M&A activity, the financial sector’s overall performance was struggling up until the past couple weeks. Despite Morgan Stanley’s strong fundamentals, the company was affected by market conditions as well. As of November 6th, MS stock price was down 10.30% year-to-date (See figure below). However, this presents a rare opportunity to invest in Morgan Stanley at a greatly discounted valuation. Morgan Stanley has been a safe and profitable company to invest in for years, and this rare pullback in price makes the present moment a great time to buy in.

Morgan Stanley’s current CEO, James Gorman, will be retiring on January 1st, 2024. He will be succeeded by Ted Pick, who currently oversees the company’s institutional securities division. Pick was chosen over Andy Saperstein and Dan Simkowitz, both current executives of Morgan Stanley. A shift in leadership can act as a catalyst impacting company performance and stock price, and in this particular case there was the possibility that the other two candidates could have walked away from the company. Fortunately, both Saperstein and Simkowitz agreed to take on new leadership roles within MS, allowing both of them to exhibit their leadership and expertise in new capacities moving forward, and making it clear that MS will be in good hands.
In recent years, Morgan Stanley has made a large shift towards wealth and asset management which has bolstered their revenue and growth.
Their investment and deal flow in wealth and asset management have served as a strong source of revenue and capital, and will continue to do so moving forward.
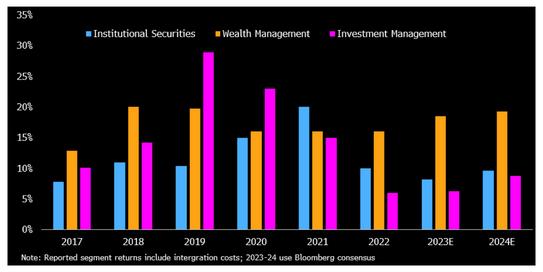
Under James Gorman’s leadership, Morgan Stanley developed a long-term shift towards wealth and asset management, which has allowed them to boost returns and recurring revenue. Despite low M&A activity, MS has been able to continue growing capital through their wealth and asset management ventures, which account for 52% of the bank's pretax profit. 55-65% of profits are forecasted to be generated by MS’s wealth and asset management business in 2023. The graph below shows how return on equity from wealth management is forecasted to continue growing through 2023 and 2024. Morgan Stanley’s heavy investments in their wealth and asset management business gives them a competitive advantage over their competitors, who rely more heavily on M&A activity for their revenue.
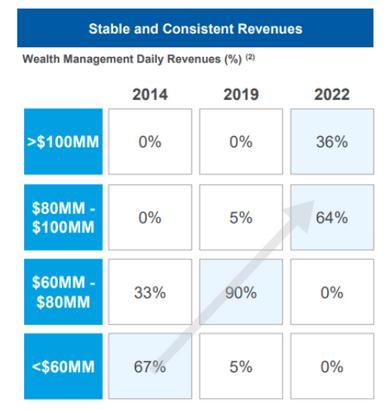
In 2022, revenue from wealth management was over $80 million a day. This shows tremendous growth since 2019, when revenue from wealth management only reached $80 million a day 5% of the time.

The table below reveals that wealth management daily revenues have been increasing steadily over the years and shows no signs of slowing down. Morgan Stanley’s wealth management is providing them with the extra capital it needs to reinvest in the company and continue growing at a steady rate.



The interplay of these factors supports our balanced stance on Magnolia’s stock. The long-term recommendation, therefore, is to hold Magnolia stock.
We highlight the opportunity for patient investors to consider the value of MGY’s strong asset base, noting that Magnolia Oil and Gas Corp in particular could present a notable upside down the road. Magnolia has made several strategic decisions that increase our conviction in the value of this asset, including significant insider buying activity, acquisition of new, high-growth properties and mineral interests,
In this note, we take a closer look at the Oil and Gas E&P industry and Magnolia’s competitive positioning, strategic outlook, and its potential value in consideration of its recent Q3 Earnings Call, as of November 1, 2023.
Within the broader and rapidly growing exploration and production (E&P) landscape, Magnolia Oil and Gas Corp stands out as an independent upstream operator engaged in the exploration, development, and production of natural gas, natural gas liquids, and crude oil.

Headquartered in Houston, TX, the firm is focused on the Eagle Ford Shale and Austin Chalk formations in South Texas.
Magnolia was formed in 2018 through the acquisition of private operator EnerVest’s South Texas division by TPG Pace Energy Holdings Corp. - a SPAC (Special Purpose Acquisition Company) backed by private equity group TPG Capital and former chairman of Occidental Petroleum Steve Chazen.
In South Texas, Magnolia’s position consists of more than 470,000 net acres of which around 24,000 are located in the highly productive Karnes County and more than 447,000 are in the re-emerging Giddings Field.
Magnolia seeks to create value for investors by growing their premier asset platform, generating substantial free cash flow, maintaining financial flexibility, and ensuring thoughtful capital allocation.

Data Overview
The short-term investible conclusion is to buy Magnolia stock as per its Q3 2023 earnings call. Owing to their dividend principles, commitment to sustainability, financial strength, and share repurchases, they have the vision to generate stock market value over the
long-term through consistent organic production growth, high full-cycle operating margins, and an efficient capital program with short economic paybacks.
The underlying objective is focused on strengthening communities through employment opportunities and utilizing local vendors.
1 YR Catalyst: Magnolia is repurchasing its shares in an insider buying activity
Since the initial repurchase authorization in 3Q19, Magnolia has reduced its dilutive share count by 32.5 million shares of Class A common stock, which includes 3.6 million non-compete shares that were paid in cash in lieu of stock in 2021. In addition, Magnolia reduced 26.9 million shares of Class B common stock, for a total reduction of 59.4 million shares, or approximately 23% of the diluted shares outstanding as of the authorization date. Magnolia also repurchased 2.5 million shares during 3Q23.


Magnolia’s board approved a 10 million share increase to the current share repurchase authorization in 2Q23. As per its recent earnings call 3Q23, the company repurchased 2.5 million of its Class A common stock during the third quarter for $56.8 million. Magnolia has 11.7 million Class A common shares remaining under its current repurchase authorization which are specifically allocated toward open market share repurchases. Including this increase, 11.7 million shares remain under the current share repurchase authorization. Magnolia plans to continue to opportunistically repurchase at least 1% of the total shares outstanding each quarter. Repurchases return cash to shareholders who want to exit the investment.
On September 12, 2023, Director James Larson purchased 1,000 shares of the company, marking a significant insider buying activity. His decision to increase his stake in the company is a strong vote of confidence in the company's future.
With a buyback, the company can increase earnings per share, all else equal. EPS for the last 12 months (TTM)
is $3.47. Our advice to investors is to keep a close eye on further trading activity by executives for additional clues about the company's future performance.
5Y Catalyst: Magnolia has maintained its commitment to sustainability
Magnolia is well-positioned to deliver sustained value for investors while operating business in a safe and environmentally responsible manner. Magnolia regularly publishes its Sustainability Report as an important part of that process which provides an overview of Magnolia and its culture and highlights the actions they have taken and the results achieved in several environmental, social, and governancerelated areas. The report also provides quantitative results for performance in various ESG areas based on the Sustainability Accounting Standards Board (SASB) standards for Oil and Gas – Exploration & Production.
In 2022, Magnolia reduced its Greenhouse Gas (GHG) intensity rate (GHG emissions as a percentage of gross operated production) by nearly 10 percent since 2019.

In 2022, Magnolia reduced flaring intensity rate (a major source of CO2 emissions) by more than 64 percent compared to the 2021 rate. In 3Q23, Magnolia recorded its lowest annual flaring rate at 0.11%, a reduction of ~90% since 2019. Magnolia ensures a commitment to safe operations with a low total recordable incident rate

which has declined by 14% from 2021 to 2022, strong HSE training initiatives, and a vision to continue to deliver a capital-efficient operating program and create value on a per-share basis.

10 YR Catalyst: Strategic acquisition of ~48,000 net acres in Giddings
Magnolia announced on September 5, 2023, that the Company has entered into a definitive purchase agreement to acquire certain oil and gas producing properties including leasehold and mineral interests in Giddings for $300 million, subject to customary purchase price adjustments. The cash outlay at closing is estimated to be approximately $260 million, adjusted for the free cash flow generated by the assets between the effective date of July 1, 2023, and the anticipated closing date in the fourth quarter of 2023. The consideration will be funded with cash on hand, which was $677 million as of June 30, 2023. The seller may also receive up to a maximum of $40 million in additional contingent cash consideration through December 2025 based on future commodity prices.
The acquired assets are attractively valued at 2.9x estimated 2024 EBITDA and are expected to generate a free cash flow yield of more than 20% during 2024 at current strip prices.
They also provide high cash operating margins through access to premium Gulf Coast pricing and low per-unit operating costs. Combined with a smaller acquisition that closed in July 2023, Magnolia’s position in Giddings now totals over 500,000 net acres, driving further efficiencies of scale.
The acquisition is expected to be immediately accretive to the company's cash flow, free cash flow, and earnings. Magnolia funded the acquisition with cash on hand and borrowings under its revolving credit facility which also demonstrates its ability to utilize its strong balance sheet and prudently allocate surplus capital to improve overall business and enhance share value.
Exploration & production (E&P) is a sector within the oil and gas industry linked to the early stage of energy production, which generally involves upstream or E&P companies finding reservoirs and drilling oil and gas wells.
In 3Q23, publicly traded U.S. oil firms increased capital expenditures despite a drop in cash from operations. Consequently, exploration and production (E&P) companies increased crude oil and natural gas liquids (NGL) production to 6.3 million barrels per day, nearly matching pre-pandemic levels. This was achieved by focusing on drilling and completing more wells while keeping costs in check by utilizing drilled but uncompleted wells (DUCs).
The declining number of DUCs indicates E&P firms' sensitivity to elevated production costs, prompting operational adjustments to manage expenses. Moreover, with Saudi Arabia

and OPEC+ members implementing production cuts, WTI crude oil prices are projected to stay above $80 per barrel until the end of 2024. This scenario positions the United States as a key driver of global crude oil production growth, promising a favorable outlook for E&P companies to continue production expansion.
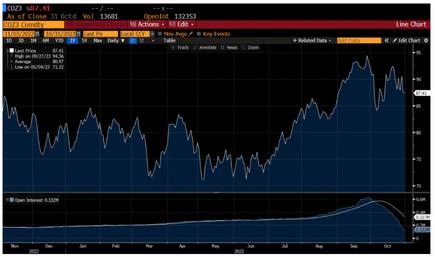
The escalating conflict between Israel and Hamas threatens to push oil prices higher over the short term, which signals a purchase of stock in the E&P industry. One key player on the sidelines of the war is Saudi Arabia which has already cut production in recent months but has also engaged in diplomatic talks with Israel, which are now complicated by the war. Other petro-states will be less directly affected by a conflict in the Middle East as oil prices have stabilized amid the Ukraine-Russia war. In the case of a ‘small disruption’ global oil supplies will see a reduction of 500,000 barrels to 2 million barrels per day, a decrease rivaling that seen during the 2011 Libyan civil war. In a ‘large disruption’ scenario comparable to the Arab oil embargo in 1973 the global oil supply would shrink by 6 million to 8 million barrels per day, which would drive prices up by 56% to 75% initially to between $140 and $157 a barrel. While both Israel and the Palestinian territories are not major oil players, there is resistance from other oilproducing nations like the United States. Sen. Lindsey Graham (R-S.C.) on October 15, 2023, suggested the U.S. should destroy Iranian oil refineries and infrastructure if the conflict continues to escalate. The United States could release oil from its strategic petroleum reserve if prices spike; if the war
continues for a longer period, crude oil prices will see significant gains.
The main competitors of Magnolia Oil & Gas include SM Energy (SM), Viper Energy Partners (VNOM), Denbury (DEN), Crescent Point Energy (CPG), Black Stone Minerals (BSM), California Resources (CRC), Northern Oil and Gas (NOG), Enerplus (ERF), Comstock Resources (CRK), and CNX Resources (CNX).
Magnolia’s producing properties are predominantly located in South Texas with output from the acreage representing 100% of the total volume. While the company’s production is growing at a consistent clip, Magnolia is faced with asset concentration risk with output skewed toward a single region. The lack of geographic dispersal of properties disproportionately exposes the company to regional factors compared to its more diversified peers.
Magnolia does not engage in commodity price hedging. While this policy will help the company in capturing upside exposure to the near-to-medium-term rebalancing of oil markets, the lack of any hedge protection makes Magnolia more exposed to potential weakness in crude prices than some of its peers.
While Magnolia has been enjoying a tailwind from the oil rally since the

second half of 2020, the volatility in commodity prices is posing challenges for the company. In particular, with liquids accounting for around 70% of Magnolia’s reserves and production, the company’s results are vulnerable to fluctuations in oil markets. Surging inflation might lead to the stock witnessing a downward pressure. With skyrocketing labor and material costs, the ability to pass on the additional costs to consumers will determine the profitability of upstream energy companies like MGY. Total operating expenses edged up 1.6% year over year to $159 million in 2Q23.
Magnolia Oil & Gas reported its 3Q23 earnings call recently, which demonstrated that Magnolia continued to execute its business model delivering solid operating and financial results during the third quarter. Its thirdquarter production volume stands at 82,700 barrels of oil equivalent per day, which established a new quarterly record for the company. The Giddings asset acquisition also drove overall growth both year-over-year and sequentially Giddings continues to represent a greater proportion of total company production now comprising approximately 75% of its total volume. Its adjusted EBITDAX for the quarter was $239 million with total capital associated with drilling completion and associated facilities of $104 million.
As for 4Q23, Magnolia is currently operating two drilling rigs and plans to continue this level of activity through the end of the year. It expects D&C capital for 2023 to be approximately $430 million, which represents a $75 million reduction or 15% from its original guidance this year. Despite lower capital spending, Magnolia is
increasing its full year 2023 organic production growth guidance to 8% or 9% when including the acquired volumes. For the full year 2023, the expected effective tax rate is ~21% with most of this being deferred. The cash tax rate is expected to be between 6% and 9% for 2023
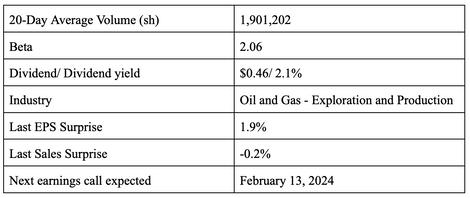
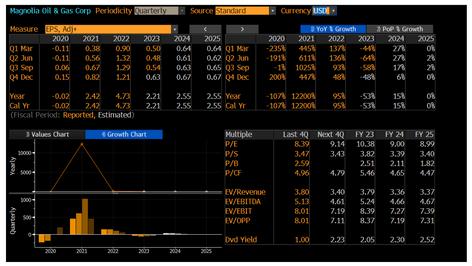
For the quarter ended September 2023, Magnolia reported EPS at $0.54, compared to $1.29 in the year-ago quarter. The company delivered an EPS surprise of +1.89%, with the Zacks Consensus EPS estimate being $0.53.

Magnolia last quarter came out with quarterly earnings of $0.44 per share, beating the Zacks Consensus Estimate of $0.43 per share, which represents an earnings surprise of 2.33%. This compares to earnings of $1.10 per share a year ago. Over the last five quarters, the company has surpassed consensus EPS estimates five times.

Oil as a commodity witnesses large fluctuations in price; if political conflicts like the Israel-Hamas war were to escalate and disrupt oil supplies, prices could shoot up by as much as 75% to $157 a barrel under the worst-case scenario.
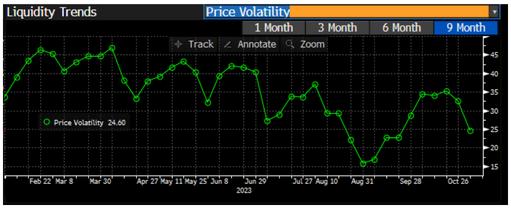
However, Magnolia has liquid assets that match its ability to repay its debt obligations and profitability indicators which imply investor interest in its financial strength.
Liquidity Analysis:
Quick Ratio: 3.10
Current Ratio: 3.10, compared to the industry average of 2.39
Current Liquidity of $1.1 billion, including fully undrawn credit facility of $450M.
No debt maturities until senior unsecured notes ($400M) mature in 2026.
Profitability Analysis:
ROA: 28.30%, average ROA for the industry was 12% in 2022
ROE: 48.20%, average ROE for the industry was 26% in 2022
ROI: 32.50%, great short-term financial strength
Profit Margin: 46.36%
For the quarter ended September 2023, Magnolia Oil & Gas Corp (MGY) reported revenue of $315.68 million, down 34.6%
over the same period last year. The reported revenue compares to the Zacks Consensus Estimate of $316.43 million, representing a surprise of -0.24%. Third quarter production volumes grew 1% sequentially to 8,2700 barrels of oil equivalent per day.
Looking ahead at 4Q23, Magnolia expects the recently announced transaction to close in November and help contribute to the fourth quarter volumes. It expects total production volumes to be approximately 85,000 MBOE a day and the D&C capital is estimated to be approximately $100 million. Oil price differentials are anticipated to be at a $3 per barrel discount to MBH, and the fully diluted share count for the 4th quarter is estimated to be approximately 207 million shares, which is 4% lower than year-ago levels.

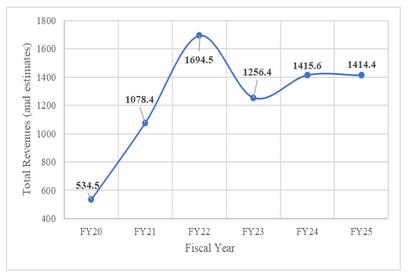
As per 3Q23, the revenues for Natural gas represents a change of -73% yearover-year, for Natural gas liquids represents a year-over-year change of -31.4%, and for Oil represents a -23.2% change compared to the year-ago quarter. Over the long-term, revenue projections remain steady.

To check if MGY is fairly valued, we are using the 2-stage growth model, which simply means we take in account two stages of company's growth. In the initial period, the company may have a higher growth rate and the second stage is usually assumed to have a stable growth rate. In the first stage, we need to estimate the cash flows to the business over the next ten years. Where possible we use analyst estimates, but when these aren't available we extrapolate the previous free cash flow (FCF) from the last estimate or reported value. We assume companies with shrinking free cash flow will slow their rate of shrinkage, and that companies with growing free cash flow will see their growth rate slow over this period. We do this to reflect that growth tends to slow more in the early years than it does in later years.

We now need to calculate the Terminal Value, which accounts for all the future cash flows after this ten-year period. The Gordon Growth formula is used to calculate Terminal Value at a future annual growth rate equal to the 5-year average of the 10-year government bond yield of 2.0%. We discount the terminal cash flows to today's value at a cost of equity of 7.6%.
Terminal Value (TV) = FCF2031 × (1 + g)
÷ (r – g) = US$509m× (1 + 2.0%) ÷ (7.6%–2.0%) = US$9.1b
Present Value of Terminal Value (PVTV)
= TV / (1 + r)10= US$9.1b ÷ ( 1 + 7.6%)10 = US$4.4b
The total value is the sum of cash flows for the next ten years plus the discounted terminal value, which results in the Total Equity Value, which in this case is US$7.7b. To get the intrinsic value per share, we divide this by the total number of shares outstanding.
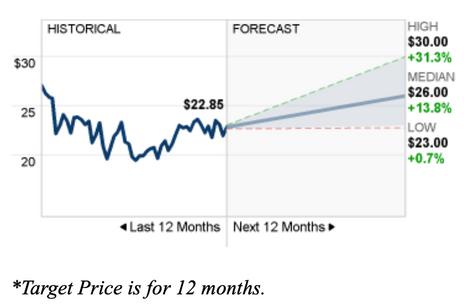
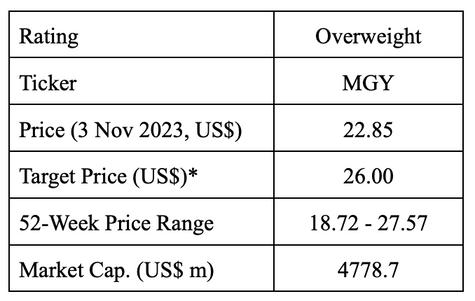
Compared to the current share price of US$22.85, the company appears to be trading at a 38% discount currently.
 10-Year Free Cash Flow (FCF) Estimate

Opal Fuels Inc. is a leader in the biogas and alternative transportation fuels industry because of its established contract-based relationships with customers, positive environmental impact, and control of the RNG value chain (upstream production and downstream marketing activities). For these reasons, I am pitching Opal Fuels as a buy.
The macroeconomic conditions and tension in the Middle East are placing pressure on the global supply of oil and gas. At the same time, there is a growing demand for sustainable green energy in developed countries. Opal is positioned to rapidly grow in the alternative fuels market given the social and environmental incentives at this moment
Global oil prices will rise as a result of conflicts in the Middle East and green energy incentives implemented in the Inflation Reduction Act of 2022. The US government is incentivizing the use of renewable energy and electric vehicle adoption through subsidies, but many of these projects have been inhibited by the slow rate of permitting and high interest rates. Going forward, waste-to-energy biogas produced by companies like Opal will grow increasingly important. Opal will benefit from rising oil prices and pressure for companies

to reduce their environmental footprints. Opal is well suited to capitalize on the energy transition, as the biogas can be delivered through their own distribution system for and sold to existing natural gas pipeline infrastructure.
Opal Fuels in operating in an attractive and rapidly growing industry. In the next few years, demand for biogas and renewable natural gas (RNG) will exceed the supply available. Opal Fuels can expand its operations to address this demand and establish the company as the leader in the industry. The company has already built relationships and signed 10 year contracts with valuable customers including Amazon, UPS, and Waste Management. The company will continue to grow their relationships with customers and grow its market

share. Opal’s vertical integration across the RNG space maximizes the company’s potential for growth in this challenging and competitive sector. As consumers continue to enjoy delivery services, Opal Fuels can help these services achieve net-zero goals.
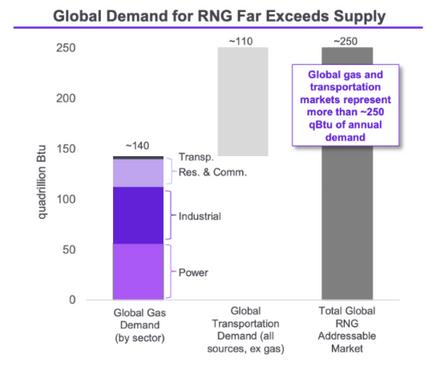
The energy sector is difficult for companies to succeed in. Oil and gas operations are expensive, highly regulated, and controlled by a few big players. Additionally, renewable projects are young, hard to integrate, and have been recently thwarted in the US by interest rates and supply chain challenges. However, Opal’s valuation metrics reflect the company’s strong fundamentals despite sector headwinds.
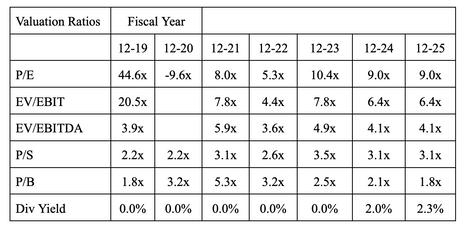
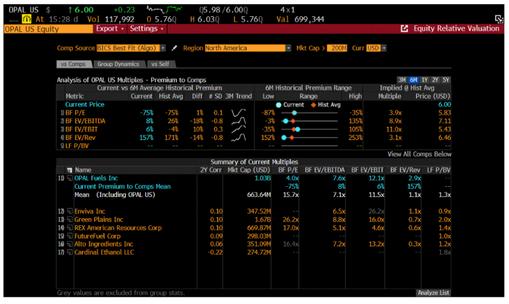
Wall Street analysts’ valuation for Opal is attractive from an investor standpoint for an alternative/renewable fuels company in the energy sector. The P/E ratio is 8.28, illustrating that this company has been profitable and the
stock could be considered a bargain for the price. The P/E multiple is 3.9x. Comparable companies in the analysis below were 26.2x and 17.0x. Higher historical P/E multiples for the comparables indicate that the other companies are overvalued by the market. The comparables shown in the figure below without P/E ratios mean that they are not profitable, a common challenge for energy companies. Opal has established an operation that is capital-intensive but has learned how to be profitable and is actively taking market share.
The market expects Opal to generate $417 million in annual revenue for 2024. This is nearly double the annual revenue (historical and predicted) for 2022 and 2023. If Opal comes close to meeting these expectations, the company will be growing its gross margins for the third consecutive year. Wall Street forecasts $106 million in operating income, a 304% YoY growth. These projections indicate the company is becoming more cost effective and fundamentally strong. Investors should take advantage of the opportunity to invest now given the optimistic future outlook for net income and revenue for FY23 and FY24.


I recommend buying T-Mobile Stock. There have been mixed results regarding how T-Mobile is performing. First, TMobile has a decrease in revenue in 2023. However, T-Mobile’s new advancements allow future growth to be seen. This is also the case from their lead in broadband and 5G. They are competitive relative to other companies in the industry, and their overall financial performance makes their stock heading into the buy direction.
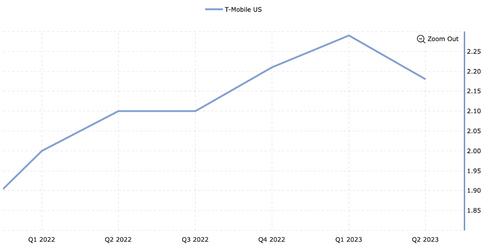
T-Mobile is listed as a 2023 low-risk investment. Although T-Mobile’s revenue is decreasing in Q1 and Q2 of 2023, they are working on the “increase in postpaid upgrades and the tendency to shift toward devices compatible with the TMobile network, longer device lifecycles, combined with a reduction in lease revenues” (Zacks Equity Research, 2023). They have multiple revenue sources and the equipment portion created the most impact to their decrease in revenue. However, bringing multiple benefits makes the decrease in overall revenue acceptable for buying the stock. In addition, the positive moves allow a new growth to be seen. Furthermore, the operating margin for T-Mobile is increasing over time. Their available cash has improved from 2023 Q1 to 2023 Q2.

This is a positive initiative for buying stock. The price to sales ratio is shown as a decrease from 2023 Q1 to 2023 Q2. This shows the investment to be good. Overall, I would buy this stock.
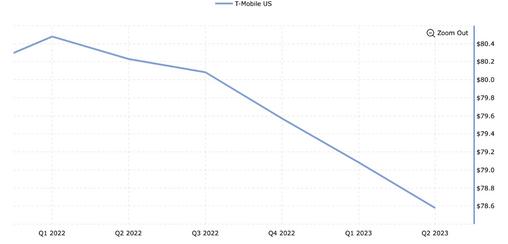

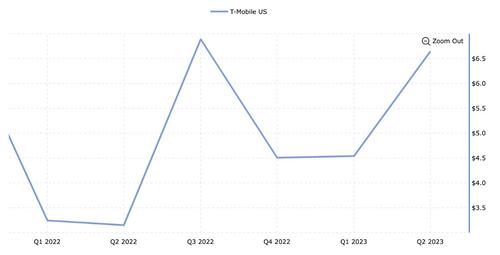

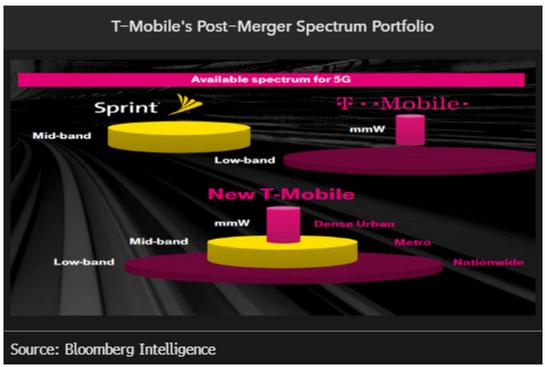
In 2018, T-Mobile merged with Sprint, allowing them to better compete with Verizon and AT&T. In comparison to the competition, T-Mobile has more free cash flow. In addition, T-Mobile decided on quarterly dividends in their 2023 capital plan. On the other side, “Verizon and AT&T struggle to maintain dividends” (Krause, 2023). Verizon and AT&T have less 5G ratio spectrum compared to TMobile. Based on T-Mobile 2023 Q2 earnings call report from Bloomberg Terminal, “median download speeds, more than double our closest competitors.”
Amazon wants to have mobile phone service for its Prime customers through wireless carrier companies. Since Amazon is a large company, with “over 200 million” (Dean, 2023) Prime customers, it would add another
competitor to the market, and in June 2023, T-Mobile was already impacted by this.
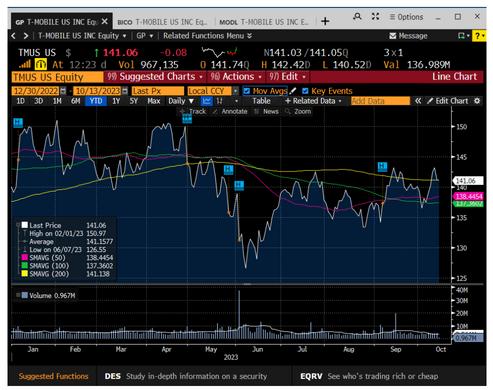
However, T-Mobile is positioned to remain in a strong financial position even if Amazon enters the market.
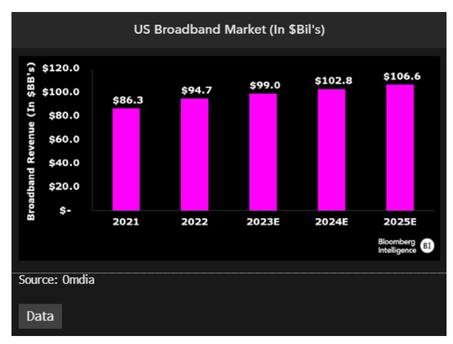
T-Mobile is now known as the lead in broadband and expected their broadband sales to double from 2022. In addition, this fixed wireless access is seen to be a fast-growing technology. T-Mobile also wants “to spread its wireless coverage into smaller markets” (Bloomberg Intelligence). As T-Mobile expands and advances, higher profit is achievable.

T-Mobile is also the lead in 5G. This foreshadows continued profits for TMobile. In the second quarter of 2023, there was a net increase of 1.6 million customers because of 5G. Shown through the data from Bloomberg terminal, there was a trend from 2022 to 2023 that shows the increase in cellular subscribers.
“Bloomberg Intelligence Prime” states that T-Mobile’s “lead in 5G is yielding share gains and may remain its main expansion driver for several years.” In the future, T-Mobile’s revenue is expected to increase and it will grow in the 5G space.


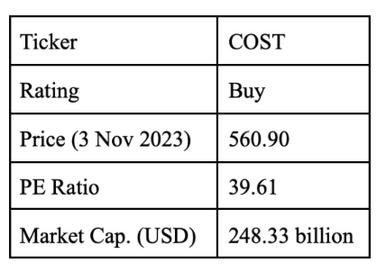
Costco's proven ability to adapt and thrive in a dynamic market, coupled with its commitment to delivering value to its members, positions it as a formidable company in the retail sector. Costco’s resilient business model, positive growth indicators, and impressive financials make it a stock worth adding to the portfolios of investors looking for stability, growth, and long-term value. Therefore, this report recommends Costco as a buy.
With its commitment to customer satisfaction, exceptional business model, and focus on delivering value, Costco has managed to maintain a track record of growth and profitability. This report analyzes Costco’s performance, financial health, and future prospects to provide investors with an informed perspective on whether to buy, hold, or sell the company’s stock. Costco, founded in 1983, has emerged as a leader in the retail industry and a global icon in the world of warehouse clubs.
Headquartered in Issaquah, Washington, the company has expanded its footprint to operate over 800 warehouse stores worldwide, serving millions of members. Costco's unique business model, which includes a membership-based structure, is designed to offer its customers access to a wide array of high-quality products at competitive prices. This

model, combined with a focus on employee welfare, sustainability, and customer satisfaction, has made Costco a standout brand in the highly competitive retail sector.
One of Costco’s distinguishing features is its membership model. Ranging from basic to gold to executive membership, customers pay an annual membership fee to gain access to Costco’s stores and online offerings. A key aspect of sustaining growth is relying on adding new members, maintaining high renewal rates, and increasing customer spending. Because executive members account for ⅔ of sales, the conversion of customers from basic to gold to executive membership is vital. Costco’s membership is consistently growing, which signals growth and stability for the company, despite inflation. Furthermore, Costco last raised membership fees in the U.S. in June 2017, so membership fees remain affordable and attractive.
Costco's business strategy also revolves around offering high-quality products at competitive prices. The company achieves this by keeping its operational costs low, optimizing its supply chain, and minimizing expenses. Passing on cost savings to its members allows it to maintain healthy profit margins. Costco is currently focusing

on preserving value perception, combined with its treasure hunt approach to retail, which is successfully driving store visits and customers spending. It has been concluded that same store sales are strong enough to remain long term growth, indicating positive growth for Costco.
Costco experienced a 6% sales gain, which may be an indication of a stronger consumer fiscal in 1Q, despite average spending declining slightly due to softer discretionary outlays, while the frequency of visits remained high. Comparable sales, excluding fuel and foreign exchange, were up 3.7% in the five weeks ended Sept. 3.
Costco's October sales gains of 4.5% were fueled by more traffic, despite the average amount spent falling again due to softer discretionary spending. Consumers remain frugal and continue to favor essentials amid persistently high inflation. Comparable sales, excluding fuel and foreign exchange, were up 3.4% in the four weeks ended Oct. 29.
This is a positive indicator of growth because it signifies that the amount of customer visits has been increasing, however, the amount spent per customer has been decreasing. This is not an issue because Costco’s increase in traffic itself is enough to sustain a positive sales gain
As mentioned above, Costco’s traffic
yields sales growth, and the post-4Q earnings outlook elaborates on this. In summary, it states that despite tough year-over-year comparisons, same-store sales growth remains solid, surpassing increases in the average transaction size, as consumers economize on discretionary goods. Further support for sales in fiscal 2024 includes the strong demand for food and sundry items and robust membership renewal rates, which should boost annual membership income.
Costco declared the opening of 23 new warehouses in fiscal 2023, and expects more store openings in fiscal 2024. This acts as a sales driver and signals potential growth. Although 23 may seem like a modest amount, Costco’s stores contain a large footprint, attracting a significant number of customers, but most importantly, more members. Because membership fees encompass a large portion of gross profits, the fees from expanding membership base will overshadow the sales that new stores will generate.
Around five years ago, Costco's membership was around 51.6 million households. In the fiscal third quarter, it stood at 69.1 million. With its expansion efforts, it is estimated that membership will increase to approximately 85 million in 5 years.
The sales growth of 9.4% beat the consensus, indicating that increased foot traffic surpassed the average transaction size. The adjusted earnings per share (EPS) for fiscal 4Q amounted to $4.86, surpassing consensus estimates by 1.7%. The core gross

margin expanded by 16 BPS, with the core merchandise gross margin, excluding fuel and currency effects, rising by 28 BPS.


Barclays has remained a stalwart in the banking and financial services industry. With a rich legacy and a diversified range of offerings in retail, investment banking, credit cards, and wealth management, Barclays has weathered various market fluctuations and economic challenges. This report aims to evaluate the current standing of Barclays as an investment opportunity. Through a comprehensive analysis, this report will advocate for investors to consider
SELLING/NOT INVESTING in Barclays stock due to loss indicators, poor market position, and improficient management and practices.
One blemish on Barclays’ current trend was the fall in share price of up to 7.1% in late October, Quarter 3 revenue missing consensus by 1%, while costs were higher than expected. Through researching the cause for this fall and corroborating with the investigations of other analysts, I concluded that the revenue miss was driven by the UK and CIB. Barclays CIB is considered by the market as very volatile, especially as 70% of Barclays capital is tied up in CIB (The Fly). With a revenue miss caused by CIB, which is already considered quite volatile, there isn’t enough security in investing in BCS at this time.
UK NIM is worth 2.7% of profit before

taxes, and with a cut in the 2023 NIM guidance to 3.05-3.1% from 3.15%, coupled with a 5% revenue miss in the investment bank (2% at group level), it will likely lead to cost-cutting measures and downward revisions of revenue estimates into 2024 (Muñoz). With an expected decrease in costs and a consequent decrease in revenue, investing in BCS doesn’t have the most profitable outlook.
In 2021, after the lockdown caused by the Covid-19 pandemic, the Barclays’ ROE hit a 4 year high of 11.2%, a 297% increase from the previous year. Since then, the ROE has declined, and is estimated to fall to 8.23%, a -7.54% growth from 2022. In addition, a drop in RoATCE sheds light on profitability and efficiency concerns. The decrease in RoATCE suggests that Barclays may be grappling with challenges in optimizing its capital structure amidst the changing economic environment. With interest rates rising over the past years, investors anticipated higher returns on equity, making the decline in RoATCE even more concerning.
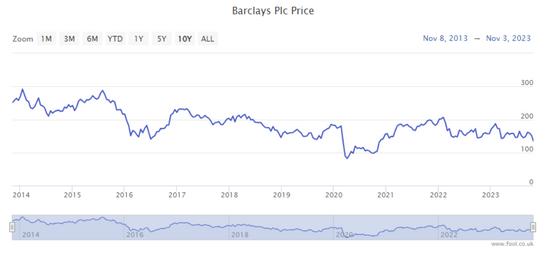
Unlike many of its industry peers, one of Barclays biggest flaws has been its long term lack of success. After

reaching approximately 350p in October 2009, it's evident that the trend has been consistently downward. This poses a challenge for investors focused on generating income. Simply collecting dividends over the years becomes futile if the investment's value continues to decline, as it negates the gains made through dividends.
Having a smaller market share than other companies in its industry puts Barclays at a competitive disadvantage, as the company can and has been unable to offer the same services as bigger banks. This competitive gap can lead to slower revenue growth and limited profitability. Moreover, Barclays' smaller market share indicates a limited ability to weather economic downturns and absorb losses. In times of financial instability, larger institutions with diversified portfolios and substantial assets are better equipped to navigate challenges.
“Bragar Eagel & Squire, P.C…announces that a class action lawsuit has been filed against Barclays PLC…on behalf of all persons and entities who purchased or otherwise acquired Barclays securities between July 22, 2019 and October 12, 2023” (Business Wire). This is because the defendants made false statements about former CEO Jes
Staley’s close relationship with latecriminal Jefferey Epstein. This lawsuit could very likely play a role in the public's perception of the bank, hence devaluing the investment.
Leading off the last note, since the resignation of Staley, C.S Venkatakrishnan (Venkat) took the role CEO, and hasn’t been very specific nor open about future goals of the company. “What investors have got from Barclays… was a leak that strategy consultants from Boston Consulting Group had been hired but with scant detail of what they were looking for… Barclays was considering options for its payments business; and finally, at thirdquarter results last month, a warning that the bank might take a chunky restructuring charge in the final quarter of the year” (Davies). The last part of the statement is what sticks out the most. It is simply just bad news, with no specifics of what the restructuring charges will improve upon, and no positive outlook for Barclays in the coming periods. Managers lacking transparency and strictly delivering negative news, like anticipating increased costs for the upcoming quarter, undermine the company's investable benefits.


Berkshire Hathaway is a company with long term reliable growth potential and a compelling buy. The company entails competent management under the guide of Warren Buffet and his partner Charlie Munger. They propelled Berkshire Hathaway into one of the largest holding companies utilizing value investing strategies popularize by Benjamin Graham. Berkshire Hathaway represents a powerful reputation as a company with reliable management and excellently applied value investing philosophies. To support my reasoning of Berkshire being a ‘buy’, the report will be divided into 2 sections, fundamental analysis and technical analysis.
Berkshire Hathaway’s company model rests on its dependable philosophy to acquire ‘cheap’ companies in comparison to their intrinsic value. The theory of value investing states that there are discrepancies between the trading price of an equity and the company’s ‘intrinsic’ value. Taking advantage of this discrepancy can produce large financial gain as the value of the company eventually will come to its intrinsic value based on market equilibrating tendencies.
Berkshire Hathaway has a history of acquiring companies or being a large minority stakeholder of corporations

with competitive advantages and reliable growth potential. Through the company’s large cash reserve (currently over $150 billion), Berkshire Hathaway can acquire companies which has the same effect of holding a portfolio with various income streams from capital gains or dividends. Warren Buffet’s remarkable record of financial success, consistently outperforming the S&P 500, is a part of the appeal for the stock as people vest their trust into their superior management.
Buffet’s strategic allocation of company resources also has the advantage of hedging the inevitable vicissitudes of the market. This large cash holding and distribution of cash and equities also has the effect of being a safer pick as it mimics a mutual fund with investments in various industries along with cash holdings. Buffet’s methodology for determining the businesses he invests in are derived from long term competitive advantages with robust financial figures. A fundamental uncertainty is the dubious managerial situation, namely Warren Buffet’s imminent need for a successor. It is highly uncertain if Greg Abel, the company’s successor, will possess the same ability to identify value opportunities within equities.
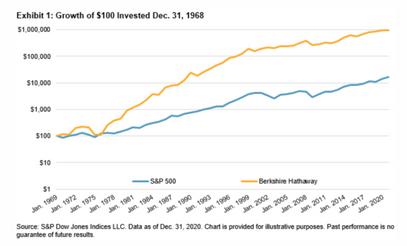

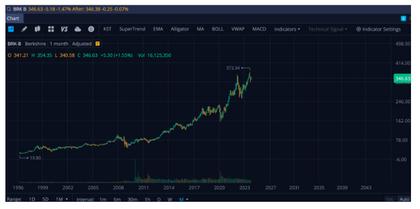
Berkshire Hathaway’s price reflects a discount to its fair value and can experience a safe investment for long term growth. The company possesses a Price earnings ratio of 8.85, indicating that for every $8.85 dollars invested, $1 is returned in the form of earnings. Additionally, Berkshire Hathaway’s Debt to Equity ratio is 0.88 indicating healthy financing and not over leveraged. The monthly candlestick chart also represents a holistic view into the company’s ability to recover from downturns as seen after a significant drop during the Covid pandemic, in which it rapidly recovered throughout the year to an all-time high. This is a testament to Berkshire Hathaway’s ability to endure downtrends and recover to record highs.
It is often said that Buffet’s strategy is outdates as he appeals to older industries such as insurance and consumer staples, rather than tech stocks which have seen rapid growth in the recent years. A little less than half of Berkshire Hathaway’s entire equity portfolio is composed of Apple (AAPL) which captures massive amounts of value in the tech sector, exposing the entire holding company to a concentrated technology company. Berkshire Hathaway does possess a particular concentration in the consumer products industry, making up approximately 57% of Berkshire’s entire
equity holdings, which depends on consumer confidence and overall macro strength. Therefore, there is a perpetual need for consumer strength to exist and increase year over year for Berkshire to grow its portfolio and ultimately the company. Regardless, the backbone of Berkshire Hathaway’s operations is the insurance sector, owning Geico outright, generating earnings of $2.4 billion and constituting 30% of its entire operations.

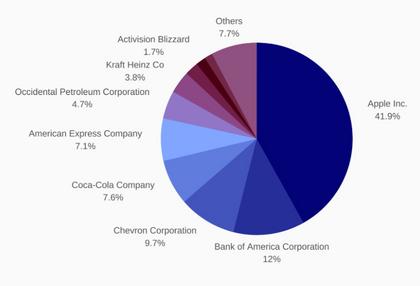
Conclusion: Berkshire Hathaway’s superior foresight and persistent devotion to value investing principles has led them to reach unparalleled growth from their equity positions. Under the leadership of Warren Buffet and his imminent successor Greg Abel, the company’s value is derived from their trust and managerial competence within identifying value opportunities and subsidiaries. Ultimately, Berkshire is a reasonable price with impressive financial ratios and ability to endure financial downturns, with the priceless benefit of superior management.


Cummins will continue to keep its position as a global leader in commercial vehicle manufacturing due to its strong ties with suppliers and customers. It is tied within the trucking industry as most customers produce trucks from Cummins’s engines to meet the world’s logistical demands. Its largest long-term risk, overconsumption of oil, is being mitigated by the development of Accelera, which requires high short-term R&D costs. Presuming that the economy does well, and Cummins does not experience any internal issues, it is positioned to remain a leader in the commercial vehicle manufacturing industry. So I am pitching a buy.
Cummins Inc (NYSE: CMI) is a commercial vehicle manufacturer that specializes in diesel engines for heavy machinery, as well as electrical power equipment manufacturing through diesel generators . Cummins also produces engine components to complement their engine division and keep their customers’ engine fleet well maintained. Cummins is looking forward to expanding into the zero-emissions power energy generation industry through its newly founded Accelera subsidiary. Accelera is working on its mission of decarbonization by developing electrolyzers and hydrogen power (Accelera, 2023). Cummins

makes 30% of its sales each from its engines, distribution, and components divisions respectively.
Cummins’s suppliers are in the automotive competent and electronics industry, which include Cummins India (14.62% CAPEX), Tenneco Inc (1.52% COGS), Komatsu Ltd (1.28% CAPEX), Forvia SE (1.18% COGS), Automotive Axles Ltd (.99% COGS), and others. Cummins’s customers are in trucking, vehicle, and industrials industry, which include PACCAR Inc (16% of revenue), Daimler Truck Holdings (7.29% revenue), Traton SE (7.11% revenue), Stellantis NV (5.59% revenue), Komatsu Ltd (2.14% revenue), and others. Cummins competitors include Aisin Corp, Akasol AG, Caterpillar, Allison Transmissions, BYD Co Ltd, etc.
Cummins Supply Chain

Cummins is a mature commercial vehicle company that is stable on the market as it has a beta of .92. This is particularly due to Cummins having a solid financial and a reliable customer base, which will be discussed later in

this report. There are only a few catalysts that significantly influence Cummins’s valuation: Trucking, energy, and company financials.
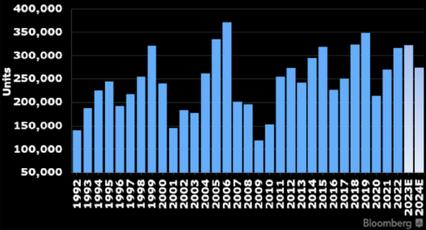
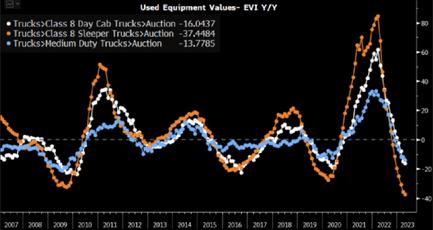
Most of Cummins’s revenue comes from the trucking industry, which has been doing well for the last 5 years, excluding 2020. However, the trucking industry is expected to shrink significantly as truck builds may drop around 25–30%. Used truck prices are also on the decline, which is an issue for Cummins as customers will be incentivized to purchase used rather than new, decreasing EBITDA. Trucking is always needed, and the decline will take around ten years, which is sufficient time for Cummins to respond.
The energy industry is a large industry that Cummins has dependency on for its long-term sustainability. Specifically, oil, gas, & hydrogen power are of significant influence on
Cummins. Cummins engines are fueled by diesel, which is dependent on crude oil prices, providing some volatility. Outlook on crude oil is grim as companies want to loosen their dependency due to high prices and shrinking global supply (See figure 1.3) (Hubbert’s, 2023). Despite this concern, Cummins is positioned well within the crude oil market as there is no substitute for diesel engines yet.

Company financials are the easiest variable to control for Cummins as they are responsible for maximizing shareholder equity. Company financials have large movements on Cummins’s valuation as the company is very stable and any outside factors apart from the ones discussed above are not very influential. Investors watch closely during quarterly earnings to see what the company is doing and if they should be worried as they expect stable returns. If the economy is stable and Cummins works to innovate in the commercial vehicle and energy production sectors, it should not be a short-term issue .
Cummins Competitive Advantages: R&D, Engines, and New Energies.
Cummins has maintained a strong lead in the commercial vehicle engine

manufacturing industry for over a century and will continue to do so in the next five years by leveraging the following competitive advantages: results-driven R&D, great engine manufacturing, and its development of new energies.
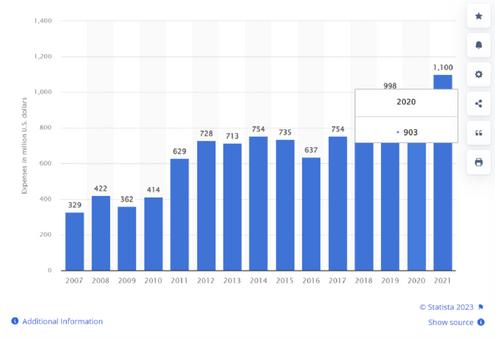
Cummins has remained the leader due to constant innovation from their everincreasing R&D costs over the following decade. Their R&D costs for 2021 were $1.1 billion, which is a large amount considering that Cummins’s engines are already established and reliable. Despite their security in the engines market, Cummins continues to increase their R&D costs due to the long-term decline in diesel engines due to increasing greenhouse gases. As such, Cummins needs to find the next alternative to their main business model, else a significant decline in market share could occur in the long run. However, they have been making progress on moving away from diesel as they are developing hydrogen and electrolyzers through their Accelera subsidiary. This puts them ahead of their competitors to transition from fossil fuels to clean energy.
Cummins’s engines are known to be extremely reliable and top of the line in the industry due to their high R&D costs. Its customers are beyond satisfied with Cummins as they
continue to purchase engines from them and have not switched over to other competitors. This is expected to continue as Cummins’s puts great effort into their engine components division. Major customers include Stellantis (from Dodge), Daimler, Paccar, and Traton, which are unlikely to switch to another competitor. This is especially true since the commercial vehicles they produce entirely depend on the engines that they are assembled with. If a commercial vehicle has a bad engine, it will not sell, thus decreasing earnings (and valuation) for that company significantly.
Development of new energies has placed Cummins ahead of the curve in their competition as the long-term consensus on the commercial vehicle industry (with fossil fuels) is on a decline. Competitors are not putting enough effort to switch to renewables, which will disallow them to thrive on the new market. Accelera is positioned to replace Cummins’s engine division in the long term, which may be even larger as Cummins has great relationships with energy manufacturers and the need with commercial vehicles will be there. The slow progression in growth of Accelera and the slow decline of fossil fuels complement each other well.
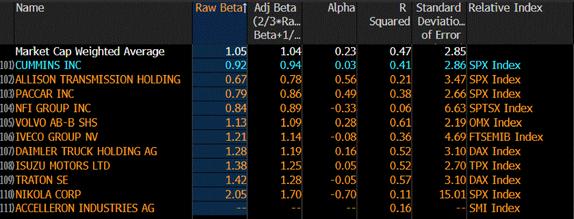
As previously stated, the commercial vehicle industry is not a volatile industry as demand is constant and trucking is crucial to the U.S. economy. Cummins’s beta is .92 percent, which means that Cummins goes slightly against the market in terms of volatility, which is stable. The

industry beta is 1.05, which is .13 higher than Cummins. This means that Cummins is more stable than the industry average, which is great as a hedge to downturn market times.
This low beta is possible due to the stable industries that Cummins serves in. Trucking is needed whether the market is bull or bear, so profits do not decline as much and thus have low volatility. This stability can be seen during the pandemic, as in 2020 there were plenty of supply chain constraints. However, Cummins only lost 37% of its valuation from its peak in Nov 2019. Despite the decline, it increased 88% YTD as the trucking market recovered and has remained strong since but is on the verge of declining soon.
Forecast:
To understand how well Cummins will do in the future, a Porter 5 Forces analysis is needed.
Threat of New Entrants:
Cummins has low threat of new entrants as the commercial vehicle engine manufacturing industry has a high barrier to entry. High R&D costs (as typical of Cummins) are desired, which a new entrant would not be able to incur. Additionally, customers seek engine reliability and great service, which is difficult for a new entrant to replicate. Decades are needed to
create the experience Cummins has created for their customers, so it is unlikely that a new entrant will attempt to take market share from Cummins.
Buyer Power:
Cummins has low buyer power as there are only a few industrial companies that can match Cummins’ engine manufacturing. There are a few players in the commercial vehicle engine industry, which means buyers have less options of where they can purchase their engines from. Its customers are also happy to do business with Cummins and keep coming back to do more business. Thus, Cummins has a strong grasp on its customers. In the short term, customers will remain loyal. However, in the long term, customers will be forced to switch to other energy providers as fossil fuel dependability decreases. However, this is a slow change which Cummins is combating with Accelera, which should allow Customers to keep their customers.
Substitute Power:
Cummins has low substitute power as there is currently no other engine (or power source) than can replace the torque, efficiency, and reliability of Cummins’s diesel engines. This is great for Cummins as they can keep their EBITDA growing while decreasing the threat of new entrants simultaneously. That is for the short term however, as fossil fuels are slowly replaced by electric or hybrid power sources. In the long term this is the largest risk for Cummins, but Accelera combats that once again. For the time being, diesel engines are essential, thus Cummins will maintain their position as the industry leader.

Supplier Power:
Cummins has medium power over suppliers as Cummins greatly depends on its small number of suppliers to keep operating. Since commercial vehicle manufacturing has high barrier to entry due to high setup costs, there are only a few suppliers operating. As such, Cummins is unable to greatly negotiate terms as Cummins is forced to purchase from them. However, Cummins has great relationships with their suppliers and customers, so the decreased competition (leading to high prices) is not much of a concern. However, if those relationships are severed, there will be an increase in Cummins’s operating costs.
Cummins has a lot of power over its competitors as Cummins has competitive advantages that its competitors do not have. Competitors have not been able to create a great reputation and relationship between their suppliers and customers. Its competitors also understand that the industry will shrink in the long term, but they have not done as much as Cummins to switch to renewable energies. However, Cummins’s business plan change will bring in new competitors that were once eliminated, which may then lower its power over rivals significantly. Despite this threat, Cummins should have a great shot at switching industries and becoming the new industry leader.
Cummins Operating in an Attractive Industry:
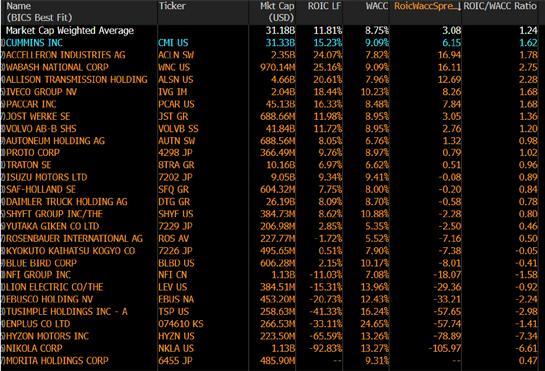
Cummins has a ROIC of 15.23% and WACC of 9.09 %, which means that Cummins has a positive spread of 6.15%. The spread indicates that Cummins is
creating value for the firm as it is making a positive return on its invested capital. The commercial vehicle industry has an ROIC of 11.81% and WACC of 8.75% , giving it a 3.08% spread. This spread indicates that the commercial vehicle industry is profitable and an attractive industry to get into. Cummins’s spread compared to the industry is 3.07%, which is almost twice as much as the industry spread. This means that Cummins is overperforming the industry in terms of return by investment. It can be attributed to the high R&D costs that Cummins is currently enduring with their engines and Accelera subsidiary. A high spread for Cummins is surprising as an already mature company is difficult to have a high spread. However, Accelera is a large move into the future, thus justifying the high spread, and its spread has potential to be higher in the future.
Recommendation for Cummins is at a buy with a target price of $256.11 due to its stability with the commercial vehicle industry and economic forecast. Cummins is expected to provide a return of 16%, which is higher than the 10% average return of the S&P 500 (Royal, 2023). As such,

an expected return of more than 10% is considered a buy, which in this case meets the criteria. Cummins is also rated a buy due to its minimal risks: Its largest risk is the trucking industry underperforming, but it is expected to recover and then gain some. The economy is expected to perform neutral, but if it rallies for any external factor, Cummins will greatly benefit. Despite these risks, Cummins operates in a stable industry as, even with the lack of sales, it can provide income by maintaining already established trucking fleets through its replacement parts division. Cummins has a great relationship with its suppliers and customers, and thus will remain stable and is a recommended buy.
To forecast the valuation of Cummins, a target model was built based on the Asis, Bear and Bull models. The As-is model suggests that Cummins is worth $215.64 per share based on a revenue growth rate of 8.9%, EBITDA of 14.5%, inventories of 20%, other long - term assets of 17.1%, and the growth rate of 9.08 %, all else being equal. This provides the backbone for the rest of the models, which for the bear and bull model provides a forecast value of $173.02 and $315.76 per share respectively. The target model ranges between the per share valuation of the bear and bull model, which provides a target share price of $256.11.
This is achieved due to the following changes: Revenue growth rate of 8.9% to 8.8%, EBITDA of 14.5% to 15.5%, inventories of 20% to 22%, other longterm assets of 17.1% to 16%, and growth rate of 9.08 % to 9.10%, all else being equal.
A decrease in the revenue growth rate
of 8.8% is due to the decrease in trucking demand due to the expected decline of 25% in truck builds. This is expected to recover, which neutralizes demand but decreases revenues as orders decline for a moment.
An increase in EBITDA of 15.5% is due to the economy not being expected to rally and only strengthening slightly due to current high interest rates and the possibility of a minor recession. Despite the neutral economic forecast, trucking is expected to stabilize and then increase in demand, which will keep increasing Cummins’s profitability as they can charge slightly higher prices.
An increase in inventories of 22% is due to the short decline in demand for trucking builds, which will make engine sales struggle in the short term, which means moving inventories will be challenging. Demand for trucking is expected to recover so the change in inventories is not large. However, the economy not being as strong will affect inventories as well by making financing for new trucks difficult due to high interest rates.
A decrease in other long-term assets of 16% is due to Cummins’s subsidiary Accelera: It is a long term project that is expected to lose capital due to high R&D costs to transition away from diesel engine production into cleaner energy production. It is Cummins’s biggest cost factor, but it is expected to be a worthwhile investment in the long term, thus this decline should not be of worry.
A slight increase of the growth rate to 9.10% is due to the economy forecast being slightly positive. As stated earlier, the economy is not expected to rally due to high interest rates and

a possibility of recession, but will most likely recover, though it remains a current challenge for Cummins.

Cummins has the following risks: Economy, Trucking, and Accelera.
The economy has high uncertainty as treasury yields are high and many world events have influenced the economic strength of the U.S. As such, Cummins can do very well if the economy rallies throughout 2024. However, if the economy tanks, Cummins will lose profitability and revenue, and this will decrease. Cummins’s valuation largely depends on how the economy will perform throughout 2024.
Cummins mainly depends on the trucking industry for sales as most of its customers are truck manufacturers. The trucking industry is positioned to shrink due to decreased manufacturing of new trucks. It could last longer than expected depending on how the economy does as the economy influences trucking volume, and thus demand for new trucks. However, truck
builds are expected to recover and increase slightly, but the risk remains.
Accelera:
Oil production is expected to decline significantly in the following decades due to overconsumption of crude oil, a decline shown by Hubert’s peak oil production model. As such, Cummins is developing newer energy sources to mitigate this long-term risk. In the short term, however, there will be high R&D costs, which may increase more than expected to compete with other energy manufacturers. It is a small risk, but one that can build up over time and eat into net income significantly.


Sherwin-Williams is a large cap materials company focused on manufacturing, distributing, and selling various paints, coats, and other industrial and commercial products.
Sector: Materials
Market Cap: $70.60 billion
Exchange: NYSE
Ticker: SHW
Investors should buy Sherwin-Williams stock due to their impressive growth indicators, reliable management team, and safe financial position.
Thesis: Sherwin-Williams is experiencing consistent and reliable growth, reflected in its ever-increasing earnings per share value, rising annual revenue targets, and its expansion of the number of stores operated. Sherwin Williams is primed for future expansion and growth.
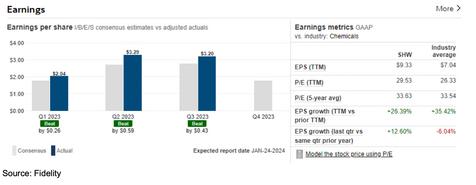
Sherwin-Williams is routinely overperforming relative to analyst EPS predictions, as they consistently beat their competitors and Wall Street predictions. Sherwin-Williams has beat

the first three earnings per share predictions in 2023 by large margins. I expect Sherwin-Williams to continue to outperform and beat their Q4 2023 EPS prediction on January 24, 2024. Sherwin-Williams consistently beating EPS predictions highlights high shareholder value, market confidence, and reliable profitability. I expect Sherwin-Williams to continue their EPS growth moving forward.
Sherwin-Williams has systematically increased their annual revenue every year since 2018. Sherwin-Williams revenue has never stagnated even with large-scale global supply chain issues deriving from the Covid-19 global pandemic. I expect Sherwin-Williams to continue to increase their revenue, as they are aggressively adding new stores yearly. Sherwin-Williams revenue growth is consistent and reliable and I expect future positive revenue growth.


Sherwin-Williams is growing in both the number of stores operated and YoY growth in existing stores. SherwinWilliams is expanding throughout the United States and abroad by building roughly one hundred new stores annually. This is good news in addition to their current stores growing in YoY sales. Existing Sherwin-Williams stores sales grew at an astounding rate in 2021 at 122.22% and 95% in 2022. I do not believe they will be able to continue this rate, but I do expect a roughly 15-20% growth in existing sales going forward. The materials sector is always consistent as there will always be companies and individuals who need paint, coatings, or another product they offer. I expect Sherwin-Williams to grow in both new net stores and same store sales YoY growth in the near future. SherwinWilliams will continue to hold onto their massive market share for the foreseeable future.
Sherwin-Williams is extremely stable and well-respected due to their reliable management team, which has allowed them to excel and outperform their competitors,
Sherwin-Williams has stable management anchored by John Morikis, who has been a fantastic CEO for roughly eight years for the company. Morikis has navigated the company through tough financial markets, increasing competition, and most recently a global pandemic.
Sherwin-Williams recently just announced that Heidi Petz will be their new CEO starting January 1, 2024. I expect Petz to continue to make good decisions for the company as she was an inside hire who most recently was the Chief Operation Officer. The rest of the management team at Sherwin-Williams is also reliable with most of them having stock in their company, thus illustrating trust in the company. I believe the board and the company overall have a good vision and plan for where to go in the future. Sherwin-Williams will continue to dominate the materials sector in large part due to their management team.
Sherwin-Williams has a market cap of 70 billion dollars, which is far and away the highest in the sector. No competitor compares to SherwinWilliams in scale, which is a massive benefit for them. Companies in the material sector have very similar products, so most of the time companies and individuals will choose Sherwin-Williams simply because it’s the largest. Sherwin-Williams will continue to hold their large market cap, as they continue to dominate the sector.
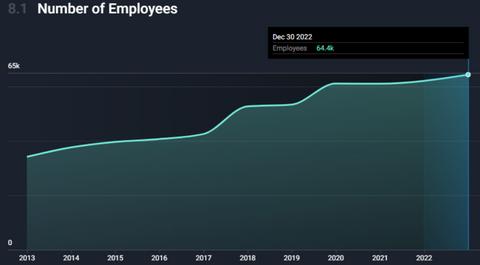
Sherwin-Williams is consistently regarded as a fantastic place to work. They have increased the number of employees every year since 2013, even when other companies have had several mass layoffs. They also have been increasing their ESG and sustainability scores in recent years. Sherwin-Williams is a good place to work, which will help them attract

productivies workers and make the business competitive compared to other materials companies.
Sherwin-Williams is in a fantastic financial position and is primed for future success.
Sherwin-Williams has a gross margin of 46.61% and an EBITDA margin of 18.35%.
These values are extremely high and higher than their competitors. SherwinWilliams will likely continue to have similar margins, as they kept their margins stable even through a global pandemic. Sherwin-Williams margins highlight sustainable profitability and financial stability.

Sherwin-Williams has more assets than liabilities which allows them flexibility. The company is taking on tons of debt to facilitate growth, but they have shown they can pay off that debt without straining their balance sheet. SherwinWilliams has a good ratio of assets to liabilities and will be able to withstand tough financial times if they
were to come in the future.

Sherwin-Williams was founded in Cleveland in 1866. But, since then it has grown tremendously and now has operations in the Caribbean and across Europe and Asia. Sherwin-Williams is a well-known global brand for paint and will continue to service customers across the world for the foreseeable future.
My price target for Sherwin-Williams is $270 by the end of 2024. This is around the consensus average price target from key analysts listed on Bloomberg.
Sherwin-Williams beta is 1.08, which means it is likely to have some short term fluctuations. But, in the long run Sherwin-Williams will yield positive returns for investors who hold steady.
Buy Sherwin-Williams stock at its current price of $250.91 (as of 11/4/2023), as it is primed for future growth and will yield positive returns.


Adobe is a computer software company that is known for services related to photo editing, graphic design, video, and document control. Several catalysts have ensured that ADBE stock is likely to increase in the long-term. Recent innovations and implementations of artificial intelligence, as well as product price increases have played a large role in company growth. Due to the company’s competitive stance, indicators of share growth, and operational advantages, investors should certainly purchase ADBE as a long-term, profitable investment.
Adobe’s various products of digital software have extreme competitive advantages. Its digital cloud features are increasing in revenue and with integrations of generative artificial intelligence, they show no signs of slowing down.
Products such as Photoshop and Acrobat give Adobe pricing power that can sustain a non GAAP operating margin of approximately 45% in the long term.
With the increasing utilization of artificial intelligence in various software portfolios. Bloomberg analysts believe that integration of generative AI can add over $1 billion to Creative Cloud, which has become essential in today’s technological innovative world. Artificial intelligence integrations should

drastically improve Adobe’s already efficient and highly-used software.
Adobe saw a major line chart jump in Q2, achieving company-record Q2 revenue. There is strong demand for Adobe’s Creative Cloud, Experience Cloud, and Document Cloud, especially with the recent surge of generative artificial intelligence in software industries.

Consistent year-by-year increases in EPS, revenue, and segment revenue exhibit Adobe’s long-term success. These serve as indicators of growth, especially when considering the mass use of artificial intelligence and price increases in November of 2023.
Year by year EPS growth shows continuous profitability in owning ADBE stock. This constant growth is a surefire indicator that ADBE should remain a successful investment throughout the next few years and in

the long-run.
Year by year revenue growth also indicates continuous profitability and income for the company, ultimately resulting in the success of ADBE shareholders. Continuous revenue growth, along with advancements of features with artificial intelligence, should ensure overall profitability in the long-run.
Increasing year by year segment revenue in different company features demonstrates Adobe’s consistent growth. Adobe has increased revenue from its digital media features such as its creative and document control applications, as well as its cloud subscription and other features of digital experience.
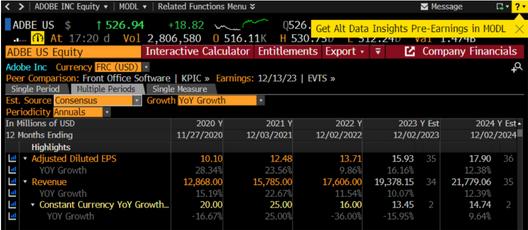

Long term gross profit/margin growth and operating income/margin have remained resiliently profitable despite higher costing operations. As generative artificial intelligence becomes a key factor in Adobe’s upcoming software updates, it is impressive that the company’s gross and operating
income/margins remain high.
Throughout the past few years, we have seen consistent growth from Adobe’s adjusted gross profit. With a sizable estimated gross margin of 89.14% in 2024, and while gross margin may be slightly down at times from year to year, we still see very steady increases of gross margin within a span of 3 years.
Despite the newer and high-expense innovations in AI, adjusted operating margins of 46.3% were up 220 bps compared to last year. This signifies high strength of Adobe’s operational costs, as more costly operations are still leading to high profitability.
Operating income increases from year over year signify high operational advantage. Adjusted operating margins have also increased over a long term period, sitting around 45%. Adobe has generated increasing operating income, while maintaining strong operating margins, all while integrating highercosting procedures.
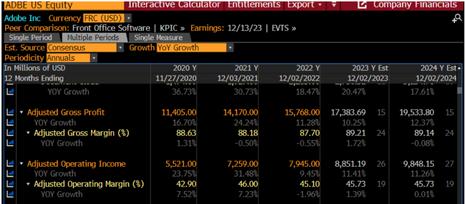


Whether you want to join as a student, faculty champion, or corporate partner, reach out to us by using the contact information below!
Website
https://bit.ly/3VbnXI7
Email smithequityresearch@gmail.com
