UFOP REPORT ON GLOBAL MARKET SUPPLY 2022/2023
in relation to supply in the food and feedstuff markets


ZUR FÖRDERUNG VON OEL- UND PROTEINPFLANZEN E. V.
UNION

in relation to supply in the food and feedstuff markets
Global supply of food is not a question of availability alone. The updated issue of UFOP’s Report on Global Market Supply 2022/2023 once again confirms that per capita supply of grain and vegetable oil is basically sufficient to feed the world’s population. However, the war in Ukraine has shown that the question of reliable supply chains is equally important. Whereas the shortage of vegetable oil, in particular in Germany, was more relevant in terms of the attention it got in the media, supply of affordable wheat from the Black Sea region is an absolute necessity to avoid hunger and maintain social peace in affected African countries.
We do not know how long the war will last. However, action is required to secure supply in the affected countries, also and especially in acute emergencies. It is not certain that gaps in demand can be covered by the market alone, especially since prices for staple foods (cereals) are expected to rise sharply at the retail level.
The worsening situation in some regions because of climate change and wars should provide the impetus to make affected import countries as least dependent as possible by directly improving cultivation, harvest and storage. It is the fundamental task and responsibility of the rich countries especially to provide the financial resources and consulting capacities needed to this end. This is a race against time that must be won.
Moreover, there is a question as to whether emergency reserves should be built up to ensure that aid can be provided as and when needed by, for example, delivering wheat straight from wheat reserves in an emergency situation. In the case of fossil energy sources (gas and mineral oil products), legislation in Germany and the EU requires stocks to be available for cases of emergency. An analogue strategy of stockpiling should also be created for specific agricultural products, especially because climate-related risks (dryness/flooding) are increasing.
The current issue of the Report on Global Market Supply once more confirms that the available quantities are sufficient to ensure a basic supply worldwide and also to maintain emergency stock levels (food stockage). In order to maintain this level of supply and given the now eight billion people living on earth, technical progress needs to be utilized. Developing climate-resilient and pest and disease-tolerant or, at best, resistant crops is imperative. New breeding techniques such as gene scissors (CRISPR/Cas) will have to be applied to meet the challenges facing us. Preventing technical progress that would ensure food production is ethically unacceptable. The European Union actually goes even a step further, which is inexplicable to us. With its “Farm to Fork” strategy, the EU pursues an extensification policy by imposing rigid reduction requirements on means of production in one of the world’s most favoured regions. The smaller harvest volumes aimed for by politics will cause prices to rise steadily, since the European Union might well be providing correspondingly smaller volumes of grain for export.
Policymakers are now urgently called upon to devise, in a consensual process, a development strategy that is acceptable to agriculture and combines all requirements for food supply security as well as biodiversity and climate change mitigation to the greatest possible extent. From an agricultural perspective this is the core and key challenge of the Green Deal. This Deal should leave farm successors the necessary room for development rather than regulating and governing agriculture down to the tiniest detail. After all, farmers are the ones who must, and also will, meet society’s demand for safe and sustained supply of food and feedstock for material and energy purposes. For this reason, agriculture will take a very active part in developing a national biomass strategy (NABIS).
Detlef Kurreck Chairman of the Union for the Promotion of Oil and Protein Plants e. V. (UFOP)The Union for the Promotion of Oil and Protein Plants e. V. (UFOP) represents the political interests of companies, associations and institutions involved in the production, processing and marketing of domestic oil and protein plants in national and international bodies. UFOP supports research to optimise agricultural production and for the development of new recycling opportunities in the food, non-food and feed sectors. UFOP public relations aim to promote the marketing of domestic oil and protein plant end products. (www.ufop.de/english/news)

» 1. Feedstock supply
1.1. How much grain is produced on a global scale?
1.1.1. Global grain production
1.1.2. Global stocks of grain
1.2. How much oilseed and vegetable oil is produced on a global scale?
1.2.1. Global oilseed production
1.2.1.1. Composition of the oilseeds
1.2.2. Global production of vegetable oil
1.2.2.1. Price development of vegetable oils
1.2.3. Global oilseed supply
1.2.3.1.Global vegetable oil supply
1.3. How much oilseed and grain does each continent produce?
1.3.1. Production of grain
1.3.2. Production of oilseeds
1.4. What products are made from grain?
1.4.1. Global use of grain
1.5. What products are made from oilseeds?
1.5.1. Global use of oilseeds
1.5.1.1. Global production of oils and meals
1.6. Production of pulses
1.6.1. Production in the EU-27
1.6.1.1. Production in Germany
» 2. Production of biofuels
2.1. Which countries promote biofuels?
2.1.1. Global output of bioethanol
2.1.1.1. Major bioethanol producers in the EU-27
2.1.2. Global output of biodiesel
2.1.2.1. Major biodiesel producers in the EU-27
2.2. What feedstocks are used in world biofuels production?
2.2.1. Global resource bases for biodiesel
2.3. What feedstocks are used in European biodiesel fuel production?
2.3.1. Resource bases for biodiesel in the EU-27
2.4. What feedstocks go into the production of biodiesel used in Germany?
2.4.1. Shares of feedstock in biodiesel consumed
2.4.2. Emission saving
2.5. Where do the feedstocks for biodiesel at German petrol stations come from?
2.5.1. Origins of feedstocks for biodiesel used in Germany
»
3.1. What do biofuels have to do with feedstuff?
3.1.1. Output of rapeseed meal with and without biodiesel fuel production
3.2. Why is demand for oilseeds increasing?
3.2.1. Global consumption of meat by continent
3.2.2. Blending quotas for biodiesel
3.3. What is the amount of grain/vegetable oil per person?
3.3.1. Supply per capita
3.4. Is there enough food?
3.4.1. The issue of distribution
3.4.2. Food availability and climate change
»
4.1. Does growing energy crops create a lack of land for food crops?
4.1.1. Shares of land used for biofuels production
4.1.2. Development of cropland
4.2. Is there a limit to the use of palm oil?
4.2.1. Global use of palm oil
4.3. What would protein feed supply be like if there was no biodiesel?
4.3.1. Land required for soybeans if German biodiesel production did not exist
»
5.1. Do biofuels push food prices up?
5.1.1. Comparison of prices of bread, bioethanol and grain
5.1.2. Comparison of prices of biodiesel and vegetable oil
»
6.1. Why the Ukraine war has such a big impact on the market
6.1.1. Ukraine is a key supplier to the world market
6.1.2. A lot of Ukrainian sunflower oil in the EU
6.1.3. Future plantings very uncertain
Editorial department, charts and descriptions: Agricultural Market Information Company (AMI) Department plant production
Editors: Svenja Herrmann, Nadja Pooch, Wienke von Schenck, Eike Wagner
www.ami.informiert.de
Copyright for all charts: AMI GmbH
Editorial deadline: 16.12.2022
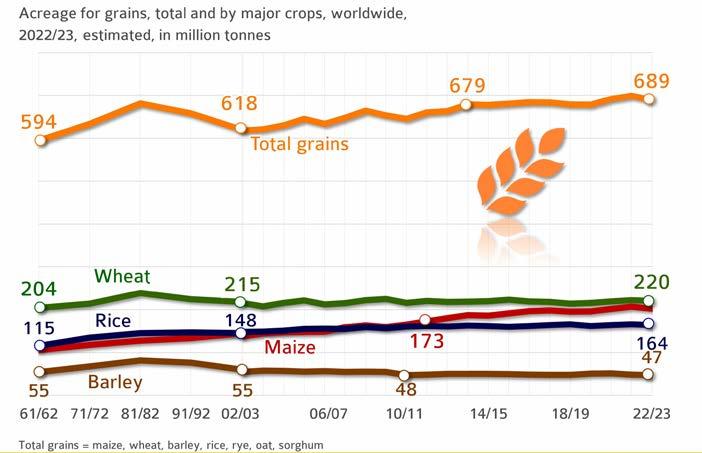
The world area planted with grain declined for the first time in three years. After a record of 699 million hectares of grain in the previous marketing year, the grain area in 2022/23 is projected at 689 million hectares. Especially the areas planted with barley and maize were reduced. More specifically, the barley area was cut by 2.7 per cent to 47 million hectares and the maize area by 2.3 per cent to 203 million hectares. The wheat and rice areas remained virtually unchanged at 220 and 64 million hectares respectively. However, it must be noted that in general, as a result of progress in plant breeding and improvement of agricultural production practices (fertiliser applications, pest and disease control, reduced losses at harvest and in storage), world grain production has continuously increased over the past decades. Since 1972/73 the output of maize almost quadrupled and that of wheat and rice more than doubled, although farmers in key producing countries of the northern hemisphere once again had to cope with drought and extreme heat. Maize is in first place, which underlines its growing global importance for supplying the animal feed sector and for bioethanol production, especially in the USA. Barley, like maize, is mainly used to feed livestock. In contrast, rice and wheat are primarily used for human consumption.
© AMI 2022 | Sources: FAO, USDA

The ratio of supplies to consumption (also called the stock-to-use ratio) is a key figure in estimating supply and, consequently, potential price trends. The lower the ratio, the faster supplies are absorbed. Also, a low ratio leads to rising prices. In 2022/23, wheat production is set to increase year-on-year, exceeding projected consumption. In other words, global ending stocks are seen to increase further and the stock-to-use ratio is set to rise for the fourth consecutive year. The projected ending stocks 2022/23 would cover up to 38 per cent of calendar year demand, a slightly stronger result than a year earlier. In the case of coarse grains, 2022/23 ending stocks are expected to decline due to a drop in production to 1,467.2 million tonnes. As a consequence, the ratio decreases to 22.4 per cent. This is the lowest value since 2012/13. It means that the share is below the long-standing average of 24.9 per cent. This may well lead to strong prices for coarse grains in the current marketing year.
© AMI 2022 | Source: FAO
In the 2022/23 marketing year, around 301 million hectares will be planted with oilseeds. This translates to an increase of just over 1 per cent over the previous year. For years now, the increase in global demand for high-quality feed protein has led to an expansion in soybean area, especially in South America. On a global scale, soybean is the number one oilseed crop, accounting for just less than 45 per cent of world oilseed production, followed by rapeseed with 40 million hectares (+ 2 million hectares on the previous year). The expansion in soybean area is considered to be one of the contributors to growing deforestation in Brazil. The EU Commission’s proposal for a regulation on deforestation-free products was approved in the trialogue proceedings at the beginning of December 2022 and now has to be implemented as of this marketing year. The requirement of a dated proof of land use for the purpose of market access has been standard practice since 2008 for the sustainability certification of biofuels from cultivated biomass – including for deliveries from third countries. The new regulation sets 2020 as the cut-off year.
Oilseed crops differ in oil and protein content as well as fatty acid composition and protein quality, along with their climate and soil requirements. These factors have a determining influence on the price of the oilseed crop in question. This especially applies to protein quality, because soybean is also the most valuable source of protein in terms of quality. For this reason, rapeseed breeders are working intensively on improving the protein quality of rapeseed. The UFOP is supporting a number of different project proposals relating to the use of rapeseed protein in animal feed and the human diet to raise this added-value potential. Some of the latest research results were presented during a UFOP conference: https://www.ufop.de/ufop-der-verband/ufop-online-fachtagung
© AMI 2022 | Sources: FAO, USDA

1.2 How much oilseed and vegetable oil is produced on a global scale?

» 1.2.1 Global oilseed production
1.2.1.1 Composition of the oilseeds
Sunflowers habe the highest oil content
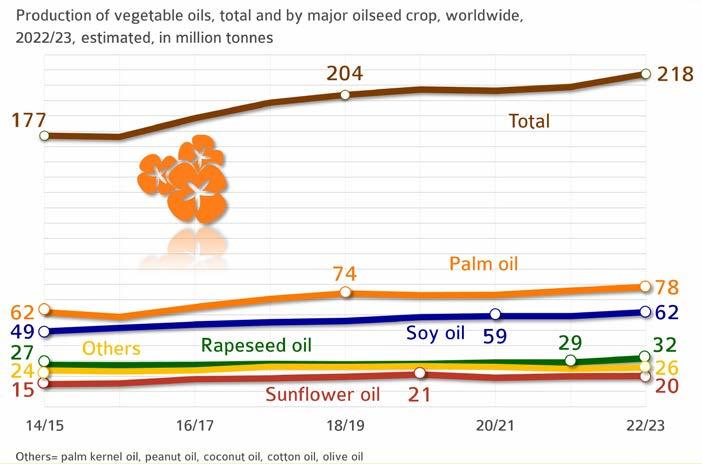
Global production of vegetable oil is set to reach new record highs in 2022/23 with all oils increasing, according to information published by the US Department of Agriculture. At the time of going to print, global production in 2022/23 was estimated at less than 219 million tonnes, up just less than 8 million tonnes on 2021/22. In other words, production will presumably fully cover demand of 213.8 million tonnes in the current crop year. Palm and soybean oil account for 64 per cent of world vegetable oil production. Rapeseed oil occupies third place, accounting for almost 14 per cent, followed by sunflower oil with just under 9 per cent of world output. Global output of vegetable oil is set to exceed the level of 200 million tonnes for the fifth year running in the 2022/2023 marketing year.
Palm oil is set to remain the most important vegetable oil, accounting for just less than 36 per cent and with an output of approximately 78.2 million tonnes, a rise of 2.3 million tonnes compared to 2021/22. Indonesia remains the largest palm oil producer with an output of 45.5 million tonnes, followed by Malaysia with 18.8 million tonnes and Thailand with 3.3 million tonnes. Production of soybean oil is expected to rise 4 per cent to a new record high of 61.9 million tonnes based on bigger harvests. China, the most important importer of soybeans in the world, remains the primary soybean oil producer with production amounting to 17.2 million tonnes, whereas the US ranks second with 11.9 million tonnes. Production of sunflower oil will probably increase only 1 per cent to 20.1 million tonnes due to smaller harvests in Eastern Europe and the EU-27. On the other hand, global rapeseed oil production is seen to rise 9 per cent to 31.7 million tonnes based on strong global rapeseed supply. Palm and soybean oil account for 64 per cent of world vegetable oil production. They are followed by rapeseed oil, accounting for 14 per cent, and sunflower oil, accounting for just over 9 per cent.
The situation on the vegetable oil market had already been tense the previous year, but worsened in the wake of Russia’s invasion of Ukraine. The uncertainty about opportunities and volumes of exports of agricultural produce from Ukraine shook the market and led to unprecedented price increases. Sharply rising energy costs and issues in relation to logistics, especially in Germany as a consequence of low water levels in the major rivers that hampered water transports and drove costs up, added to the hike in prices. Consequently, vegetable oil prices climbed, but they did not maintain the high level. Only the prices of soybean oil have firmed since the summer due to the unsatisfactory harvest in the US. Nevertheless, vegetable oil prices are well in excess of the previous year’s level.
The current development of prices of oilseeds, but also grains, in the EU-27 reflects the sharp increases in prices for means of production such as fertilisers and fuels. This level of producer prices will be the backbone required for future crop farming that is both cost-efficient and sustainable. The reason is that prices will have to remain at the current level or even higher due to energy and climate protection policies. This will become a dilemma for food aid organisations or countries that depend on imports.

The ratio of supplies to consumption (also called the stock-to-use ratio) is a key figure in estimating supply and, consequently, potential price trends. The lower the ratio, the faster supplies are absorbed. Also, a low ratio leads to rising prices. In 2022/23, soybean production is set to increase year-on-year, exceeding projected consumption. In other words, global stocks are seen to increase and the stock-to-use ratio is set to rise to the level recorded two years ago. The expected ending stocks in the current marketing year could cover up to 27 per cent of demand. By contrast, production of sunflowerseed is in steep decline, whereas consumption rose slightly. Accordingly, end-of-season stocks are expected to fall to only 13 per cent of demand. In contrast, the stock-to-use ratio for rapeseed is stable at the previous year’s level of 8.9 per cent. Although record soybean harvests are steadily increasing supply, demand for soybean protein for animal feed, particularly in China, is also rising sharply. Due to the steadily positive development of the economy and income in the world’s most populous country, purchasing power is increasing and so is demand for meat and, consequently, oilseed meals to feed the growing numbers of livestock.

The stock-to-use ratio for palm oil is in decline for the first time since 2014/15. It declined 0.7 per cent year-on-year. The picture is different for soybean and rapeseed oil. In the case of rapeseed oil, the ratio rose 1.1 per cent, whereas that for soybean oil exceeded the previous year’s figure by 0.7 per cent.

Global production of grain including rice is set to fall short of the previous year’s record in the current marketing year. Dryness in the northern hemisphere limited yields. The increases in South America cannot offset the decline, especially in Europe and North America. Above all, European farmers will probably harvest considerably fewer quantities of grains than the previous year. The Food and Agriculture Organization FAO expects around 2,774 million tonnes of grain on a global scale. The majority, around 45 per cent, is produced in Asia. The main reason is that Asia is the home of rice production. China is the main country of origin for grain and rice. Europe holds second position, accounting for just less than 20 per cent. North America follows close behind with 495 million tonnes, headed by the US with more than 417 million tonnes. Whereas marketing grain globally is vital for the economy of countries such as the US or Canada, China hardly offers any of its grain on the world market. The country produces most of its agricultural commodities to cover domestic demand and also needs extensive imports.

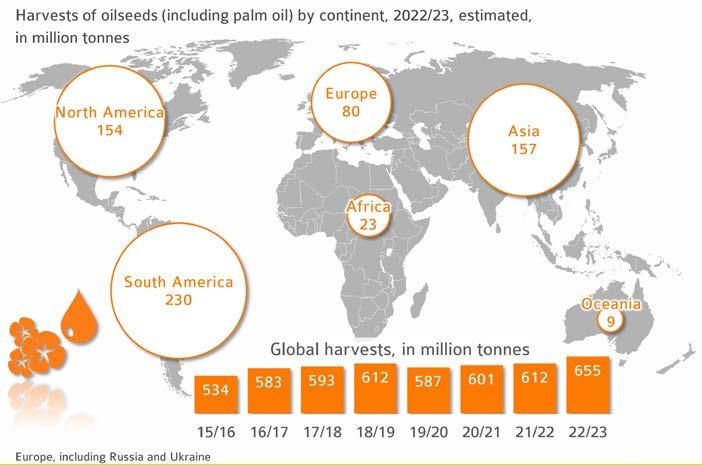
The output of oilseeds is growing rapidly. The Food and Agriculture Organization FAO estimates global production in 2022/23 at 655 million tonnes. This is up 7 per cent year-on-year and just over 30 per cent from ten years ago. The increase is primarily based on growth of output in South America, Europe and Asia due to expansion of area planted. The world’s most important oilseed and palm oil producing regions are more evenly distributed than grain-producing areas are. The difference is not so much in output as in crops grown: whereas soybean is the most important oilseed crop in South America and the US, rapeseed prevails in Canada and the EU-27 due to climatic conditions. In eastern Europe sunflowers predominate. Asian countries such as China and India produce large amounts of both rapeseed and soybeans. On the other hand, oil palm is the primary oilseed crop in Malaysia and Indonesia. This geographical distribution also “buffers” regional yield fluctuations in the interests of security of supply, for example if the weather phenomenon “El Niño” leads to yield declines in Asia or “La Niña” in South America.
Brazil is set to be the world’s largest producer of soybeans in 2022/23, ahead of the US. Canada has lost its top position among rapeseed producing countries to the EU, but moved back to second place ahead of China after the drought-stricken 2021/22 marketing year. Most sunflowers will probably be harvested in Russia in 2023, followed by Ukraine. However, there is no way to predict what implications the continued war will have on the season.
Global production of grains, excluding rice, in the 2022/23 marketing year is set to amount to approximately 2.1 billion tonnes. The produce is intended for human consumption, but also used as a livestock feed and feedstock in bioethanol production. At 48 per cent, the largest part of the grain harvests goes into feeding troughs, showing a stable trend compared to the previous year. The same holds true for food uses (just over one third) and industrial uses (just over one sixth). According to the International Grains Council (IGC), industrial uses will probably decline 0.5 per cent, especially based on lower demand for the purpose of biofuels production. The use of grain in the US, EU and China is set to shrink 1.4 per cent to 168 million tonnes and is not offset by the new increases in Brazil. This means that despite the war in Ukraine, there is basically enough grain to meet the growing demand for food and feed.
In the US, bioethanol is mostly made from maize. The process generates Dried Distillers Grains with Solubles (DDGS), which is used as a protein feed. One tonne of wheat that is processed into bioethanol produces on average 295 kg of DDGS with a moisture content of 10 per cent. One tonne of maize yields 309 kg of DDGS. When grain prices are high, processing is the first activity to go down, before farmers begin to save on feed. The high added-value potential in the food markets ensures that most of the grain goes into the production of food when grain prices are high. This means that the biofuels market serves as a “buffer” that ensures grain is constantly available for human consumption and feed.

Oilseeds grown worldwide are obtained to make vegetable oils, extraction meal and oilseed cake. Vegetable oil can be obtained by different chemical and physical processes. Before being pressed, the feedstock is heated to increase oil yield. The meal that remains after pressing is used as a high-protein feed. Consequently, the largest part of the oilseeds – just over two thirds – goes into feeding troughs and the smaller proportion – around 22 per cent – into food production. Soybean meal is the number one oilseed-based feed, with global output amounting to 249 million tonnes. It is followed by rapeseed meal, which has a share of 38 million tonnes in global protein supply. Farmers in the EU-27 only produce GM-free rapeseed. Consequently, rapeseed is by far the most important GM-free source of protein for animal feeding in the EU. Therefore, EU-rapeseed meal reduces the corresponding need for soybean imports and the acreage of land that would otherwise be required for soy cultivation. Unfortunately, this fact has still not received the necessary recognition from the EU Commission, for example with respect to incorporating the protein component in greenhouse gas accounting for rapeseed-based biodiesel or the “Farm to Fork” strategy. The amount of sunflower meal, 21 million tonnes, is twelve times smaller than that of soybean meal. Production of oil is much more important with this crop. Any meal produced is also used as animal feed.


» 1.5.1 Global use of oilseeds
1.5.1.1 Global production of oils and meals
Practical dual use of oilseeds
© AMI 2022 | Source: Oil World
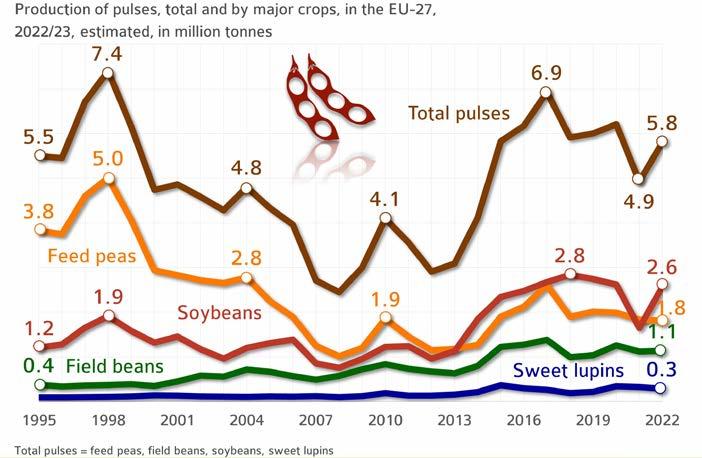
The production of legumes is gaining importance in the EU-27 in terms of biodiversity (flowering plants), climate protection (no need for nitrogen applications) and as an alternative source of protein for innovative food products. However, in 2022 summer crops in the EU strongly suffered due to extreme heat and dry conditions. Also, dry peas and field beans saw reduced hectarage, which had to give way to the boom in sunflower cultivation, whereas the sweet lupin area was slightly expanded. In 2022 the total output amounted to 5.8 million tonnes. The most important legume crop in the EU-27 in 2022/23 was soybean, which accounted for around 45 per cent of grain legume production.
Protein crops for livestock feeding purposes are in strong competition with imported soybeans and soybean meal. Considering their protein quality, the latter are often lower priced, which makes them attractive for the production of compound feeds. Nevertheless, progress in the use of grain legumes is impressive. They are the basis for the national and European protein plant strategy. The UFOP is supporting project proposals or directly involved in joint projects (https://www.ufop.de/agrar-info/forschu/berichte/ – in German only).
© AMI 2022 | Source: EU-Commission

The strong 19 per cent expansion in legume area for the 2022 harvest offsets the sub-standard yield of 30 decitonnes per hectare. As a result, 2022 output in Germany amounted to 695,000 tonnes, up around 6 per cent on year-on-year and as much as 30 per cent on the long-standing average. Soybeans are also becoming increasingly attractive, if on a regional scale and at a lower level. The area planted with legumes for grain production totalled 261,000 hectares in 2022. This translates to a 19 per cent increase year-on-year. Feed peas were the most important grain legume crop, occupying 106,600 hectares (+ 9 per cent), followed by field beans at 71,200 hectares (+ 24 per cent). The sweet lupin area rose 9 per cent to 21,700 hectares. Soybeans saw the biggest increase at 50 per cent to 51,400 hectares.
However, soybean production was at a low scale compared to other legume crops. The reason is a poor competitive position compared to imported soybean meal and soybeans respectively. As flowering plants, legumes are indispensable crops to expand crop rotations and improve biodiversity and soil fertility. What makes them so special is that, aided by bacteria that cling to their roots, they convert atmospheric nitrogen into organic nitrogen which encourages plant growth. Legumes have the potential to establish themselves in the trade as an alternative source of protein. This is a result from the UFOP conference titled “Local Heroes”. The presentations given at the conference are available (in German only) using the following link: https://www.ufop.de/ufop-der-verband/ufop-online-fachtagung/localheroes-2022/
© AMI 2021 | Sources: AMI, Destatis
Global bioethanol production reached a new high of around 118.498 million m 3 in 2021. The goals are to reduce the use of fossil fuels, contribute to climate protection and energy supply security, and support agricultural commodity prices to secure incomes. To secure market access, the flexibly applicable instrument of blending quotas (energy, volume, greenhouse gas quota) has become established worldwide. Politics thus has a direct influence on the scope of raw material cultivation as well as the national and international raw material and biofuel trade. Global consumption of grain for the production of bioethanol is falling due to smaller harvests and comparatively high raw material prices. The use of grain (especially corn) as a raw material is expected to decline by 1.1 % to 168.2 million tonnes in 2022/23. At the same time, global grain production (incl. rice) will decrease by 1.5 % to 2.3 billion tonnes, according to the IGC. In contrast, 2.2 % more bioethanol was produced from sugar cane, sugar beet and molasses.
The top bioethanol-producing country is the USA with 58.6 million m 3 and an increase of 8 % compared to the Corona year 2020. 99% of bioethanol in the USA was produced from corn, 1 % from other biomass. The second most important bioethanol producer is Brazil with 30 million m3, where 91.4 % of the raw material is sugar from sugar cane. In the EU-27, around 5.2 million m3 of bioethanol was produced in 2021, primarily from maize, wheat and sugar beet sugar.

© AMI 2022
Source: OECD
» 2.1.1 Global output of bioethanol
2.1.1.1 Major bioethanol producers in the EU-27

Production of bioethanol in the EU-27 increases
AMI
Sources: FAS, national statistics
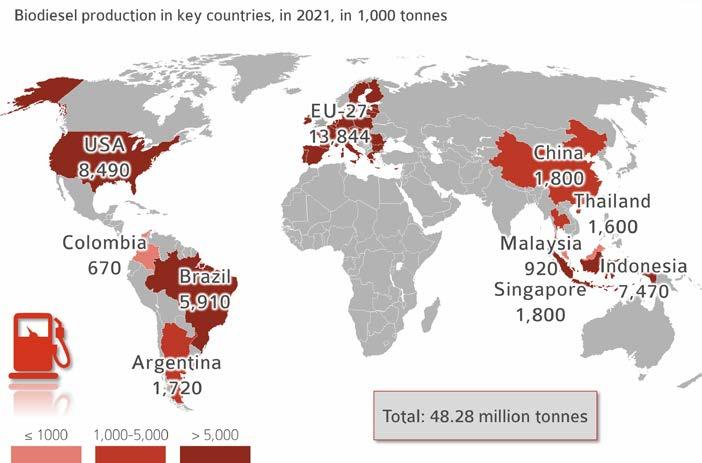
The European Union is the single most important biodiesel producer worldwide, accounting for just under 29 per cent of global output or just over 13.8 million tonnes in 2021. The term “biodiesel” is used to refer to biodiesel (FAME = fatty acid methyl ester), hydrogenated vegetable oil (HVO) and biofuels made by co-processing vegetable oils in petroleum refineries. In Europe, biodiesel is mainly based on rapeseed oil. On the American continent, it is primarily based on soybean oil, which is a by-product of soybean processing and accounts for about 20 per cent of the bean (rapeseed oil > 42 per cent of the seed) and is increasingly used in biodiesel production as a result of steadily increasing harvest volumes, especially in Brazil.
Biodiesel production is concentrated in the EU-27, the US, Indonesia and Brazil. Indonesia has gained increasing importance as one of the top palm oil producing countries. The Indonesian government pushed ahead with the quota policy in response to supply surpluses and the associated price pressure on the vegetable oil markets. The increase in biofuel blending quotas caused output to rise to 7.470 million tonnes. Contrary to the EU, by raising the national blending quota requirements (B30/B40) the Indonesian government wants to make an active, i.e. politically intended contribution towards stabilising producer prices and cutting foreign exchange spending on imports of mineral oil. By contrast, biodiesel production in Malaysia was reduced for the first time.
» 2.1.2 Global output of biodiesel
2.1.2.1 Major biodiesel producers in the EU-27

Germany remains the largest biodiesel producer in the EU © AMI 2022
Sources: FAS, Oil World
Production of biodiesel has slightly increased all over the world and, as a result, so has demand for feedstock, the use of which rose just under 4 per cent from 2020 to 2021. Although the volumes have slightly changed, the ranking has remained unchanged: palm oil accounts for 35 per cent, whereas soybean oil makes up 25 per cent, as it did the previous year. Rapeseed oil accounts for 15 per cent and animal fats for 7 per cent. The share of used cooking oil (UCO) is at 12 per cent, that of “other oils” at 6 per cent. Their shares will most probably continue to increase, because they also include effluent from palm oil mills (POME). North and South America as well as Southeast Asia are expected to see a further increase in biodiesel production from soybean and palm oil. In the EU-27, the proportion of biodiesel from rapeseed oil and waste oils and fats is expected to climb, especially at the expense of palm oil. In Germany as of 2023, biofuels from palm oil can no longer be credited towards quota obligations – as is already the case in other EU member states (France, Sweden, Austria, Belgium, Denmark, ...). It remains to be seen whether rapeseed oil will have a part in covering this shortfall, because member states are allowed to adjust the mandates for biofuels from cultivated biomass. However, due to the genetic fatty acid structure of rapeseed oil, rapeseed oil-based biodiesel has the advantage of providing better winter diesel fuel quality. In the winter months, rapeseed oil is needed as a feedstock in any production of biodiesel (FAME) for use in blends.

Availability and selling prices of vegetable and animal oils and fats have a determining influence on the use in biodiesel fuel production. Rapeseed oil remains the primary feedstock source for biodiesel production in the European Union, accounting for 39 per cent. As a consequence of higher prices and tight supply of used cooking oil in the wake of the coronavirus shutdown of the food service industry (which also had implications for imports from China), demand for rapeseed oil is expected to increase in 2023. Consequently, the proportion of used cooking oil is only 18 per cent. At the EU level, policymakers have been promoting the use of UCO, e.g. by introducing quota requirements for biokerosene (not in Germany). However, at the same time a cap of 1.9 per cent of final energy consumption in road and rail transport applies throughout the EU. With the exception of Germany, biofuels from waste oils and fats are credited double towards national quota obligations (energy-related). All member states are required to establish a binding 10 per cent share of renewable energy in the transport sector by 2021 and a 14 per cent share by 2030.

However, it must be noted that the statistical basis for the share of feedstock is very different depending on the “source” and cannot be adopted uncritically. The reporting and documentation requirements will be tightened under the revised Renewable Energy Directive (2018/2001/EU, Red II). A European database similar to the German database Nabisy will be put in place. The concrete basic statistical information necessary to measure the “iLUC effect” remains lacking to date.
© AMI 2022 | Source: Oil World

According to data published by the Federal Office for Agriculture and Food (BLE), more than a total of 3.9 million tonnes of biofuels were credited in 2021 (quota year 2020: approximately 4.62 million tonnes). These included approximately 2.72 million tonnes of biofuels (biodiesel, HVO etc.) that replaced fossil diesel. At 1.063 million tonnes in total, palm oil is the primary feedstock, followed by used edible oils and fats at 0.772 million tonnes and rapeseed oil at approximately 0.6 million tonnes. Compared to the quota year 2020, the share of palm oil-based HVO declined particularly sharply by 0.52 million tonnes to 0.3 million tonnes. This was due to the diesel fuel standard, which provides for a maximum biodiesel incorporation rate of 7 per cent by volume; above this level, HVO is used to blend mineral diesel. The increase in the total amount in 2020 is due to the fact that the 6 per cent cap on greenhouse gas emissions had to be met exclusively through the physical use of biofuels that year. The option to carry over GHG quotas was reintroduced in 2021, maintaining the same quota level. This is why total demand for biodiesel and HVO in the quota year 2022 is expected to reach 2.5 million tonnes as the cap on greenhouse gas emissions is raised to 7 per cent. The creditable share of palm oil-based biofuels in final energy consumption in road and rail transport in the quota year 2022 amounts to 0.9 per cent. As from 2023, such crediting is no longer possible in Germany.
average GHG reduction of 84 %

» 2.4.2 Emission saving
Greenhouse gas savings increases by 10 percentage point in 5 years
In 2021, a total of 2.7 million tonnes of feedstocks were used to produce the biodiesel/HVO/vegetable oil that was placed on the market. Just less than 40 per cent came from Europe, mostly from Germany. The use of rapeseed oil amounted to 591,000 tonnes, most of which was sourced in Europe, except for a smaller amount that came from Australia and North America. The amount of waste oils (used cooking fats and oils, used deep-frying oils, etc.) decreased 12 per cent from the previous year, but continued to exceed the amount of rapeseed oil-based biodiesel The largest amount of imported used cooking fats and oils came from Asia, with volumes actually decreasing 13 per cent. Only deliveries from South America recorded a slight increase in 2021. Imports of palm oil from Indonesia and Malaysia saw a sharp drop of 23 per cent. Nevertheless, they still account for more than 60 per cent of the feedstock mix. The use of soybean oil from South America more than doubled. Sunflower oil was hardly used at all.

In Germany, high-quality information on biomass used in biofuel production is systematically recorded and stored in a database called Nabisy and published by the Federal Office for Agriculture and Food (BLE). The unique traceability system exclusively centers on biofuels marketed as transport fuels and heating fuels (CHP plants). These biofuels can then be counted towards the quota of greenhouse gas (GHG) emission reduction. A “Union database” with analogous documentation requirements is being created at EU level in 2023. These requirements apply to biofuels only.
© AMI 2022 | Source: BLE
The feed market is one of the main beneficiaries of biodiesel production, because rapeseed meal is generated as a by-product (approximately 60 per cent protein) of rapeseed oil production in oil mills. In 2021, German oil mills processed just under 9.5 million tonnes of rapeseed. The production generated just over 4 million tonnes of rapeseed oil and just over 5.4 million tonnes of rapeseed meal. Since rapeseed is produced in Europe without using genetic manipulation (GM), its by-product, rapeseed meal, is also classified as GMO-free. This classification promotes the use of rapeseed meal mainly in dairy feeding, where it can fully replace soybean meal and the corresponding imports from overseas. The key factor is demand for dairy products that qualify as “without GM”. The corresponding consumer demand thus also supports the regional production and processing of rapeseed. At the same time, it reduces the dependence on imports of GMO soy and GMO soy meal.

Of the full 4 million tonnes of rapeseed oil, just about one third was used for human consumption, whereas 66 per cent was used for technical purposes or to produce energy. If demand for rapeseed oil for use in biodiesel production were to shrink in the future, if biodiesel is no longer seen as a contribution towards decarbonising the transport sector, two thirds of rapeseed meal production would no longer be available. This would have been as much as 4 million tonnes last year. Annual soybean meal imports would have to be boosted by nearly 2.7 million tonnes to fill this gap. This volume translates to a soybean area of 1 million hectares. These imports would therefore reverse the trend of promoting domestic GM-free protein sources. Since 2012, rapeseed meal accounts for half of the meal fed to animals in Germany.
© AMI 2022
Sources: BLE, AMI

World meat consumption multiplied over the past 50 years to more than 370 million tonnes and is set to increase further in the years to come. The increase is not just driven by the growth in world population, but also depends on standard of living, eating habits and consumer price levels. Compared to other raw materials, meat involves high production costs and is therefore relatively expensive compared to other staple foods.
More and more feed must be produced for the growing number of livestock. Alongside grains, soybeans and rapeseed are the main sources of protein used in feeds. Both soybeans and rapeseed are used to make protein feed meal. On a global scale, most soybeans are grown from genetically modified (GM) seed, as is rapeseed in Canada. Because of the global surge in meat consumption, demand for feed protein from oilseeds is set to rise further in future. The European Union exclusively grows GM-free oilseeds like rapeseed, sunflowers and soybeans. Since demand for produce declared as “without GM” is growing, production of GM-free products is increasingly based on national or European oilseeds. This aspect is going to gain importance because, as part of the “Farm to Fork” strategy, EU climate change legislation is increasingly geared to sustainability and reduction of greenhouse gas emissions.
© AMI 2022
Sources: FAO, OECD, UNO
All round the world biofuels are promoted through statutory blending requirements. The motivation of the various countries differs greatly. Whereas US and Brazilian interests focus on security of supply in the energy sector and reduction of fuel imports, the EU places great importance on climate protection and an increase in the overall proportion of renewable energy generated. The goals in Asian countries, such as Malaysia, Indonesia or China, but also in Argentina, are different again. In these countries, the main objective is to reduce vegetable oil surplus in an effort to stabilise market prices. These countries’ national mandates for shares of volume or energy in fossil-energy diesel fuel range from 1 to 30 per cent.

The obligation to reduce greenhouse gas (GHG) emissions was imposed on petroleum companies in Germany in 2015 and was incorporated as an option in the EU Commission’s proposal to revise the Renewable Energy Directive (2018/2001/EG) – Red III. Distributors, that is the petroleum companies, must comply with these requirements. Globally, bioethanol plays the most important role in the majority of countries that have introduced quota requirements. Again, its use is driven by (sometimes temporary) oversupply in the grain and sugar markets. These biofuels not only go a long way towards the protection of climate and natural resources, but also help reduce pressure on the market and, consequently, stabilise prices for agricultural producers. Because of this, blending requirements are subject to change if overall conditions in the market change.
© AMI 2021
Sources: Biofuels Digest, FAS, national reports
While the average per capita supply of cereals and vegetable oils has fluctuated over the past 60 years as overall world population has increased, it has shown an upward trend. The estimates for the 2022/23 marketing year are 343 kg of grain and 27 kg of vegetable oil per capita. This would be 10.1 kg per capita short of the previous year’s combined supply of 380.1 kg per capita, mainly due to smaller harvests in the northern hemisphere as a consequence of drought conditions. This figure includes the consumption of grains and vegetable oils for feed production purposes, transport fuel blending and other industrial purposes. Conversely, the amount of feedstock used in biofuels serves as supply buffer that can be diverted to food use for human consumption as needed. This puts a question mark on the EU Commission’s extensification policy resulting from the Green Deal, which stipulates blanket reduction targets for fertilising and crop protection products. The expected decline in output would deprive the market of commodity volumes for food supply and other application options in the bioeconomy.

In purely arithmetic terms, food supply is sufficient to feed the world’s population. However, there are still huge differences between regions in the availability of agricultural feedstock. The differences go back mainly to distribution issues rather than competing use of raw materials for transport fuels or animal feedstuff. Moreover, there are substantial differences in purchasing power in the different countries. Per-capita income, cost of living and rate of inflation in the different countries should also be taken into account. However, we need a comparison between different shopping baskets and habits of consumption (e.g. cassava, millet in Africa) that would allow us to draw conclusions on per capita purchasing power.
© AMI 2022
Sources: FAO, USDA
People in many parts of the world starve or are malnourished although in terms of figures there is adequate supply of the most important staple foods. Along with climate change, natural disasters and poor transport and storage logistics, wars and forced migration are the main factors stoking hunger in the world. On top of this, international terrorism has become an increasing risk to people’s lives and safety in a growing number of countries. It is sadly true that to this day more money is spent on maintaining and spreading violence than on peace.
All these factors prevent economies from booming, farmers from farming in a cost-efficient manner and countries from establishing democratic structures without maladministration or corruption. Countries having no structures for a functioning social system run a much higher risk of famine and malnutrition. Where an appropriate framework is in place, it could be used as a base on which to intensify locally adapted cultivation systems in a sustained manner and, by so doing, create the foundation for supply with food that is equally sustained.

The currency used to measure purchasing power is the international dollar, which is based on the US dollar. The World Bank put the per capita purchasing power in Germany in 2021 at around 51.040 US dollars. In contrast, the purchasing power in Burundi was only 240 US dollars. Thus, despite an adequate supply of agricultural products, the available resources in countries with low purchasing power are not sufficient to buy the necessary amount of food. Famine is often also caused by a lack of purchasing power. The production of feedstock for biofuel production basically enlarges this supply. The lack of solidarity of the rich industrial nations with those affected is the reason why the means required to provide comprehensive emergency aid are not made available. A food-or-fuel debate distracts from where the responsibility actually lies.
© AMI 2022 Sources: World Bank, USDA
The implications of climate change on agricultural production differ between regions.
In many regions, the adverse impact of climate change on crop yields and agricultural production could be partially offset by intensifying agricultural land management or expanding agricultural land. At the same time, small family farms have no access to innovative technologies and plant production methods. This makes it harder for them to adapt to a changing climate.
Model calculations project that climate change will cause a falloff in agricultural output in many parts of Africa, the Middle East and India and South and Southeast Asia. In contrast, for countries at more northern latitudes, higher temperatures are expected to lead to a potential long-term increase in agricultural production, such as in Canada and the countries of the Russian Federation.
Differences in access to markets and technologies within and between countries will probably enhance the effects of climate change and potentially lead to a growing gap between developed and developing countries.


Crop plants were grown on more than 1.4 billion hectares worldwide in 2021. These include grain, oilseeds, protein, sugar and fibre plants, fruits, vegetables, nuts and others. Most of these crops were used directly or indirectly, via livestock feeds, for human nutrition. Only around 8 per cent of the area was used in biofuels production. Biofuel production is mostly located in countries where there is already a surplus of feedstock (especially maize and soybeans). If the surplus were not used to produce biofuels, it would have to be placed on the global market, where it would weigh heavily on already low feedstock prices. The conversion of agricultural feedstock to biofuels reduces the production overhang, generates extra value added and reduces the need for foreign currency for imports of crude oil or fossil fuels. The latter is primarily a problem in poorer countries. Another advantage of biofuel production is that it also yields high-quality protein feedstuffs, which are in high demand. The share and quality of these protein feeds have a strong influence on feedstock prices and consequently on the size of the area planted. This holds true especially for soybeans. Biofuels are by no means the price drivers in the commodities markets. If necessary, the feedstocks grown for biofuel production are primarily available for food supply. If arable farming were to be extensified for political reasons – an aim the EU Commission is pursuing with the reduction strategy for fertilisers and plant protection products under the “Green Deal” – this option of “buffering” food demand would no longer be available.
Sources: OECD, USDA, Oil World

The primary purpose of agriculture has always been to feed a growing world population, taking into account the changes in eating habits due to higher incomes. This purpose requires a sustainable intensification and growth of agricultural production. Between 1961 and 2020, cropland increased by 212 million hectares to 1,562 million hectares. Around 10 per cent of the globe’s land was used for arable farming some 60 years ago; that figure had risen to 12 per cent as of 2020. In the southern hemisphere, these increases are first and foremost based on expansions of area planted, along with progress in production methods (seed, fertilisers, crop protection, agricultural engineering). In the northern hemisphere, on the other hand, cropland is decreasing. Sustainable increases in productivity primarily result from research and innovation at universities and companies from the chemical and plant breeding industries. This progress is achieved as a result of farmers’ high levels of qualification, good professional support and prompt implementation of new insights in agricultural practice. However, the trend in the EU to promote extensification through political regulations gives rise to concern. Global
The conversion of primeval forest and other land required to protect the environment and climate is the subject of growing controversy. Binding sustainability requirements should be created for all production regions to certify the production of biomass – irrespective of its final use –and trace back the origins of the feedstocks. The EU’s biofuels policy, more specifically the revision of the Renewable Energy Directive (RED II), tightens documentation and greenhouse gas reduction requirements, which for the first time also apply to solid biomass. The aim is to create a level playing field for global fair competition without any environmental or social dumping.
Oil palm is the single most important oleaginous fruit crop in Southeast Asia, but is also grown to a considerable extent in Colombia and Nigeria. Like other vegetable oils, it is ideal for a wide range of uses in food (67 per cent), oleochemical items (just less than 7 per cent) or as a feedstock for biofuel (just less than 18 per cent). Global palm oil consumption in 2022 is estimated at 76 million tonnes. The majority is used as edible oil in Southeast Asia. Global palm oil production is increasing due to the expansion in area by clearing primeval forest legally and illegally and replanting with high-yielding hybrid varieties. However, the growth in global demand is lagging behind. This has the result that more and more palm oil surplus is processed into biodiesel in the main palm oil producing countries and governments are raising blending quota requirements step by step. In Indonesia, the quota for non-public transport is already at 30 per cent. The EU is reducing the use of palm oil for biofuel production. The Renewable Energy Directive (Red II) stipulates that the use of palm oil-based biofuels will no longer be eligible for credits to meet quota obligations or climate goals by 2030 at the latest. In France, Austria, Belgium and other EU member states, crediting is no longer permitted even now. In Germany, crediting will not be possible from 2023 onwards. Nevertheless, world consumption of palm oil will probably pick up, especially for food uses.

» 4.3.1 Land required for soybeans if German biodiesel production did not exist
Rapeseed meal takes on special importance in relation to the demand for a boost in self-sufficiency in feed protein. What makes this kind of feed protein so special compared to imported oilseed meals is that it is GM-free. It is also lower priced than adequate alternatives, such as GM-free soybean meal, and it generally has short distances for transport and processing. In Germany, there are 13 locations (oil mills) that process rapeseed into meal. Extracted rapeseed meal and rapeseed expeller are by-products of rapeseed processing and obtained together with rapeseed oil. The latter is used both as a feedstock for food and for biodiesel production. If demand for rapeseed oil were to decline because the use of cultivated biomass for biofuels would be politically restricted, supply of rapeseed meal from domestic production would dwindle as well. However, rapeseed meal is urgently needed, because annual demand of oilseed meal in Germany amounts to 7.5 to 8 million tonnes. Without sales of rapeseed oil-based biodiesel, supply of rapeseed meal would decrease approximately 3.4 million tonnes and have to be offset by alternatives. In terms of soybean meal equivalents, these alternatives would amount to 2.7 million tonnes. This volume, which translates to a soybean area of just less than 1 million hectares, could not come from Germany or the EU-27. For comparison, this is a larger area than the island of Cyprus. It is more likely than not that soybean producers in America, especially in South America, would close this gap by expanding cropland further. This would only be at the cost of the primeval forest.

© AMI 2022 | Source: AMI

Wheat is used for both food production and bioethanol production. Many people argue that production of biofuels causes a shortage in this feedstock for food production and drives wheat prices. A look at wheat-rye bread prices does not confirm this thesis! Feedstock supply and prices at the producer level barely have an impact on bread prices. This becomes quite evident in connection with the Ukraine war. As prices of energy and feedstocks and energy-intensive items have risen sharply, consumers have indeed had to pay more for wheat-rye bread since June 2022. But he main reason for this price hike is higher energy prices.
The explosion of prices for agricultural commodities and staple foods all over the world in 2008 and the accompanying volatility of prices have moved the issue of global food to the fore. Continuing famine and poverty since then have also been associated with changes in international prices for agricultural feedstock. There is often a correlation drawn with the biofuels market when discussing the reasons for the high price levels, but there is none. Grain production in 2022/23 is less comfortable than it was in previous years. However, competition on the global market is huge and demand is reticent. This has in fact recently driven prices down. The same holds true for biofuels prices, which have fallen due to pressure from falling feedstock costs.

While energy prices saw a steep rise already in 2021, in 2022 they virtually exploded as the Russia-Ukraine war began. As a consequence, the competitive advantage of biodiesel improved, boosting demand and limiting the bottom threshold for prices. May 2022 vegetable oil prices reached a record high at 171 euro cents per litre, but did not maintain this high level due to abundant harvests and, above all, the ongoing supply with commodity from Ukraine. At the same time, estimates of demand on the global market were reduced because of China’s very strict zero-Covid policy. Although China’s Mega Cities gradually re-opened in December 2022, a pick-up in demand has not occurred to date (rising case numbers).
German biodiesel consumption was on the decline in 2022. In blending, preference was given to other GHG saving items such as bioethanol. In August, the price for biodiesel reached its annual high at 201 euro cents per litre. However, it failed to maintain this level, losing ground due to inadequate demand. Consequently, at just under 144 euro cents per litre at the end of November 2022, prices for untaxed RME were around 30 per cent below the same period of the previous year.

Over the past years, Ukraine has become an indispensable provider of grain, oilseeds and vegetable oils to the global market. In world trade in sunflower oil alone, the country covers more than half of the total volume, averaging 5.8 million tonnes. Consequently, the start of the war on 24 February 2022 led to great uncertainty and an unprecedented explosion in prices. It not only affected the rapeseed market, where Ukraine accounts for 14 per cent of world trade, but also the grain market. Maize is the most important grain shipped from Ukraine. The average tonnage of maize coming from Ukraine in the marketing years 2016/17 through to 2020/21 was around 25.5 million tonnes, which accounted for 15 per cent of total exports. At just under 18 million tonnes, wheat is also a key export item, with a slightly lower share of 9 per cent. Other important exports include barley, with a 15 per cent share in world trade, rye with 7 per cent and sunflower meal with 59 per cent. In absolute terms, however, this translates to only 4.7 million tonnes.
Shares of the top 5 in world trade on a long-term average (2016/17 - 2020/21)
In light of the initial absence of shipments from the Black Sea region, the implications of the war in Eastern Europe for supply within the EU-27 quickly became evident. Ukraine is the largest supplier of sunflower oil to the EU. Imports in the marketing year 2020/21 totalled around 1.7 million tonnes, of which 1.5 million tonnes, around 88 per cent, came from Ukraine. Based on an estimated EU consumption of 4.5 million tonnes of sunflower oil, Ukrainian imports, in purely arithmetic terms, accounted for 33 per cent. In Germany, there was a phase of “panic buying“ by consumers of vegetable oil. Although vegetable oil was never in short supply. The supply chains are geared to cover the usual volumes of demand. If consumers buy three bottles instead of one or two, shelves will naturally be quickly emptied. As an alternative, consumers could always have bought rapeseed oil instead of sunflower oil. The discussion on the importance of Ukraine in supplying the markets related particularly to wheat supplies to African countries. These issues and the associated price increases are solely a result of Russia’s war of aggression against Ukraine. In order to avoid supply bottlenecks and ensure emergency supplies, options for putting suitable storage facilities in place for wheat – similar to mineral oil products and natural gas – should be examined.

Although sowing of winter crops in the autumn of 2022 was more difficult and dangerous than ever before in the history of independent Ukraine, the rapeseed area is expected to expand at the expense of wheat and barley. Russia’s military invasion has interrupted supply chains and driven prices up for seed, fertilisers, crop protection products and fuel. Changes in area planted will also depend on how the grain corridor will work and on the situation in the combat zones. Ukraine farmers’ financial situations have deteriorated severely, because many farmers either lost their harvests through shelling of facilities or burning of fields or were unable to sell due to low domestic demand and reduced exports.
No or little reduction is expected in spring-sown oilseeds and also legumes. The main reason is the foreseeable decline in the area used for maize. Part of the maize was not harvested in 2022, because rain hampered threshing operations and foreseeably high drying costs made harvesting unprofitable. By contrast, soybeans and sunflower seed benefited from their previously high profitability and higher value-to-weight-ratio (bulk density) in exports. There is currently no way to predict what volumes of oilseeds and grain Ukraine will be able to supply in 2023.

AMI Consumer Price Index
AMI/LK/MIO
Agricultural Market Information Company (AMI), Bonn
AMI producer price survey in cooperation with the Chambers of Agriculture, Bayerischem Bauernverband, Badischer Landwirtschaftlicher Hauptverband e. V., Landesbauernverband in Baden-Württemberg e. V., Landesbetrieb Landwirtschaft Hessen, Marktinformationsstelle Ost
AMI
BAFA
Biofules digest
BLE
European Commission
Agricultural Market Information Company (AMI), Bonn; Oilseeds and Bioenergy (in German)
German Federal Office for Economic Affairs and Export Control (Bundesamtes für Wirtschaft und Ausfuhrkontrolle, Eschborn: Amtliche Daten Mineralöl)
Online publication www.biofuelsdigest.com
Evaluation and Progress Report 2021
Statistics oil and fats
GD AGRI, Brüssel; Agriculture and rural development; Crops market observatory
JRC. Ispra, Italien
FAO
FAS
Handbuch der Lebensmitteltechnologie Nahrungsfette und -öle
IGC
OECD
Food and Agriculture Organization of the United Nations, Rom: Food Outlook
AMIS Market Database
FAO Cereal Supply and Demand Brief
Thesttate of agricultural commodity markets
FAO data base
EU Biofuels Annual 2022; USDA Foreign Agricultural Service, Washington
FAS/IPAD crop calender
Michael Bockisch, Verlag Eugen Ulmer, ISBN 3-8001-5817-5 (Kapitel 4 Pflanzliche Fette)
Grain Market Report, 11/2022; International Grain Council, Internationaler Getreiderat, London
Agricultural Outlook; Organisation for Economic Cooperation and Development, Paris
Oil World OIL WORLD statistics update; ISTA Mielke GmbH, Hamburg
RFA Markets & Statistics; Renewable fuels association, Ellisville
German Federal Statistical Office
Federal Statistical Office Agriculture and forestry, fisheries; Field crops and grassland; Field Crops; Field Crops and Grassland, Wiesbaden
UNO UN database, New York
USDA United States Department of Agriculture, Washington; Marktet and trade data, PSD online Data & Analysis Reports
Weltbank
World bank – Data base, Washington
Credit title: Map of the world:: Vecteezy.com; photolinc/Shutterstock.com; Eky Studio/Shutterstock.com; I love photo/Shutterstock.com; Subbotina Anna/Shutterstock.com; Isarapic/Shutterstock.com; oticki/Shutterstock.com
www.ami-informiert.de/ami-maerkte/maerkte/ami-maerkte-verbraucher/meldungen.html
https://www.ami-informiert.de/ami-english/ami-about-us/about-us
www.ami-informiert.de/ami-shop/shop/detail?ai%5Bd_name%5D=Markt_aktuell_%C3%96lsaaten_und_Bioenergie&ai%5Bd_prodid%5D=110&ai%5Bd_pos%5D=11&ai%5Bcontroller%5D=Catalog&ai%5Baction%5D=detail
https://bit.ly/3ZopGtb
www.biofuelsdigest.com/bdigest/2022/01/03/the-digests-biofuels-mandates-around-the-world-2022/
https://www.ble.de/EN/Topics/Climate-Energy/Sustainable-Biomass-Production/sustainable-biomass-production_node.html
https://www.ble.de/DE/BZL/Daten-Berichte/Oele-Fette-Huelsenfruechte/oele-fette_node.html
www.ec.europa.eu/info/food-farming-fisheries/farming/facts-and-figures/markets/overviews/market-observatories/crops_de https://agridata.ec.europa.eu/extensions/Ukraine/Ukraine.html
https://agridata.ec.europa.eu/extensions/DashboardCereals/OilseedTrade.html
www.ec.europa.eu/jrc/en/publication/eur-scientific-and-technical-research-reports/fossil-co2-emissions-all-world-countries-2020-report https://www.sciencedirect.com/science/article/pii/S095937801830253X?via%3Dihub#fig0005
www.fao.org/giews/reports/food-outlook/en/ www.amis-outlook.org/amis-about/calendars/soybeancal/en/ www.fao.org/worldfoodsituation/csdb/en/ www.fao.org/publications/soco/en/ www.fao.org/faostat/en/#data
https://apps.fas.usda.gov/newgainapi/api/Report/DownloadReportByFileName?fileName=Biofuels%20Annual_The%20Hague_European%20 Union_E42022-0048.pdf
ipad.fas.usda.gov/ogamaps/cropcalendar.aspx
http://www.igc.int/en/gmr_summary.aspx
https://stats.oecd.org/viewhtml.aspx?QueryId=76858&vh=0000&vf=0&l&il=&lang=en www.oilworld.biz
ethanolrfa.org/markets-and-statistics/view-all-markets-and-statistics
https://www.destatis.de/DE/Themen/Branchen-Unternehmen/Landwirtschaft-Forstwirtschaft-Fischerei/Feldfruechte-Gruenland/Publikationen/ Downloads-Feldfruechte/feldfruechte-august-september-2030321212094.pdf;jsessionid=2FE958156A95F9B1E23073EEAF56F8F9.live732?__ blob=publicationFile
https://www.statistischebibliothek.de/mir/receive/DEHeft_mods_00146303
data.un.org/Data.aspx?q=world+population+2021&d=PopDiv&f=variableID%3a12%3bcrID%3a900%3btimeID%3a87
apps.fas.usda.gov/psdonline/app/index.html#/app/advQuery
www.fas.usda.gov/data
data.worldbank.org/indicator/NY.GNP.PCAP.PP.CD