University of California, Irvine, School of Social Ecology Irvine at 50: A Tale of Continuity and Change • November 1 2021
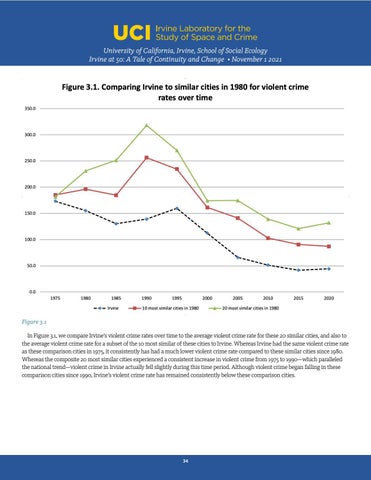
Figure 3.1 In Figure 3.1, we compare Irvine’s violent crime rates over time to the average violent crime rate for these 20 similar cities, and also to the average violent crime rate for a subset of the 10 most similar of these cities to Irvine. Whereas Irvine had the same violent crime rate as these comparison cities in 1975, it consistently has had a much lower violent crime rate compared to these similar cities since 1980. Whereas the composite 20 most similar cities experienced a consistent increase in violent crime from 1975 to 1990—which paralleled the national trend—violent crime in Irvine actually fell slightly during this time period. Although violent crime began falling in these comparison cities since 1990, Irvine’s violent crime rate has remained consistently below these comparison cities.
34


