12 minute read
Panama City ......................................................................................100


Short Term Outlook for Panama City, FL December 2021 Forecast
2021:Q4 2022:Q1 2022:Q2 2022:Q3 2022:Q4 2023:Q1 2023:Q2 2023:Q3 2023:Q4 2024:Q1 2024:Q2 2024:Q1 2024:Q2
Personal Income (Billions $)
Total Personal Income 9.8 9.8 9.8 9.9 9.9 10.0 10.1 10.2 10.3 10.4 10.5 10.7 10.8
Pct Chg Year Ago Wages and Salaries
4.4 -7.8 -0.9 0.5 1.7 2.1 2.8 3.4 3.9 4.5 4.2 4.2 4.2 4.6 4.6 4.6 4.7 4.7 4.7 4.8 4.8 4.9 4.9 5.0 5.0 5.1 Nonwage Income 5.2 5.2 5.2 5.2 5.3 5.3 5.3 5.4 5.5 5.5 5.6 5.6 5.7 Real Personal Income (12$) 8.8 8.8 8.8 8.8 8.8 8.8 8.9 8.9 9.0 9.0 9.1 9.1 9.2 Pct Chg Year Ago -0.3 -11.4 -3.9 -1.7 -0.1 0.3 1.0 1.6 2.0 2.5 2.2 2.1 2.1 Per Capita Income (Ths) 53.1 53.2 53.6 53.9 54.3 54.5 55.1 55.7 56.3 56.8 57.2 57.8 58.3 Real Per Capita Income (12$) 47.9 47.8 47.9 48.0 48.1 48.1 48.4 48.7 48.9 49.2 49.3 49.5 49.6 Average Annual Wage (Ths) 54.3 54.7 55.0 55.3 55.5 55.9 56.2 56.5 57.0 57.6 58.1 58.7 59.3 Pct Chg Year Ago 4.2 4.2 2.4 1.9 2.3 2.1 2.2 2.3 2.7 3.0 3.5 3.9 4.0
Establishment Employment (Place of Work, Thousands, SA)
Total Employment 81.1 81.3 81.5 81.5 81.8 81.9 82.4 82.7 82.9 82.8 82.8 82.8 82.8 Pct Chg Year Ago 1.8 0.8 1.5 1.1 0.9 0.7 1.2 1.5 1.3 1.2 0.4 0.1 0.0 Manufacturing 3.3 3.3 3.2 3.2 3.2 3.2 3.2 3.2 3.2 3.3 3.3 3.3 3.3 Pct Chg Year Ago -0.1 1.2 2.9 -0.7 -0.8 -0.8 -0.1 1.0 0.6 0.7 0.6 0.4 0.3 Nonmanufacturing 77.8 78.0 78.3 78.3 78.5 78.6 79.2 79.5 79.6 79.6 79.5 79.5 79.6 Pct Chg Year Ago 1.8 0.7 1.4 1.2 0.9 0.8 1.2 1.5 1.4 1.2 0.4 0.1 -0.1 Construction & Mining 7.3 7.3 7.2 7.1 6.9 6.8 6.6 6.5 6.4 6.3 6.2 6.1 6.1 Pct Chg Year Ago 1.7 -0.6 -0.9 -4.3 -5.7 -6.7 -7.2 -7.7 -7.4 -7.1 -6.2 -5.6 -5.2 Trade, Trans, & Utilities 16.3 16.1 15.9 15.7 15.4 15.3 15.4 15.3 15.3 15.1 14.6 14.5 14.4 Pct Chg Year Ago -0.8 -2.6 -0.4 -1.7 -5.3 -5.2 -3.0 -2.6 -0.8 -1.4 -5.1 -5.5 -5.8 Wholesale Trade 2.3 2.4 2.4 2.5 2.5 2.5 2.5 2.5 2.5 2.6 2.6 2.6 2.6 Retail Trade 12.3 12.1 11.9 11.7 11.3 11.2 11.4 11.3 11.2 11.0 10.5 10.3 10.2 Trans, Wrhsng, & Util 1.7 1.6 1.6 1.6 1.6 1.6 1.5 1.5 1.5 1.5 1.5 1.5 1.5 Information 0.6 0.6 0.6 0.6 0.6 0.6 0.6 0.6 0.6 0.6 0.6 0.6 0.6 Pct Chg Year Ago -0.4 -0.4 -0.3 -2.4 -4.8 -4.2 -1.8 -0.5 4.0 5.8 6.2 4.8 1.7 Financial Activities 5.0 5.0 5.1 5.2 5.2 5.2 5.3 5.3 5.3 5.4 5.4 5.4 5.4 Pct Chg Year Ago 0.8 2.0 6.4 6.8 5.1 3.8 2.8 2.0 1.9 2.1 2.4 2.4 1.9 Prof & Business Services 10.6 11.0 11.3 11.4 11.5 11.6 11.6 11.6 11.7 11.8 12.0 12.0 12.0 Pct Chg Year Ago 4.2 5.5 9.2 8.0 9.0 4.9 3.0 2.2 2.0 2.3 3.1 3.1 2.5 Educ & Health Services 9.4 9.5 9.6 9.6 9.5 9.5 9.5 9.5 9.5 9.6 9.7 9.8 9.9 Pct Chg Year Ago -0.9 -0.5 2.8 2.0 1.1 0.7 -1.3 -1.4 -0.2 0.8 2.3 3.4 3.5 Leisure & Hospitality 12.9 12.7 12.7 12.7 13.3 13.5 14.0 14.4 14.5 14.5 14.6 14.7 14.7 Pct Chg Year Ago 9.1 4.5 -5.0 -1.4 2.8 5.7 10.2 13.1 9.2 7.5 4.0 1.9 1.9 Other Services 2.6 2.6 2.7 2.8 2.8 2.8 2.7 2.8 2.8 2.8 2.8 2.9 2.9 Pct Chg Year Ago 0.2 4.1 4.6 5.3 5.0 5.4 2.2 0.1 0.6 1.5 3.5 4.3 4.3 Federal Government 3.9 3.9 4.0 4.1 4.1 4.2 4.2 4.2 4.2 4.2 4.2 4.2 4.2 Pct Chg Year Ago -0.6 0.6 4.4 6.7 5.6 5.3 4.3 2.9 1.5 0.7 0.3 0.3 0.2 State & Local Government 9.2 9.2 9.2 9.2 9.2 9.3 9.3 9.3 9.3 9.3 9.4 9.4 9.4 Pct Chg Year Ago -0.2 -2.7 1.0 -0.8 0.3 0.8 0.8 1.2 1.0 0.8 0.9 0.4 0.5
Other Economic Indicators
Population (Ths) 184.2 183.8 183.5 183.3 183.3 183.3 183.4 183.5 183.6 183.8 184.1 184.4 184.8 Pct Chg Year Ago -1.2 -1.0 -0.9 -0.7 -0.5 -0.3 -0.1 0.1 0.2 0.2 0.4 0.5 0.6 Labor Force (Ths) 93.9 93.6 93.3 93.1 92.9 92.6 92.5 92.4 92.4 92.3 92.4 92.5 92.8 Pct Chg Year Ago 6.4 2.8 1.0 -0.2 -1.0 -1.1 -0.9 -0.7 -0.5 -0.3 -0.1 0.1 0.4 Unemployment Rate (%) 5.0 4.7 4.7 4.6 4.6 4.4 4.3 4.3 4.3 4.0 4.0 3.9 3.8 Total Housing Starts 1663.5 1672.4 1600.4 1571.0 1524.1 1471.2 1401.7 1377.6 1373.7 1347.8 1321.4 1311.7 1288.9 Single-Family 1341.7 1217.1 1104.6 1006.7 944.4 897.7 855.6 830.4 821.6 796.9 781.5 781.2 769.2 Multifamily 321.7 455.2 495.8 564.3 579.8 573.5 546.1 547.2 552.1 550.9 539.9 530.6 519.6
PROFILES
The Pensacola–Ferry Pass–Brent MSA is comprised of Escambia County and Santa Rosa County. Located in the northwest corner of Florida bordering Alabama, the region is home to the Pensacola Naval Air Station, Blue Angels, and the National Museum of Naval Aviation. This area has been referred to as the “Cradle of Naval Aviation.”
QUICK FACTS
• Metro population estimate of 488,246 as of 2019 (5-Year Estimate) (U.S. Census Bureau). • Escambia County population estimate of 318,316 as of 2019 (5-Year Estimate) (U.S. Census
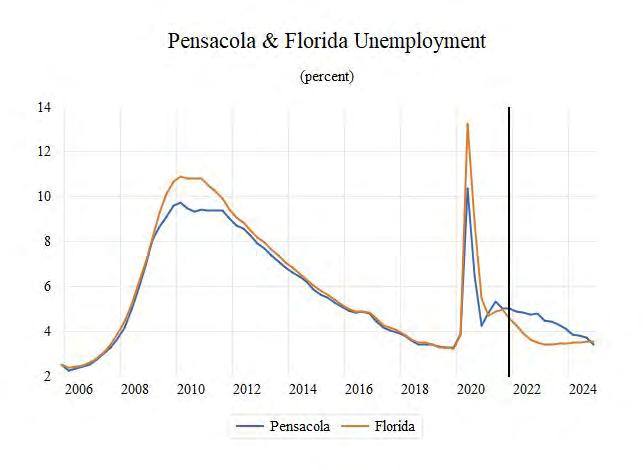
Census Bureau). • Civilian labor force of 242,790 in August 2021 (Florida Research and Economic Database). • An unemployment rate of 4.5% as of August 2021, not seasonally adjusted. This amounts to 10,847 unemployed people (Florida Research and
Economic Database).
OUTLOOK SUMMARIES
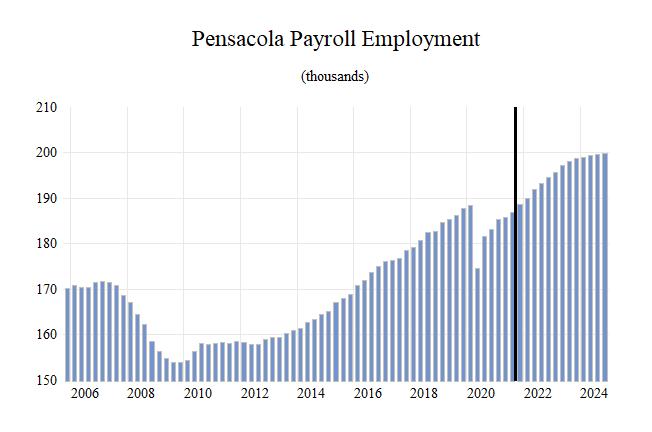
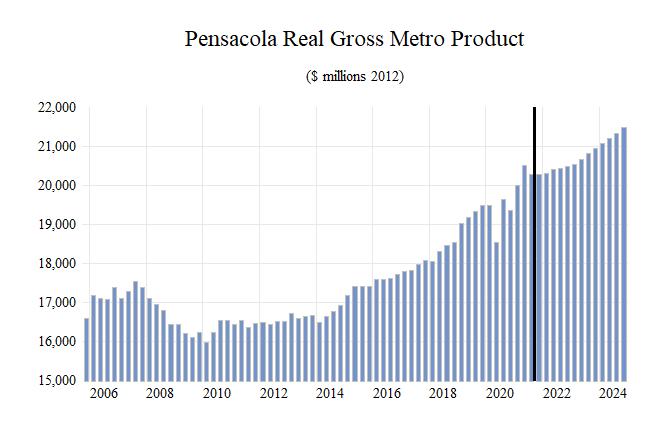
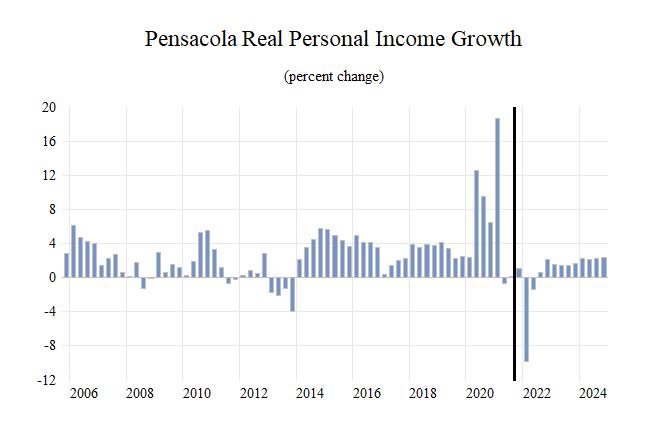
The Pensacola—Ferry Pass—Brent Metropolitan Statistical Area (MSA) will experience average levels of economic growth in the studied indicators. Gross Metro Product will be $20,661.11. Average annual wage growth will be 3.5 percent, leading to an average annual wage of $58,300, slightly below the state average. Personal income growth will be 3.9 percent, placing the per capita income level at $47,400. Pensacola’s population will grow by an average rate of 1.0%.
Employment growth in the MSA will rise by 2.3 percent, and the unemployment rate will be 4.5 percent. Housing Starts in Pensacola will fade to be at the lowest rate of growth compared to all 25 MSA’s at -11.6%.
The Leisure sector will be the fastest growing sector in Pensacola with a 7.3 percent average annual growth rate. The Financial Services sector will grow at the second-fastest rate in the MSA at 5.2 percent. The Other Services sectors will place third at 3.8 percent average annual growth. The Trade, Transportation, and Utilities sector will contract by -0.9 percent.
METRO NEWS SUMMARIES
Former Addict Leads Way as 5 Tiny Homes Now Available for Pensacola Homeless
• Caleb Houston and other citizens from Pensacola came together to build five tiny new homes for the homeless. These homes are equipped with working utilities such as working AC and lighting. • Huts For Our Friends was launched and run by Caleb Houston and other volunteers back in
January of 2021. This group also provides the homeless with resources and services to help get them back on their feet. • The building and utilities of this project was paid for by private donors of the community.
Port-a-Potties and other hygiene stations will be available for the residents of the tiny homes. Source: ABC 3Wear-TV, July 22, 2021
Pensacola Businesses Take Precautions to Rising COVID Cases
• After taking a big hit last year from COVID restaurants in Pensacola are opening up again while trying to keep employees and consumers safe. • Pensacola restaurants are having issues with health and safety since Governor Ron DeSantis promised COVID resections would not be put back in place. Lines are out the door with customers not wearing masks regardless of the spike in cases. • Many of the restaurant owners are having a difficult time deciding whether to require people wear masks or to leave it up to the consumers themselves to decide. Source: ABC 3Wear-TV, July 30, 2021
Pensacola Won’t Issue New Permits for Indoor Events Through Sept. 15 as COVID-19 Surges
• From August 11th- September 15th the city of
Pensacola will not be issuing new permits for any indoor events at the city’s venues. • These restrictions will not be applied to private events. The new restrictions are only applied towards new events being planned; current events will be still permitted. These restrictions came about after 343 patients were hospitalized at local hospitals Wednesday August 11th . • In addition to no new permits, Pensacola is also reducing the capacity to current events to 50%.
Some of the city’s feeding programs are being moved to drive through only as well. Source: Pensacola News Journal, August 11, 2021
Santa Rosa County Commits $1M to New Sports Complex for Town of Jay
• A $1 million renovation project for Bray-
Hendricks Sports Park is being planned and secured within the next six months. Renovations will include baseball fields, soccer fields, football fields, tennis courts, concession stands etc.
• The area around the sports park is also booming with new construction which will lead to a lot of traffic and events at the park. • The project doesn’t have a final completion date, but the plans should be set in stone but the end of this year. Source: Pensacola News Journal, August 13, 2021
$37 Million Invested in New Escambia County Elementary School Building
• $37 million taxpayers dollars went to building a new section of Pleasant Grove Elementary school in Escambia County. • This project is to help the school expand and keep up with the increasing number of students enrolling. It is a new building that is around 137,000-sqaure feet and holds up to 800 students. • The new building and renovation of the
Elementary school will make it one of the most energy efficient schools in the state. Source: ABC 3 Wear-TV, September 16, 2021
Santa Rosa County Industrial Park get $16M Triumph Funding Commitment, 450 Jobs to Come
• On Tuesday a $36 million-dollar industrial park for distribution companies in Santa Rosa County got the Triumph Gold Coast Board to agree to fund $15.9 million. The county has three other industrial parks currently. • Many distribution companies are coming to
Santa Rosa County asking for 40 to 60 acres of land for new their new building plans to create more distribution centers. Some of the recent developments that have been made are aviation and aerospace companies. • Many jobs are being created with these massive distribution centers being built. The newest industrial park being built is bringing in 454 private sector jobs, with an average wage of $41,770. Pensacola’s population is on the rise so these new centers will be helpful to grow the local economy. Source: Pensacola News Journal, September 15, 2021
Port St. Lucie MSA Industry Loca�on Quo�ents
Total Nonagricultural Employment
Total Private
Goods Producing
Service Producing
Private Service Providing
Mining, Logging, and Construc�on
Manufacturing
Trade, Transporta�on, and U�li�es
Wholesale Trade
Retail Trade
Transporta�on, Warehousing and U�li�es
Informa�on
Financial Ac�vi�es
Professional and Business Services
Educa�onal and Health Services
Leisure and Hospitality
Other Services
Government
0 0.2 0.4 0.6 0.8 1 1.2 1.4
Long Term Outlook for Pensacola-Ferry Pass-Brent, FL December 2021 Forecast
2016 2017 2018 2019 2020 2021 2022 2023 2024
Personal Income (Billions $)
Total Personal Income Pct Chg Year Ago Wages and Salaries Nonwage Income Real Personal Income (12$) Pct Chg Year Ago Per Capita Income (Ths) Real Per Capita Income (12$) Average Annual Wage (Ths) Pct Chg Year Ago 19.8 20.9 21.7 22.8 24.6 26.5 26.4 27.5 28.7 5.0 5.7 3.6 5.4 8.0 7.6 -0.3 3.9 4.3 8.6 9.1 9.4 10.0 10.4 11.3 11.9 12.4 13.0 11.2 11.8 12.3 12.8 14.2 15.2 14.5 15.0 15.7 20.6 21.5 21.8 22.6 24.2 25.1 24.3 24.8 25.4 4.6 4.3 1.5 3.6 6.8 3.9 -3.0 2.1 2.2 40.9 42.7 43.6 45.2 48.1 51.1 50.5 52.0 53.7 42.7 44.0 44.0 44.8 47.2 48.4 46.5 47.0 47.6 45.5 47.0 48.0 49.9 52.9 56.2 57.5 58.7 60.6 1.9 3.3 2.3 3.8 6.1 6.2 2.3 2.0 3.3
Establishment Employment (Place of Work, Thousands, SA)
Total Employment 172.8 176.9 181.2 185.9 181.8 186.6 192.4 197.3 199.4 Pct Chg Year Ago 3.3 2.4 2.4 2.6 -2.2 2.6 3.1 2.6 1.1
Manufacturing Pct Chg Year Ago Nonmanufacturing Pct Chg Year Ago Construction & Mining Pct Chg Year Ago Trade, Trans, & Utilities Pct Chg Year Ago
6.3 6.1 6.5 7.1 6.9 7.0 7.2 7.2 7.0 3.0 -2.0 5.1 9.7 -2.2 1.0 2.2 0.3 -2.4 166.6 170.8 174.7 178.8 174.9 179.6 185.2 190.2 192.4 3.4 2.5 2.3 2.3 -2.2 2.7 3.2 2.7 1.2 10.8 11.5 11.7 12.2 11.9 12.3 12.1 11.6 11.2 8.5 6.1 1.6 4.3 -2.1 3.1 -1.7 -4.1 -3.6 32.5 33.2 33.6 33.8 33.6 34.2 33.9 33.2 32.3 2.4 2.1 1.3 0.4 -0.6 1.9 -1.0 -2.0 -2.7
Wholesale Trade Retail Trade Trans, Wrhsng, & Util Information Pct Chg Year Ago
5.4 5.6 5.7 5.7 5.7 5.8 6.1 6.3 6.5 23.0 23.5 23.8 23.8 23.6 23.8 23.0 22.2 21.0 4.0 4.1 4.2 4.3 4.3 4.6 4.7 4.7 4.8 2.1 1.9 1.8 1.7 1.5 1.5 1.6 1.6 1.7 -7.2 -5.7 -8.2 -4.7 -9.8 -0.4 2.9 3.0 4.8
Financial Activities Pct Chg Year Ago Prof & Business Services Pct Chg Year Ago Educ & Health Services Pct Chg Year Ago Leisure & Hospitality Pct Chg Year Ago Other Services Pct Chg Year Ago Federal Government Pct Chg Year Ago State & Local Government Pct Chg Year Ago 12.3 12.9 14.0 14.9 15.2 15.6 16.8 17.7 18.7 5.4 5.1 8.3 6.3 2.2 2.6 7.8 5.1 5.4 22.5 22.7 24.3 24.4 24.6 25.5 26.4 26.9 27.3 0.4 1.0 6.8 0.5 0.8 3.6 3.9 1.6 1.7 29.3 29.9 30.1 31.0 30.6 31.2 32.3 32.6 33.4 5.8 2.1 0.8 2.8 -1.3 2.0 3.6 1.0 2.2 22.9 24.1 24.6 25.8 22.8 24.3 25.5 29.2 30.2 6.0 5.3 1.8 4.9 -11.5 6.4 5.2 14.5 3.1 6.0 6.2 6.3 6.6 6.4 6.6 7.2 7.3 7.4 3.2 3.6 2.2 4.1 -2.5 3.3 8.6 2.0 1.2 6.6 6.6 6.5 6.6 6.8 6.7 7.1 7.3 7.4 1.5 -0.6 -0.6 1.0 2.9 -2.1 5.9 3.8 0.4 21.6 21.7 21.8 22.0 21.5 21.7 22.3 22.6 22.9 0.3 0.6 0.3 0.7 -2.2 1.2 2.7 1.4 1.4
Other Economic Indicators
Population (Ths) Pct Chg Year Ago Labor Force (Ths) Pct Chg Year Ago Unemployment Rate (%) Total Housing Starts Single-Family Multifamily
482.7 489.0 496.2 504.6 512.3 518.4 523.6 528.7 533.4 1.3 1.3 1.5 1.7 1.5 1.2 1.0 1.0 0.9 217.8 220.9 224.2 228.7 227.2 238.9 248.4 251.6 251.8 2.2 1.4 1.5 2.0 -0.7 5.1 4.0 1.3 0.1 4.9 4.1 3.6 3.3 6.2 5.0 4.8 4.3 3.7 2927.0 2669.7 2484.1 3319.5 4108.7 4179.4 3278.2 2636.6 2451.3 2446.1 2638.6 2450.8 2782.7 3893.6 3029.5 2429.3 2393.7 2265.7 480.9 31.1 33.2 536.9 215.1 1149.9 848.9 242.9 185.6


