13 minute read
Tallahassee...........................................................................................130


Short Term Outlook for Tallahassee, FL December 2021 Forecast
2021:Q4 2022:Q1 2022:Q2 2022:Q3 2022:Q4 2023:Q1 2023:Q2 2023:Q3 2023:Q4 2024:Q1 2024:Q2 2024:Q1 2024:Q2
Personal Income (Billions $)
Total Personal Income 19.1 19.2 19.4 19.6 19.8 19.9 20.1 20.3 20.5 20.7 21.0 21.2 21.5
Pct Chg Year Ago Wages and Salaries
5.6 -5.6 0.5 2.1 3.4 3.9 3.7 3.6 3.9 4.3 4.3 4.5 4.7 10.0 10.1 10.3 10.4 10.5 10.6 10.7 10.8 10.9 11.0 11.1 11.3 11.4 Nonwage Income 9.1 9.0 9.1 9.2 9.3 9.3 9.4 9.5 9.6 9.7 9.8 9.9 10.1 Real Personal Income (12$) 17.7 17.7 17.8 17.9 18.0 18.0 18.1 18.2 18.3 18.4 18.6 18.7 18.8 Pct Chg Year Ago 0.8 -9.2 -2.4 -0.1 1.5 2.0 1.8 1.8 2.0 2.3 2.3 2.4 2.6 Per Capita Income (Ths) 49.7 49.8 50.5 51.1 51.6 52.0 52.6 53.1 53.6 54.2 54.7 55.3 55.9 Real Per Capita Income (12$) 46.1 46.0 46.4 46.7 47.0 47.1 47.4 47.7 47.9 48.2 48.4 48.7 48.9 Average Annual Wage (Ths) 54.8 55.1 55.3 55.6 55.8 56.1 56.4 56.7 57.2 57.6 58.2 58.7 59.3 Pct Chg Year Ago 3.5 3.7 2.1 1.5 1.9 1.7 2.0 2.1 2.4 2.8 3.2 3.6 3.7
Establishment Employment (Place of Work, Thousands, SA)
Total Employment 182.2 183.2 185.0 186.1 187.0 187.7 188.8 189.5 190.0 190.4 190.9 191.4 192.0 Pct Chg Year Ago 2.5 2.3 2.7 2.8 2.6 2.5 2.1 1.8 1.6 1.4 1.1 1.0 1.1 Manufacturing 3.6 3.6 3.6 3.6 3.6 3.6 3.6 3.6 3.6 3.5 3.5 3.5 3.5 Pct Chg Year Ago 4.0 2.3 2.4 0.4 0.2 0.1 -0.3 0.3 -0.3 -0.9 -1.4 -1.8 -2.0 Nonmanufacturing 178.6 179.7 181.4 182.5 183.4 184.1 185.2 185.9 186.4 186.9 187.4 187.9 188.5 Pct Chg Year Ago 2.5 2.3 2.8 2.9 2.7 2.5 2.1 1.9 1.6 1.5 1.2 1.1 1.1 Construction & Mining 8.4 8.3 8.3 8.2 8.2 8.1 8.0 8.0 7.9 7.9 7.8 7.8 7.8 Pct Chg Year Ago 1.6 -0.8 0.0 -2.8 -2.8 -2.5 -2.7 -3.2 -3.3 -3.2 -2.6 -1.7 -1.0 Trade, Trans, & Utilities 24.2 23.9 23.5 23.4 22.9 22.7 23.1 22.9 22.9 22.6 22.1 22.0 21.9 Pct Chg Year Ago 2.8 -0.1 -2.0 -2.2 -5.5 -4.9 -2.1 -1.8 0.2 -0.3 -4.1 -4.2 -4.4 Wholesale Trade 3.8 3.8 3.8 3.9 3.9 4.0 4.0 4.0 4.1 4.2 4.2 4.3 4.3 Retail Trade 17.9 17.6 17.2 17.0 16.4 16.2 16.6 16.4 16.3 15.9 15.3 15.1 15.0 Trans, Wrhsng, & Util 2.4 2.5 2.5 2.5 2.5 2.5 2.5 2.5 2.5 2.5 2.6 2.6 2.6 Information 3.2 3.3 3.3 3.3 3.3 3.3 3.3 3.4 3.5 3.5 3.5 3.5 3.5 Pct Chg Year Ago 5.8 9.8 8.0 6.8 2.8 1.1 2.2 2.5 4.7 5.6 5.4 3.9 0.9 Financial Activities 7.8 7.8 7.9 8.1 8.1 8.2 8.2 8.3 8.3 8.4 8.5 8.5 8.6 Pct Chg Year Ago 3.1 2.6 5.3 4.5 4.2 5.7 3.6 2.4 2.7 2.4 3.2 3.1 2.7 Prof & Business Services 21.9 22.6 22.9 23.0 23.2 23.3 23.1 23.0 23.1 23.4 23.7 23.9 24.1 Pct Chg Year Ago -4.8 -1.5 2.5 4.9 5.7 3.2 1.2 0.2 -0.2 0.4 2.4 3.5 4.1 Educ & Health Services 25.6 25.9 26.4 26.5 26.2 26.1 25.9 25.8 25.8 26.1 26.3 26.6 26.7 Pct Chg Year Ago 4.9 5.6 7.3 4.4 2.1 0.7 -2.0 -2.3 -1.2 0.1 1.6 2.8 3.2 Leisure & Hospitality 19.3 18.9 19.0 19.1 20.4 20.9 22.0 22.7 22.9 23.0 23.1 23.2 23.3 Pct Chg Year Ago 18.7 11.5 -1.4 1.1 5.7 10.7 15.7 18.7 12.6 9.7 5.4 2.1 1.6 Other Services 9.5 9.7 10.1 10.5 10.6 10.6 10.5 10.5 10.5 10.6 10.8 10.9 11.0 Pct Chg Year Ago 6.7 6.6 10.1 13.4 11.2 8.7 3.3 -0.1 -0.4 0.6 2.8 3.9 4.7 Federal Government 2.1 2.2 2.2 2.2 2.3 2.3 2.3 2.3 2.3 2.3 2.3 2.3 2.3 Pct Chg Year Ago -1.6 1.6 5.3 7.4 5.8 4.9 3.7 2.7 1.6 1.2 0.9 0.8 0.7 State & Local Government 56.6 57.1 57.7 58.2 58.5 58.7 58.8 59.0 59.1 59.1 59.2 59.3 59.3 Pct Chg Year Ago -1.0 0.1 2.8 2.7 3.3 2.7 1.8 1.3 1.0 0.8 0.7 0.4 0.4
Other Economic Indicators
Population (Ths) 384.5 384.3 384.0 383.4 382.9 382.6 382.4 382.3 382.6 383.0 383.5 384.0 384.5 Pct Chg Year Ago 0.1 0.1 -0.1 -0.3 -0.4 -0.4 -0.4 -0.3 -0.1 0.1 0.3 0.4 0.5 Labor Force (Ths) 200.5 201.7 202.7 203.2 203.5 203.6 203.8 203.7 203.7 203.5 203.8 204.1 204.5 Pct Chg Year Ago 6.1 5.0 3.5 2.5 1.5 0.9 0.5 0.3 0.1 0.0 0.0 0.2 0.4 Unemployment Rate (%) 5.1 4.9 4.9 4.8 4.6 4.3 4.3 4.1 4.1 3.8 3.7 3.6 3.3 Total Housing Starts 2654.9 2470.3 2288.2 2193.9 2131.7 2118.9 2078.7 2102.2 2093.0 2056.0 2032.7 2026.5 1991.3 Single-Family 1381.2 1337.6 1322.6 1302.9 1298.4 1301.1 1276.2 1284.8 1270.1 1230.3 1219.0 1221.6 1196.8 Multifamily 1273.8 1132.7 965.6 890.9 833.2 817.8 802.6 817.4 822.9 825.6 813.7 804.9 794.4
PROFILES
The Tampa–St. Petersburg–Clearwater MSA is comprised of Hernando, Hillsborough, Pasco, and Pinellas counties. Located centrally on the west coast of Florida, this region includes Tarpon Springs, Sponge Docks, Ybor City, Bush Gardens, the University of South Florida, and the University of Tampa. The Tampa Bay Buccaneers and the Tampa Bay Rays call this region home.
QUICK FACTS
Census Bureau). • Pasco County population estimate of 553,947 as of 2019 (5-Year Estimate) (U.S. Census Bureau). • Pinellas County population estimate of 974,996 as of 2019 (5-Year Estimate) (U.S. Census
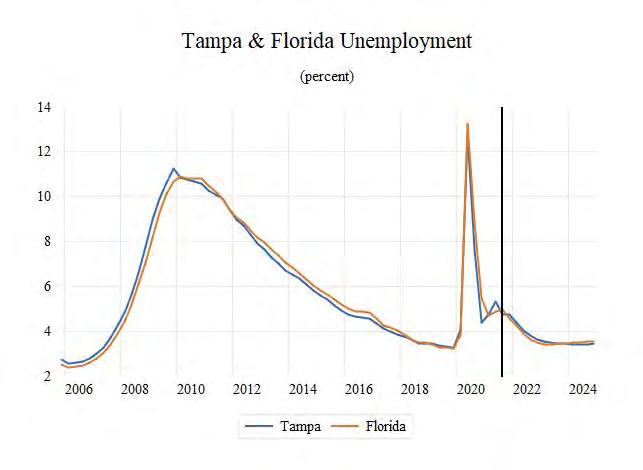
Bureau). • Civilian labor force of 1,647,335 in August 2021 (Florida Research and Economic Database). • An unemployment rate of 4.5% as of August 2021, not seasonally adjusted. This amounts to 73,499 unemployed people (Florida Research and Economic Database).
• OUTLOOK SUMMARIES
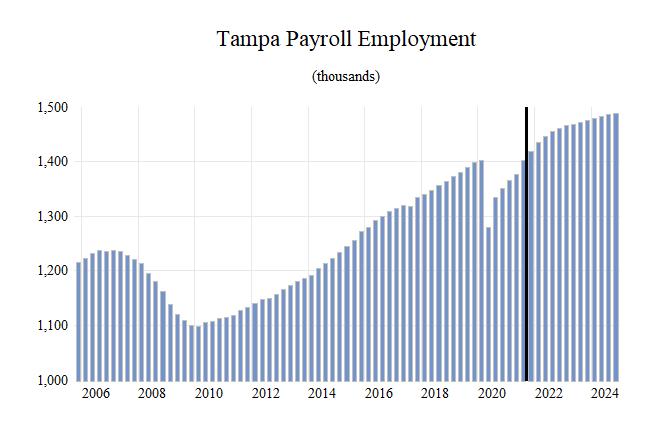
The Tampa—St. Petersburg—Clearwater Metropolitan Statistical Area (MSA) is expected to show high levels of growth in the economic indicators relative to the other MSAs studied. The Tampa MSA will contribute the second-highest level of Gross Metro Product in the state at $161,489.20 million. Average annual wage growth of 3.3 percent will give the MSA the fifth-highest annual wage in the state at $67,100. Personal income growth of 4.1 percent, ranking seventh in the state, will place the per capita income level at $49,600. Tampa will experience modest population growth of 1.0 percent.
Employment growth is expected to average 2.6 percent annually. The MSA’s unemployment rate should average 3.9 percent.
The fastest growing sector in the Tampa area will be the Leisure & Hospitality sector with an average annual growth rate of 8.5 percent. This is followed by the Other Services sector with an average annual growth rate of 6.9 percent, The Information Sector at 4.1%, and the Professional & Business Services sector at 3.6 percent. The Trade, Transportation, and Utilities sector is expected grow at an average annual growth rate of 0.2 percent.
METRO NEWS SUMMARIES
Tourism is booming around Tampa Bay for the July 4th weekend
• Hotels in the Tampa Bay area are projected to have a record July 4th weekend, as tourism officials in both Hillsborough and Pinellas Counties are reporting increasing hotel occupancy rates and average room prices. • Visit St. Pete/Clearwater, Pinellas County’s tourism agency, reported a weekly average occupancy rate of 84%, a figure that is 6% higher from the same time period in 2019. The average price of hotel rooms and vacation rentals has climbed $48 since 2019 to $194.14, based on June data. • Steve Hayes, president and CEO of Visit St.
Pete/Clearwater, commented, “I started looking at the data, and I’m like holy cow…We expect to blow even the 2019 July 4 weekend out of the water, and that was record-breaking.” Source: The Tampa Bay Times, July 2, 2021
Tampa Bay’s rent rising faster than any other metro area this year
• Scorching demand for Tampa Bay residential housing continues its relentless trend upward, as the average asking price for rental units in the area have outpaced all other metro areas in the country. • The average rent price in Tampa Bay has grown at a rate of 15.6% in the first six months of 2021, according to data from national real estate firm
CoStar. This translates into an average price increase of $1,058 to $1,223 for a standard 750-square-foot unit. • Other notable metros with high 2021 rent hikes
in CoStar’s report include 15.3 percent in Austin,
Texas; 14.9 percent in Raleigh; 14.5 percent in
Orlando and 13.7 percent in Phoenix. Source: The Tampa Bay Times, July 19, 2021
Tampa Bay is a leading metro in small business employment
• The Tampa Bay labor market has shown signs of strength in its recovery from the COVID-19 pandemic, as the Tampa metropolitan area was placed among the top two metro areas in the country for both job growth and small business payrolls. • The Small Business Jobs Index, released by payroll firm Paychex, came in at 102.53 for the month of July in Tampa Bay, with the Dallas metro area being the only other city in the United
States with an index level above 102. • The Small Business Jobs Index sits at 99.36 for the United States as a whole, following its largest one-month gain since 2010 in July. The index has gained over 1% during the second quarter of 2021 and over 5% since last year’s data. Source: The Tampa Bay Times, August 4, 2021
Tampa Electric reaches settlement on rate increases
• The largest utility company in the Tampa Bay area has completed a settlement deal with the
Office of Public Council, the Florida Industrial
Power Users Group, and a variety of other public and private agencies to raise base electricity rates through 2025. • If the deal is approved by the Florida Public
Service Commission, residential consumers could see their utility bills increase by as much as 14% starting in January 2022. This base rate increase comes on top of a recent temporary price increase due to higher natural gas prices. • Tampa Energy Co. projects approximately $300 million in additional revenue from the price hikes and plans to reinvest those funds in modernizing infrastructure and expanding solar energy options to customers. Source: The Tampa Bay Times, August 6, 2021
Tampa International Airport exceeds Labor Day travel expectations
• Though summer may now be over, tourism traffic remains high through Tampa International
Airport, as Labor Day passenger volume grew 8.3% from approximately 49,000 in 2019 to 54,000 in 2021, another encouraging sign that the COVID-19 pandemic’s effects are fading on the Tampa-area economy. • Tampa International’s travel infrastructure plays a key role in supporting the rapid growth that
Tampa Bay’s economy has experienced during the past decade. The airport lost approximately $75 million due to pandemic lockdowns. • Airport officials are projecting 32% year-overyear growth in passenger volumes during the airport’s 2022 fiscal year, with optimism that
COVID-related lockdowns will remain in the past. Fiscal year 2022 revenues are projected to grow by $51.2 million. Source: Tampa Bay Business Journal, September 9, 2021
Cruising is back in Tampa Bay with first ship in 18 months
• Major cruise lines are returning services to Port
Tampa Bay this October, as the Royal Caribbean
Group is launching the first cruise ship to leave the port since the pre-COVID era, albeit at limited capacity. • The return of cruises to Tampa Bay has been a highly anticipated event for the local economy, which relies heavily on both personal and business tourism spending. Analysis firm
Business Research & Economic Advisor estimates that a ship with 3,000 passengers contributes an average of $334,000 to the departing city. • Port Tampa Bay, which relies on cruise lines for around 20% of revenues, lost $7.5 million in 2020 when compared to 2019 revenues. One positive takeaway for port officials: 2022 cruise sales are on track to beat 2019 sales, according to AAA. Source: The Tampa Bay Times, September 16, 2021
Tampa -St. Petersburg -Clearwater Industry Loca�on Quo�ents
Total Nonagricultural Employment
Total Private
Goods Producing
Service Producing
Private Service Providing
Mining, Logging, and Construc�on
Manufacturing
Trade, Transporta�on, and U�li�es
Wholesale Trade
Retail Trade
Transporta�on, Warehousing and U�li�es
Informa�on
Financial Ac�vi�es
Professional and Business Services
Educa�onal and Health Services
Leisure and Hospitality
Other Services
Government
0 0.2 0.4 0.6 0.8 1 1.2 1.4


Long Term Outlook for Tampa-St. Petersburg-Clearwater, FL December 2021 Forecast
2016 2017 2018 2019 2020 2021 2022 2023 2024
Personal Income (Billions $)
Total Personal Income Pct Chg Year Ago Wages and Salaries Nonwage Income Real Personal Income (12$) Pct Chg Year Ago Per Capita Income (Ths) Real Per Capita Income (12$) Average Annual Wage (Ths) Pct Chg Year Ago 133.9 141.7 149.6 157.4 169.6 182.9 183.9 190.8 199.1 3.6 5.9 5.5 5.2 7.8 7.8 0.5 3.8 4.3 67.7 70.6 74.8 79.5 82.9 90.9 96.9 100.3 104.2 66.2 71.1 74.8 77.9 86.7 92.1 87.0 90.5 94.8 131.7 138.0 141.8 146.3 155.9 162.3 158.7 161.7 165.4 3.2 4.8 2.7 3.2 6.5 4.1 -2.3 1.9 2.2 44.3 46.1 48.0 50.0 53.3 56.9 56.6 58.1 60.0 43.6 44.9 45.5 46.4 48.9 50.5 48.8 49.2 49.8 51.8 53.0 54.9 56.9 61.2 64.8 66.3 67.7 69.7 1.8 2.3 3.5 3.7 7.7 5.7 2.3 2.1 2.9
Establishment Employment (Place of Work, Thousands, SA)
Total Employment 1295.0 1321.1 1351.8 1385.3 1342.1 1390.7 1449.3 1470.3 1484.0 Pct Chg Year Ago 3.5 2.0 2.3 2.5 -3.1 3.6 4.2 1.5 0.9
Manufacturing Pct Chg Year Ago Nonmanufacturing Pct Chg Year Ago Construction & Mining Pct Chg Year Ago Trade, Trans, & Utilities Pct Chg Year Ago
64.8 66.4 67.2 68.9 67.1 67.4 68.2 68.3 67.5 3.9 2.4 1.3 2.5 -2.7 0.5 1.2 0.1 -1.1 1230.1 1254.7 1284.6 1316.3 1275.0 1323.2 1381.1 1402.0 1416.5 3.5 2.0 2.4 2.5 -3.1 3.8 4.4 1.5 1.0 70.6 73.9 78.3 81.9 83.7 86.4 85.7 84.9 84.9 8.6 4.7 6.0 4.6 2.3 3.1 -0.8 -0.8 -0.1 246.7 247.2 249.2 252.6 248.9 256.8 257.9 256.7 251.1 3.1 0.2 0.8 1.3 -1.4 3.2 0.4 -0.4 -2.2
Wholesale Trade Retail Trade Trans, Wrhsng, & Util Information Pct Chg Year Ago
51.3 52.1 53.1 54.2 54.5 55.8 59.8 62.1 63.8 161.7 160.0 160.3 158.7 153.3 157.6 151.9 147.6 139.5 33.7 35.1 35.8 39.6 41.1 43.4 46.2 47.1 47.8 25.5 25.1 25.6 25.5 24.2 25.0 27.0 27.4 28.4 -1.0 -1.7 1.8 -0.1 -5.1 3.2 8.0 1.5 3.7
Financial Activities Pct Chg Year Ago Prof & Business Services Pct Chg Year Ago Educ & Health Services Pct Chg Year Ago Leisure & Hospitality Pct Chg Year Ago Other Services Pct Chg Year Ago Federal Government Pct Chg Year Ago State & Local Government Pct Chg Year Ago 107.7 112.6 116.8 121.7 124.2 127.0 135.7 136.9 139.3 3.4 4.5 3.8 4.1 2.1 2.2 6.8 0.9 1.7 230.0 235.7 241.7 248.5 248.4 262.5 278.4 279.0 286.3 5.4 2.5 2.5 2.8 0.0 5.7 6.1 0.2 2.6 199.8 205.2 210.9 218.6 213.3 214.3 222.9 222.8 226.6 2.6 2.7 2.8 3.7 -2.4 0.5 4.0 -0.1 1.7 149.2 153.2 158.9 162.7 133.0 150.5 162.6 180.2 183.9 3.2 2.6 3.8 2.4 -18.2 13.2 8.0 10.8 2.0 45.1 45.7 46.8 47.5 43.7 48.7 54.4 56.0 56.8 3.9 1.3 2.6 1.4 -7.9 11.3 11.7 3.0 1.5 24.3 24.8 25.2 26.7 28.3 27.9 27.9 28.0 28.2 3.1 1.9 1.9 5.8 6.2 -1.5 0.0 0.3 0.8 131.3 131.4 130.9 130.6 127.1 124.1 128.6 130.0 130.9 1.1 0.1 -0.4 -0.3 -2.7 -2.3 3.6 1.1 0.7
Other Economic Indicators
Population (Ths) Pct Chg Year Ago Labor Force (Ths) Pct Chg Year Ago Unemployment Rate (%) Total Housing Starts Single-Family Multifamily
3021.1 3072.1 3113.6 3150.2 3185.3 3213.6 3250.8 3285.7 3318.0 2.0 1.7 1.4 1.2 1.1 0.9 1.2 1.1 1.0 1481.0 1504.2 1524.6 1555.2 1548.2 1615.7 1670.8 1688.3 1694.2 2.3 1.6 1.4 2.0 -0.5 4.4 3.4 1.0 0.3 4.6 4.1 3.6 3.4 7.2 4.9 4.0 3.5 3.4 17121.4 17600.0 16718.9 21489.1 20396.7 24163.7 20636.6 20769.2 20374.8 11034.8 12732.3 13676.8 14896.0 15675.0 19362.3 16751.3 15471.8 14852.8 6086.6 4867.8 3042.1 6593.1 4721.7 4801.5 3885.4 5297.4 5522.0


