12 minute read
Ocala .........................................................................................................85


Short Term Outlook for Ocala, FL December 2021 Forecast
2021:Q4 2022:Q1 2022:Q2 2022:Q3 2022:Q4 2023:Q1 2023:Q2 2023:Q3 2023:Q4 2024:Q1 2024:Q2 2024:Q1 2024:Q2
Personal Income (Billions $)
Total Personal Income 16.2 16.3 16.5 16.7 16.9 17.0 17.2 17.4 17.7 17.9 18.1 18.3 18.5
Pct Chg Year Ago Wages and Salaries
5.0 -8.5 0.2 2.9 4.1 4.7 4.4 4.3 4.5 4.9 4.7 4.7 4.8 5.6 5.7 5.8 5.8 5.9 5.9 6.0 6.1 6.1 6.2 6.2 6.3 6.4 Nonwage Income 10.6 10.6 10.7 10.9 11.0 11.1 11.2 11.4 11.5 11.7 11.8 12.0 12.1 Real Personal Income (12$) 15.3 15.2 15.4 15.5 15.6 15.7 15.8 15.9 16.0 16.1 16.2 16.3 16.4 Pct Chg Year Ago 0.3 -12.1 -2.8 0.6 2.2 2.8 2.5 2.4 2.7 2.9 2.7 2.6 2.6 Per Capita Income (Ths) 41.7 41.6 42.1 42.5 42.8 42.9 43.3 43.7 44.1 44.4 44.8 45.2 45.6 Real Per Capita Income (12$) 39.2 39.0 39.2 39.5 39.5 39.5 39.6 39.8 40.0 40.1 40.2 40.3 40.5 Average Annual Wage (Ths) 50.7 51.1 51.2 51.4 51.7 51.9 52.2 52.5 52.9 53.3 53.8 54.3 54.8 Pct Chg Year Ago 3.5 3.5 1.7 1.3 1.8 1.6 1.9 2.0 2.4 2.7 3.2 3.6 3.7
Establishment Employment (Place of Work, Thousands, SA)
Total Employment 109.9 110.6 112.2 113.0 113.6 114.0 114.9 115.3 115.5 115.5 115.4 115.4 115.4 Pct Chg Year Ago 2.1 2.3 3.9 4.2 3.3 3.0 2.4 2.0 1.7 1.4 0.5 0.1 0.0 Manufacturing 10.3 10.3 10.5 10.5 10.5 10.6 10.6 10.5 10.5 10.5 10.4 10.3 10.2 Pct Chg Year Ago 5.1 4.7 6.5 3.5 2.6 2.2 0.5 0.2 -0.3 -1.0 -1.8 -2.3 -2.6 Nonmanufacturing 99.6 100.3 101.7 102.5 103.0 103.4 104.3 104.7 105.0 105.1 105.0 105.1 105.2 Pct Chg Year Ago 1.8 2.1 3.7 4.3 3.4 3.1 2.6 2.2 1.9 1.6 0.7 0.4 0.2 Construction & Mining 8.7 8.7 8.7 8.7 8.6 8.5 8.5 8.4 8.3 8.3 8.3 8.2 8.2 Pct Chg Year Ago -0.6 -1.5 -0.3 -1.4 -1.5 -2.0 -2.5 -3.3 -3.3 -3.2 -2.5 -1.7 -1.0 Trade, Trans, & Utilities 27.4 27.2 27.3 27.3 27.0 26.9 27.3 27.2 27.2 26.9 26.4 26.2 26.0 Pct Chg Year Ago 0.8 0.0 1.4 1.1 -1.4 -1.1 -0.1 -0.6 0.6 0.1 -3.2 -3.7 -4.1 Wholesale Trade 4.2 4.2 4.4 4.5 4.6 4.6 4.7 4.7 4.7 4.8 4.9 4.9 4.9 Retail Trade 16.6 16.3 16.2 16.0 15.6 15.5 15.9 15.8 15.8 15.4 14.8 14.5 14.4 Trans, Wrhsng, & Util 6.6 6.7 6.7 6.8 6.8 6.8 6.7 6.7 6.7 6.7 6.8 6.8 6.8 Information 0.5 0.5 0.5 0.6 0.6 0.6 0.6 0.6 0.6 0.6 0.6 0.6 0.6 Pct Chg Year Ago 7.1 12.6 7.9 8.5 4.5 3.5 4.8 4.8 8.4 9.3 9.0 7.2 3.8 Financial Activities 3.8 3.9 4.0 4.1 4.1 4.2 4.2 4.2 4.3 4.3 4.4 4.4 4.4 Pct Chg Year Ago -1.2 2.2 8.0 8.7 8.2 7.7 5.2 3.5 3.6 2.9 3.7 3.7 3.2 Prof & Business Services 9.9 10.3 10.4 10.5 10.6 10.7 10.6 10.6 10.7 10.8 10.9 11.0 11.0 Pct Chg Year Ago -2.7 0.8 4.5 6.2 6.4 3.9 1.8 1.4 1.1 1.3 2.7 3.2 3.4 Educ & Health Services 18.8 19.1 19.7 19.9 19.8 19.8 19.8 19.8 19.9 20.1 20.4 20.6 20.7 Pct Chg Year Ago 2.7 3.8 7.0 8.2 5.4 3.9 0.5 -0.2 0.7 1.6 3.0 3.9 4.1 Leisure & Hospitality 13.0 12.9 13.1 13.2 14.0 14.2 14.8 15.2 15.3 15.2 15.2 15.1 15.0 Pct Chg Year Ago 13.2 9.6 4.9 4.6 7.7 10.1 13.3 14.9 9.2 6.8 2.5 -0.8 -1.5 Other Services 3.1 3.2 3.3 3.5 3.5 3.5 3.5 3.6 3.6 3.6 3.7 3.7 3.8 Pct Chg Year Ago 11.5 12.2 15.8 17.7 15.1 12.0 6.2 2.5 2.0 2.4 3.9 4.7 5.1 Federal Government 0.8 0.8 0.8 0.8 0.8 0.8 0.8 0.8 0.8 0.8 0.8 0.8 0.8 Pct Chg Year Ago -11.1 -5.1 -1.7 8.1 6.2 5.0 3.3 1.9 0.5 -0.3 -0.7 -1.0 -1.1 State & Local Government 13.6 13.7 13.8 13.9 14.1 14.1 14.2 14.3 14.4 14.4 14.4 14.5 14.5 Pct Chg Year Ago -2.5 -1.6 1.1 2.6 3.0 3.1 2.9 2.6 2.1 1.8 1.6 1.2 1.0
Other Economic Indicators
Population (Ths) 389.0 390.7 392.3 393.6 394.9 396.4 398.1 399.7 400.9 402.0 403.3 404.5 405.7 Pct Chg Year Ago 2.0 2.0 1.9 1.6 1.5 1.5 1.5 1.5 1.5 1.4 1.3 1.2 1.2 Labor Force (Ths) 148.4 149.9 150.7 150.9 150.8 150.6 150.3 150.4 150.3 150.0 149.9 149.8 149.8 Pct Chg Year Ago 6.2 4.4 3.3 2.9 1.6 0.4 -0.2 -0.3 -0.3 -0.3 -0.3 -0.4 -0.4 Unemployment Rate (%) 6.0 5.8 5.7 5.6 5.4 5.1 5.1 5.1 5.1 5.0 5.1 5.1 4.9 Total Housing Starts 5268.4 4716.2 4349.2 4065.6 3906.4 3732.3 3553.8 3504.6 3469.9 3383.3 3323.7 3313.1 3271.2 Single-Family 5243.9 4658.6 4264.9 3915.2 3709.1 3502.9 3342.8 3308.6 3273.8 3187.5 3131.5 3123.6 3086.3 Multifamily 24.5 57.6 84.3 150.5 197.3 229.5 211.1 196.0 196.1 195.9 192.2 189.5 184.9
PROFILES
The Orlando–Kissimmee–Sanford MSA is comprised of Lake, Orange, Osceola and Seminole Counties. Located in the southern center of the state, this area is home to numerous tourist attractions such as Walt Disney World, Universal Studios and Sea World. It is also home to the Orlando Magic and the Orlando City Soccer Club. Orlando hosts many conventions utilizing some of the biggest hotels in the country and America’s second largest convention center. The University of Central Florida, the nation’s second largest university, and many other places of higher education also reside in the MSA.
QUICK FACTS
• Metro population estimate of 2,508,970 as of 2019 (5-Year Estimate) (U.S. Census Bureau). • Lake County population estimate of 367,118 as of 2019 (5-Year Estimate) (U.S. Census Bureau). • Orange County population estimate of 1,393,452 as of 2019 (5-Year Estimate) (U.S. Census
Bureau). • Civilian labor force of 1,348,628 in August 2021 (Florida Research and Economic Database). • An unemployment rate of 5.0% as of August 2021, not seasonally adjusted. This amounts to 67,618 unemployed people (Florida Research and
Economic Database).
OUTLOOK SUMMARIES
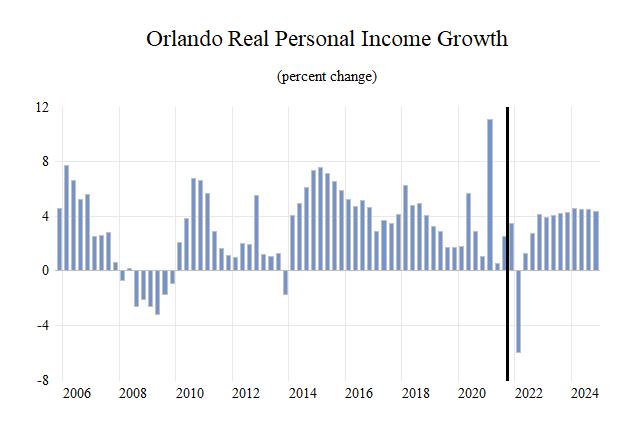
The Orlando—Kissimmee Metropolitan Statistical Area (MSA) is expected to show moderate growth in the economic indicators studied in this forecast. The MSA’s Gross Metro Product level will be at $134,156.13 million, the fourth highest in the state. Average annual wage growth of 2.9 percent will push the average annual wage level to $63,700. The per capita income level of $44,000 will be boosted by personal income growth of 4.6 percent. Population growth will be 1.4 percent.
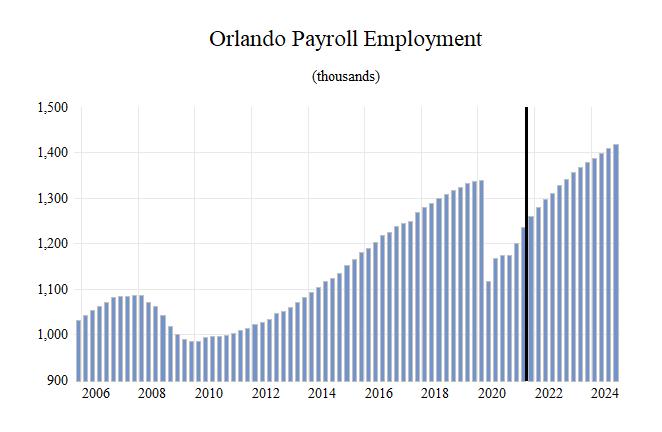
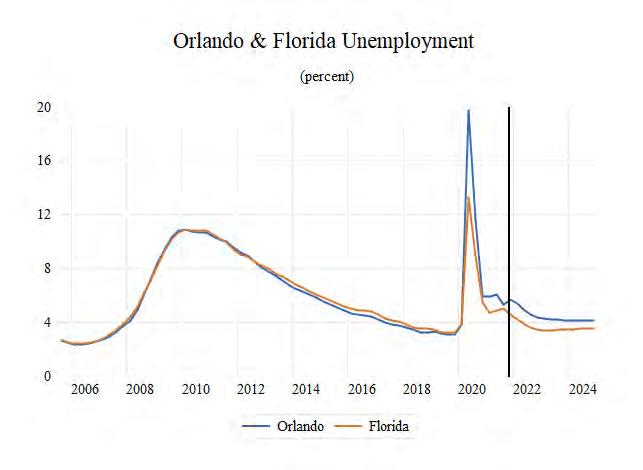
The Orlando MSA will experience the highest average employment growth rate in the state at 4.0 percent annually. Orlando’s unemployment rate should average 4.7 percent.
Leisure & Hospitality is expected to be the fastest growing sector in the area, averaging 10.1 percent growth annually. The Other services sector will see the second-highest average annual growth rate at 6.4 percent, followed by the Professional and Business Services sector at 5.9 percent. Manufacturing will increase slightly growing at an average annual rate of 0.3 percent and Trade, Transportation and Utilities will see growth of 0.2 percent.
METRO NEWS SUMMARIES
Orlando recommending even fully vaccinated wear masks indoors as Covid-19 cases surge amid summer travel boom
• Orange County Mayor Jerry Demings will not institute a mask mandate but is strongly recommending that all people in Orlando wear masks indoors. • Daily cases in the County have doubled from 200 in the previous week to 400. Dr. Raul Pino of the Florida DOH said 100% of the cases and deaths reported Sunday are from unvaccinated people. • Pino stressed the importance of vaccination, and that the vaccine is free and easily accessible.
Currently, 52% of Orange County residents are fully vaccinated. Source: Forbes, July 13, 2021
Disney regional campus coming to Lake Nona • A new Disney regional hub in Orlando’s
Lake Nona community will be home to more than 2,000 professional jobs relocating from
California. • The average wage for the positions is $120,000 annually, according to Tim Giuliani, Orlando
Economic Partnership president and CEO. • The move to the Orlando campus is expected to take place through the end of next year. The company did not release a specific location or opening date. Source: Lake Nona, July 16, 2021
‘Getting Vaccinated is the Way Out’: Advent Health Treating Record Number of COVID Patients
• Dr. Eduardo Olivera, the executive medical director for Advent Health critical care services, explained, “...this is the highest number of patients that we’ve treated with COVID so far…
It’s definitely putting a certain level of strain on the system…” • Last week, the hospital upgraded to black status, which means it is deferring all nonemergency surgeries to free up resources and staff for the expected influx of COVID patients. • As of Thursday, Orlando Health officials said there are 573 in-house COVID-positive patients and 91% of patients are in the intensive care unit.
Approximately 90% of the COVID inpatients are unvaccinated. Source: Click Orlando, August 5, 2021
Residents in Orlando, Florida Urged to Use Less Water as COVID Cases Rise
• Orlando Mayor Buddy Dyer urged residents to reduce water usage because the chemical liquid oxygen, which is used to treat water, is now in high demand for treating COVID hospitalizations, causing a regional shortage. • Residents need to cut back on water use, particularly for irrigating lawns and plants and washing vehicles, Dyer said. If use does not decrease, he warned, water quality could suffer.
• Dyer blamed the unvaccinated for putting the city in a position of having to face water quality issues. Florida’s comparatively low vaccination rate correlates to its higher rate of Covid-19 infection. Source: NBC News, August 20, 2021
Orlando tourism officials expect Labor Day weekend to Be Busier Than in 2019
• Officials expect a better tourism weekend than in 2019, when Hurricane Dorian was expected to hit Florida as a major hurricane, suppressing demand. • Officials expressed optimism that no major health, weather, or otherwise uncertain events would decrease demand for tourism. • Visit Orlando is optimistic for fall after a strong summer, Chief Marketing Officer Danielle
Hollander explained, “Americans couldn’t go overseas. Cruises had not really started, so this was the time that a lot of that pent-up demand was being realized, so we had a really great
Summer.” Source: Click Orlando, September 2, 2021
Mayor: Unvaccinated workers to get reprimands, not fired
• Orange County Mayor Jerry Demings said that unvaccinated employees of the county will receive written reprimands rather than firings.
COVID-19 vaccination is required for all county workers. • Some county employees, particularly firefighters, have pushed back against the mayor’s July mandate requiring county workers receive the first shot by the end of September. • Currently, over 500 of 1,456 fire department employees are either unvaccinated or have not reported their vaccine status. • Mayor Demings still considers the mandate a success, as the vaccination rate for county employees currently stands at 84%. Source: News 4 Jax, September 25, 2021
Orlando -Kissimmee -Sanford MSA Industry Loca�on Quo�ents
Total Nonagricultural Employment
Total Private
Goods Producing
Service Producing
Private Service Providing
Mining, Logging, and Construc�on
Manufacturing
Trade, Transporta�on, and U�li�es
Wholesale Trade
Retail Trade
Transporta�on, Warehousing and U�li�es
Informa�on
Financial Ac�vi�es
Professional and Business Services
Educa�onal and Health Services
Leisure and Hospitality
Other Services
Government
0 0.2 0.4 0.6 0.8 1 1.2 1.4 1.6

Long Term Outlook for Orlando-Kissimmee-Sanford, FL December 2021 Forecast
2016 2017 2018 2019 2020 2021 2022 2023 2024
Personal Income (Billions $)
Total Personal Income Pct Chg Year Ago Wages and Salaries Nonwage Income Real Personal Income (12$) Pct Chg Year Ago Per Capita Income (Ths) Real Per Capita Income (12$) Average Annual Wage (Ths) Pct Chg Year Ago 98.9 106.5 113.3 119.3 127.3 136.3 138.0 144.3 152.1 4.7 7.7 6.4 5.3 6.7 7.1 1.2 4.6 5.4 59.0 62.9 67.6 71.6 70.6 75.7 82.3 87.5 92.7 39.9 43.6 45.7 47.6 56.6 60.7 55.7 56.8 59.3 97.3 103.0 107.1 110.6 116.7 120.7 118.8 122.1 126.1 3.6 5.8 4.0 3.3 5.5 3.4 -1.6 2.7 3.3 39.7 41.7 43.4 45.0 47.4 50.3 50.2 51.7 53.6 39.1 40.3 41.0 41.8 43.5 44.5 43.2 43.7 44.5 48.6 50.1 52.1 53.8 58.8 61.9 63.0 64.1 65.9 1.7 3.1 3.9 3.3 9.3 5.4 1.6 1.9 2.8
Establishment Employment (Place of Work, Thousands, SA)
Total Employment 1208.7 1249.6 1293.4 1327.3 1198.7 1216.6 1302.6 1360.5 1402.7 Pct Chg Year Ago 4.4 3.4 3.5 2.6 -9.7 1.5 7.1 4.4 3.1
Manufacturing Pct Chg Year Ago Nonmanufacturing Pct Chg Year Ago Construction & Mining Pct Chg Year Ago
42.5 44.4 46.6 49.3 48.5 47.3 48.4 49.1 49.1 3.7 4.4 5.0 5.9 -1.7 -2.4 2.2 1.5 0.0 1166.2 1205.2 1246.8 1278.0 1150.2 1169.2 1254.2 1311.4 1353.6 4.4 3.3 3.4 2.5 -10.0 1.7 7.3 4.6 3.2 68.3 74.3 82.2 86.1 83.5 84.9 84.2 83.5 85.0 12.0 8.7 10.7 4.8 -3.1 1.8 -0.9 -0.8 1.8
Trade, Trans, & Utilities Pct Chg Year Ago 227.7 233.2 239.5 242.8 228.4 232.6 234.7 234.4 229.9 3.0 2.4 2.7 1.4 -5.9 1.9 0.9 -0.1 -1.9
Wholesale Trade Retail Trade Trans, Wrhsng, & Util Information Pct Chg Year Ago
43.7 43.8 44.7 45.9 44.8 45.3 49.5 51.6 53.6 146.0 149.1 150.9 151.1 139.9 142.8 137.3 134.0 126.4 38.0 40.4 43.9 45.8 43.6 44.5 47.9 48.7 49.9 24.1 24.4 25.3 25.6 24.4 24.9 26.1 26.8 28.0 0.4 1.2 3.6 1.1 -4.4 1.8 4.8 2.8 4.5
Financial Activities Pct Chg Year Ago Prof & Business Services Pct Chg Year Ago Educ & Health Services Pct Chg Year Ago Leisure & Hospitality Pct Chg Year Ago Other Services Pct Chg Year Ago Federal Government Pct Chg Year Ago State & Local Government Pct Chg Year Ago
73.3 74.2 76.0 78.3 77.0 77.9 84.0 85.4 86.9 3.0 1.2 2.4 3.0 -1.7 1.2 7.8 1.7 1.7 207.5 220.6 229.8 235.8 217.4 216.9 243.9 257.6 272.0 6.5 6.3 4.2 2.6 -7.8 -0.3 12.5 5.6 5.6 148.3 152.2 155.5 160.7 157.3 162.3 172.2 172.6 175.7 3.5 2.6 2.1 3.4 -2.1 3.1 6.1 0.3 1.7 249.6 257.3 266.7 276.3 195.9 200.4 227.3 264.4 286.4 3.9 3.1 3.6 3.6 -29.1 2.3 13.4 16.4 8.3 44.0 43.8 44.3 44.8 39.5 43.0 48.3 49.9 50.6 7.3 -0.5 1.1 1.3 -11.8 8.7 12.5 3.2 1.4 14.0 14.6 14.7 14.7 15.3 15.1 15.0 15.1 15.3 8.2 4.5 0.7 -0.3 4.1 -1.2 -0.8 0.4 1.9 109.3 110.6 112.8 112.9 111.5 111.3 118.5 121.8 123.8 1.9 1.2 2.0 0.1 -1.2 -0.2 6.5 2.7 1.7
Other Economic Indicators
Population (Ths) Pct Chg Year Ago Labor Force (Ths) Pct Chg Year Ago Unemployment Rate (%) Total Housing Starts Single-Family Multifamily
2489.6 2555.3 2611.4 2649.3 2683.5 2711.7 2749.2 2791.2 2836.0 2.9 2.6 2.2 1.5 1.3 1.0 1.4 1.5 1.6 1263.3 1298.5 1331.7 1361.1 1315.1 1312.3 1388.4 1423.6 1453.8 3.1 2.8 2.6 2.2 -3.4 -0.2 5.8 2.5 2.1 4.5 3.9 3.4 3.2 10.3 5.8 4.8 4.2 4.1 21552.7 19207.7 24727.9 23794.6 23603.8 28160.0 29627.7 26579.7 25216.0 14623.7 14384.0 15905.5 15368.2 15185.7 17445.3 18745.5 18770.0 18374.7 6929.1 4823.7 8822.3 8426.4 8418.1 10714.7 10882.2 7809.7 6841.2


