
12 minute read
North Port–Sarasota–Bradenton................................................ 80


Short Term Outlook for North Port-Sarasota-Bradenton, FL December 2021 Forecast
2021:Q4 2022:Q1 2022:Q2 2022:Q3 2022:Q4 2023:Q1 2023:Q2 2023:Q3 2023:Q4 2024:Q1 2024:Q2 2024:Q1 2024:Q2
Personal Income (Billions $)
Total Personal Income 55.2 55.2 55.8 56.6 57.1 57.5 58.1 58.8 59.4 60.2 60.8 61.4 62.1
Pct Chg Year Ago Wages and Salaries
6.0 -8.6 -0.2 2.2 3.4 4.2 4.0 3.9 4.2 4.7 4.7 4.5 4.5 18.4 18.7 19.0 19.2 19.3 19.5 19.6 19.8 20.0 20.2 20.4 20.6 20.8 Nonwage Income 36.7 36.5 36.9 37.4 37.7 38.0 38.4 38.9 39.4 40.0 40.4 40.8 41.3 Real Personal Income (12$) 47.2 47.0 47.3 47.7 47.9 48.1 48.3 48.7 49.0 49.4 49.6 49.9 50.2 Pct Chg Year Ago 1.3 -12.1 -3.1 -0.1 1.6 2.3 2.1 2.1 2.3 2.7 2.7 2.4 2.3 Per Capita Income (Ths) 64.3 63.9 64.4 64.9 65.2 65.3 65.8 66.3 66.8 67.4 67.8 68.3 68.8 Real Per Capita Income (12$) 55.0 54.5 54.6 54.8 54.7 54.6 54.7 54.9 55.1 55.3 55.4 55.5 55.6 Average Annual Wage (Ths) 57.6 58.0 58.3 58.5 58.7 59.0 59.2 59.4 59.7 60.1 60.4 60.8 61.3 Pct Chg Year Ago 2.4 2.1 1.5 1.6 1.9 1.6 1.5 1.5 1.7 1.9 2.1 2.4 2.7
Establishment Employment (Place of Work, Thousands, SA)
Total Employment 318.6 321.0 324.2 326.0 327.6 328.9 330.4 332.2 333.7 334.9 335.7 336.6 337.3 Pct Chg Year Ago 5.4 5.6 5.1 4.2 2.8 2.5 1.9 1.9 1.9 1.8 1.6 1.3 1.1 Manufacturing 17.3 17.2 17.4 17.3 17.3 17.3 17.2 17.2 17.1 17.0 16.9 16.8 16.8 Pct Chg Year Ago 4.8 4.0 4.6 1.2 -0.1 0.3 -0.7 -0.8 -1.0 -1.6 -1.9 -1.9 -1.8 Nonmanufacturing 301.3 303.7 306.8 308.7 310.3 311.6 313.2 315.0 316.6 317.9 318.8 319.7 320.6 Pct Chg Year Ago 5.4 5.6 5.1 4.4 3.0 2.6 2.1 2.0 2.0 2.0 1.8 1.5 1.3 Construction & Mining 27.8 27.6 27.6 27.6 27.6 27.5 27.5 27.5 27.5 27.6 27.7 27.8 27.8 Pct Chg Year Ago 1.8 1.5 2.1 -0.2 -0.8 -0.4 -0.4 -0.3 -0.1 0.5 0.9 1.0 1.1 Trade, Trans, & Utilities 61.1 60.6 60.4 60.4 59.6 59.5 60.6 60.5 60.6 60.1 58.8 58.5 58.2 Pct Chg Year Ago 4.3 2.5 1.8 1.1 -2.4 -1.9 0.3 0.1 1.7 0.9 -3.1 -3.4 -4.1 Wholesale Trade 8.7 9.0 9.1 9.6 9.7 9.8 9.8 9.9 10.0 10.1 10.3 10.4 10.6 Retail Trade 44.9 44.0 43.5 42.8 41.8 41.4 42.5 42.3 42.3 41.5 39.9 39.4 38.9 Trans, Wrhsng, & Util 7.6 7.7 7.8 8.1 8.1 8.3 8.3 8.3 8.3 8.4 8.6 8.6 8.7 Information 3.6 3.7 3.7 3.8 3.7 3.8 3.8 3.8 3.9 3.9 4.0 4.0 3.9 Pct Chg Year Ago 3.4 6.5 6.8 5.0 1.8 1.9 3.3 1.4 4.2 4.3 3.9 3.6 2.0 Financial Activities 15.6 15.9 16.4 16.7 16.8 16.9 16.7 16.7 16.8 17.0 17.2 17.3 17.4 Pct Chg Year Ago -0.1 2.0 7.5 8.0 7.5 6.0 2.4 0.0 0.2 0.7 2.4 3.2 3.4 Prof & Business Services 48.0 50.0 51.1 51.2 51.4 51.7 51.5 51.6 51.8 52.3 52.8 53.1 53.2 Pct Chg Year Ago 9.4 8.0 7.8 6.8 7.0 3.4 0.8 0.7 0.9 1.1 2.6 2.9 2.7 Educ & Health Services 61.0 61.4 62.3 62.5 61.9 61.8 61.2 61.5 61.6 62.2 62.7 63.0 63.2 Pct Chg Year Ago 8.8 9.9 9.9 4.4 1.5 0.6 -1.8 -1.6 -0.4 0.7 2.5 2.5 2.6 Leisure & Hospitality 41.2 41.0 41.1 41.6 44.1 45.0 46.2 47.7 48.3 48.6 49.1 49.4 49.8 Pct Chg Year Ago 6.2 7.1 0.8 5.4 7.1 9.8 12.3 14.6 9.4 8.0 6.3 3.6 3.1 Other Services 14.8 15.0 15.5 16.0 16.1 16.2 16.1 16.1 16.2 16.4 16.5 16.7 16.8 Pct Chg Year Ago 5.1 6.0 5.4 9.5 8.9 7.7 3.8 1.1 0.9 1.1 2.5 3.3 3.7 Federal Government 2.0 2.0 2.0 2.0 2.0 2.0 2.0 2.0 2.0 2.0 2.1 2.1 2.1 Pct Chg Year Ago -7.6 -5.5 -1.0 5.0 2.1 1.4 1.1 1.0 1.2 1.6 1.7 1.6 1.6 State & Local Government 26.2 26.5 26.7 27.0 27.2 27.3 27.5 27.6 27.7 27.9 28.0 28.0 28.1 Pct Chg Year Ago 1.7 4.2 5.6 5.5 3.7 3.3 2.8 2.4 2.1 1.9 1.7 1.5 1.3
Other Economic Indicators
Population (Ths) 858.6 862.8 867.1 871.5 875.8 879.9 883.5 886.8 889.9 893.1 896.2 899.2 902.3 Pct Chg Year Ago 1.7 1.8 1.9 2.0 2.0 2.0 1.9 1.8 1.6 1.5 1.4 1.4 1.4 Labor Force (Ths) 391.2 395.6 398.3 400.4 402.1 403.3 404.4 405.2 405.8 406.0 406.4 406.9 407.7 Pct Chg Year Ago 8.5 7.4 5.7 3.9 2.8 1.9 1.5 1.2 0.9 0.7 0.5 0.4 0.5 Unemployment Rate (%) 4.8 4.5 4.1 3.9 3.7 3.7 3.6 3.6 3.6 3.6 3.6 3.6 3.7 Total Housing Starts 13805.212538.611204.410159.9 9422.0 8891.8 8504.0 8334.8 8239.6 8042.7 7868.4 7800.7 7652.5 Single-Family 11187.5 9927.2 8865.3 7997.0 7436.7 6997.1 6664.9 6538.5 6451.9 6266.9 6143.8 6119.4 6023.7 Multifamily 2617.7 2611.4 2339.1 2163.0 1985.3 1894.7 1839.1 1796.3 1787.7 1775.8 1724.6 1681.2 1628.8
PROFILES
Comprised of Marion County only, the Ocala MSA is located northwest of the Orlando area and is in the center of the state. The second largest national forest in Florida, the Ocala National Forest, and Silver Springs are two main outdoor attractions in the area.
QUICK FACTS
• Metro population estimate of 353,526 as of 2019 (5-Year Estimate) (U.S. Census Bureau). • Marion County population estimate of 365,579 as of 2019 (5-Year Estimate) (U.S. Census Bureau). • Civilian labor force of 146,753 in August 2021 (Florida Research and Economic Database). • An unemployment rate of 5.4% as of August 2021, not seasonally adjusted. This amounts to 7,885 unemployed people (Florida Research and
Economic Database).
OUTLOOK SUMMARIES
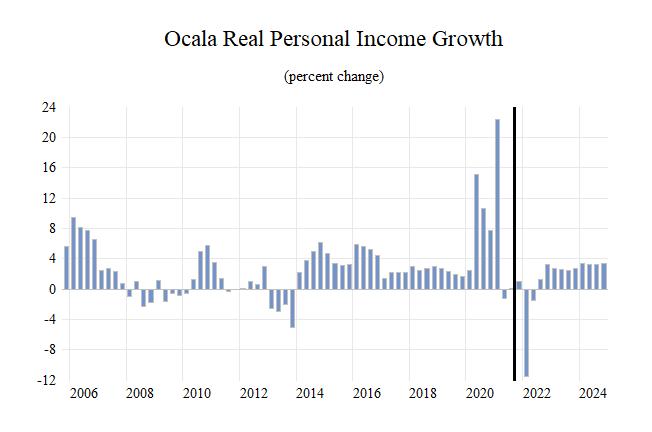
The Ocala Metropolitan Statistical Area (MSA) is expected to show weak levels of growth in its economic indicators. Ocala’s Gross Metro Product sits at the bottom of the list at a level of $10,369.83 million. Average annual wage growth of 3.4 percent will lead to an average annual wage of $52,000, the third-lowest level in the state. Personal incomes will grow by 4.1 percent, the sixth highest in the state. This will lead to a per capita income level of $40,200, the second lowest in the state. Population growth will average 1.6 percent.
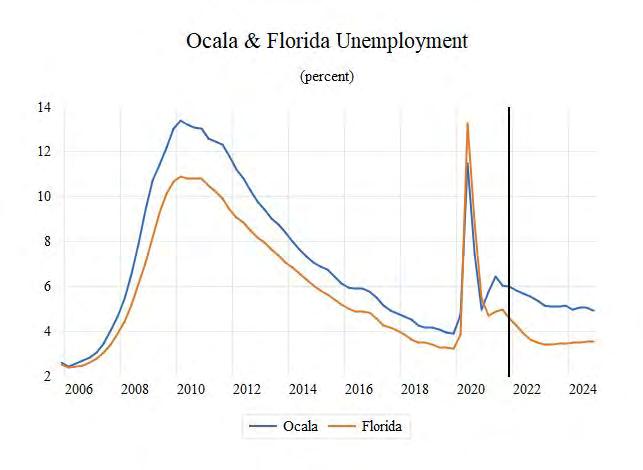
Employment growth is expected to average a rate of 2.2 percent annually. The unemployment rate is estimated to average 5.4 percent.
The Leisure & Hospitality sector will lead Ocala at an average annual growth rate at 6.9 percent. The Professional & Business Services sector and the other services sector will expand at respective rates of 2.8 percent and 7.4 percent.
METRO NEWS SUMMARIES
Ocala Regional Medical Breaks Ground on New $65 Million Expansion
• The new project will add a dedicated 36bed neurological intensive care unit, five new cardiovascular procedure suites, and significant renovations of dining space and laboratory facilities. • The new project will add over 46,091 square feet of new space, utilizing the remaining construction space on the campus. • After its expected completion in quarter three of 2022, the hospital will have an additional 36 beds to serve residents of the region. Source: Ocala-News, July 2, 2021
Marion Schools: Tentative Budget Soars to AllTime High of Nearly $700 Million
• The school’s tentative budget for 2021-22 is $105 million more than the 2019-20 budget. Its focus is on capital and operating costs. • Employee benefits will increase by $9.2 million from Gov. DeSantis’ teacher salary plan. The total operating budget of $434.3 million will pay 7,000 employees and suppliers. • The school millage rate was set to 6.903, 0.1150 less than in 2020, meaning taxpayers will pay $690.30 per $100,000 of taxable property value.
However, because of the recent rise in property values, homeowners may see an increase in their property tax. Source: Ocala Star-Banner, July 28, 2021
Marion County Still in Midst of Highest COVID-19 Spike as Thousands More Seek Vaccine
• Compared to the first week of July, in which 969 residents received the vaccine, 4,507 people received the vaccine in the first week of August. • According to county officials, the COVID positivity rate remains high at 27%, with the county averaging 343 daily cases.
• The full vaccination rate of Marion County residents is just under 44%. County DOH
Administrator Mark Lander commented on the
“many opportunities in Marion County to get the vaccine, which is a critical tool to prevent severe illness with COVID-19”. Source: Ocala News, August 10, 2021
House Sale Numbers Show Slight Cool-Down in Red Hot Housing Market
• The housing market appears to be cooling off as home sales in North Central Florida dipped slightly in July. • In Ocala, sales increased 18% compared to a 37.5% increase in July. • Ocala condos, on the other hand, are not exhibiting the same cooling effect. July sales rose by 18% with a median price of $136,000. Source: ABC20 WCJB, August 23, 2021
Anthony Sand Mine Denied
• During a Marion County Commission hearing about newly planned developments and business requests, a request for a 70-acre sand mine two miles east of the town of Anthony was denied. • Dozens of residents expressed concern about the project, citing the potential road damage and noise of dump trucks used for the sand. One resident said approval could set a precedent for future approval of mining operations on nearby properties. • Commissioners expressed doubts regarding the operations’ compatibility with the community, one adding that “…you’re bringing major commercial activity in and out of there on
Advent Health Celebrates New 12-Bed ER in Belleview
• The 13,000 square foot ER is the first in
Belleview providing access to 5,400 city residents and others who would have to travel to
Summerfield or Ocala. • The ER cost a total of $18 million and took 11 months to construct. Belleview Mayor
Dobkowski said the ER will be one of the biggest employers, with over 100 employees. • Dobkowski added that the ER will serve over 800 additional homes approved for construction and will create local economic activity at restaurants and other amenities. Source: Ocala Star Banner, September 30, 2021
College of Central Florida has issued $7.6 million in relief funds to students over 17 months
• The College of Central Florida has received $33.6 Million in COVID relief, 43% of which is earmarked for students to pay for things like health care, child care and living expenses • So far, the College has spent about half of the money, with $7.6 Million directed toward student needs and $10.9 Million on institutional needs • According to CF President Jim Henningsen, CF has so far eliminated the debt of 438 students Source: Ocala Star Banner, October 12, 2021
Marion Hospital District to fund $3.74M for CF nursing program expansion
• Marion County Hopsital District Trustees approved funding for a gym and one-story nursing center in the College of Florida after previous efforts were cut short. • The funding plan will be set in three phases: phase one toward a renovation of the gym to house new health technology like cardiovascular and surgical technology, phase two toward a one-story Health Technology Education Center and phase three toward renovating CF’s existing nursing building. • Board chair Rich Bianculli called the plan “great for the community”. Trustees agreed that an expansion of the program would help alleviate a nursing shortage in the area. Source: Ocala Star Banner, October 26, 2021
Ocala MSA Industry Loca�on Quo�ents
Total Nonagricultural Employment
Total Private
Goods Producing
Service Producing
Private Service Providing
Mining, Logging, and Construc�on
Manufacturing
Trade, Transporta�on, and U�li�es
Wholesale Trade
Retail Trade
Transporta�on, Warehousing and U�li�es
Informa�on
Financial Ac�vi�es
Professional and Business Services
Educa�onal and Health Services
Leisure and Hospitality
Other Services
Government
0 0.5 1 1.5 2 2.5

Long Term Outlook for Ocala, FL December 2021 Forecast
2016 2017 2018 2019 2020 2021 2022 2023 2024
Personal Income (Billions $)
Total Personal Income Pct Chg Year Ago Wages and Salaries Nonwage Income Real Personal Income (12$) Pct Chg Year Ago Per Capita Income (Ths) Real Per Capita Income (12$) Average Annual Wage (Ths) Pct Chg Year Ago 12.2 12.9 13.5 14.2 15.5 16.7 16.6 17.3 18.2 5.1 6.0 4.6 5.2 9.4 7.5 -0.5 4.5 4.8 4.2 4.3 4.5 4.8 5.0 5.5 5.8 6.0 6.3 8.0 8.6 9.0 9.4 10.5 11.2 10.8 11.3 11.9 13.0 13.5 13.8 14.2 15.4 16.0 15.4 15.8 16.3 4.1 4.2 2.0 2.9 8.2 3.8 -3.3 2.6 2.7 34.7 36.1 37.1 38.3 41.0 43.2 42.2 43.5 45.0 37.1 37.9 38.0 38.4 40.6 41.4 39.3 39.7 40.3 41.2 41.1 42.3 43.7 47.4 50.3 51.4 52.4 54.1 3.6 -0.1 2.8 3.2 8.5 6.2 2.1 2.0 3.3
Establishment Employment (Place of Work, Thousands, SA)
Total Employment 101.1 103.0 105.7 108.4 105.9 108.6 112.3 114.9 115.5 Pct Chg Year Ago 3.2 1.9 2.7 2.5 -2.2 2.5 3.4 2.3 0.5
Manufacturing Pct Chg Year Ago Nonmanufacturing Pct Chg Year Ago Construction & Mining Pct Chg Year Ago Trade, Trans, & Utilities Pct Chg Year Ago
7.8 8.1 8.6 9.3 9.5 10.0 10.5 10.5 10.3 3.4 3.9 5.3 7.8 2.7 5.8 4.3 0.6 -1.9 93.2 94.8 97.1 99.1 96.4 98.6 101.9 104.4 105.1 3.2 1.7 2.4 2.0 -2.7 2.2 3.4 2.5 0.7 6.9 7.3 7.8 8.5 8.7 8.8 8.7 8.4 8.3 7.2 4.8 8.0 8.0 2.2 1.4 -1.2 -2.8 -2.1 23.8 24.7 25.4 26.1 26.2 27.1 27.2 27.1 26.4 3.3 3.9 2.7 2.7 0.7 3.4 0.3 -0.3 -2.7
Wholesale Trade Retail Trade Trans, Wrhsng, & Util Information Pct Chg Year Ago
3.4 3.6 3.9 4.2 4.1 4.1 4.4 4.7 4.9 16.2 16.5 16.7 16.7 16.5 16.6 16.0 15.7 14.8 4.1 4.6 4.7 5.2 5.6 6.4 6.8 6.7 6.8 0.8 0.8 0.8 0.6 0.5 0.5 0.6 0.6 0.6 0.0 1.0 -5.2 -17.4 -17.3 -2.3 8.3 5.4 7.3
Financial Activities Pct Chg Year Ago Prof & Business Services Pct Chg Year Ago Educ & Health Services Pct Chg Year Ago Leisure & Hospitality Pct Chg Year Ago Other Services Pct Chg Year Ago Federal Government Pct Chg Year Ago State & Local Government Pct Chg Year Ago
3.9 3.9 3.9 3.9 3.8 3.8 4.0 4.2 4.4 -5.0 0.5 0.6 0.7 -2.4 -1.5 6.8 5.0 3.4 9.2 9.0 9.5 9.5 9.8 10.0 10.4 10.6 10.9 1.1 -2.2 5.3 0.1 3.1 1.9 4.5 2.0 2.6 18.3 18.5 18.8 18.8 18.3 18.5 19.6 19.8 20.5 3.7 0.8 1.7 0.2 -2.7 0.9 6.1 1.2 3.1 12.6 12.9 13.1 13.5 11.6 12.5 13.3 14.9 15.1 5.8 2.5 2.1 2.6 -13.8 7.2 6.7 11.9 1.6 3.1 3.0 2.9 3.0 2.8 2.9 3.4 3.6 3.7 2.7 -4.5 -2.5 1.5 -5.7 5.0 15.2 5.5 4.0 0.7 0.7 0.7 0.7 0.9 0.8 0.8 0.8 0.8 0.0 0.0 0.0 3.6 19.7 -9.1 1.6 2.6 -0.8 13.9 14.1 14.2 14.5 13.8 13.7 13.9 14.3 14.5 2.7 1.4 0.7 2.2 -5.1 -0.7 1.3 2.7 1.4
Other Economic Indicators
Population (Ths) Pct Chg Year Ago Labor Force (Ths) Pct Chg Year Ago Unemployment Rate (%) Total Housing Starts Single-Family Multifamily
350.8 357.0 363.1 370.2 378.6 386.1 392.9 398.8 403.9 1.7 1.8 1.7 2.0 2.3 2.0 1.8 1.5 1.3 132.5 133.7 135.7 139.2 138.5 146.1 150.6 150.4 149.9 1.4 0.9 1.5 2.6 -0.5 5.5 3.0 -0.1 -0.3 5.9 5.1 4.4 4.0 7.2 6.1 5.6 5.1 5.0 1413.6 2075.1 2646.7 2415.6 3627.8 5456.5 4259.4 3565.2 3322.8 1410.4 1923.3 2600.3 2404.1 3611.3 5413.3 4136.9 3357.0 3132.2 3.3 151.8 46.4 11.4 16.6 43.2 122.4 208.2 190.6


