11 minute read
Miami–Fort Lauderdale–West Palm Beach.............................65


Short Term Outlook for Miami-Fort Lauderdale-Pompano Beach, FL December 2021 Forecast
2021:Q4 2022:Q1 2022:Q2 2022:Q3 2022:Q4 2023:Q1 2023:Q2 2023:Q3 2023:Q4 2024:Q1 2024:Q2 2024:Q1 2024:Q2
Personal Income (Billions $)
Total Personal Income 414.4 415.6 420.1 424.9 428.0 431.4 435.5 439.7 443.8 448.4 453.4 458.6 463.8
Pct Chg Year Ago Wages and Salaries
5.9 -6.7 0.5 2.4 3.3 3.8 3.7 3.5 3.7 3.9 4.1 4.3 4.5 184.3 187.4 189.7 191.7 193.2 195.0 196.5 198.0 199.5 201.3 203.5 205.8 208.3 Nonwage Income 230.1 228.2 230.4 233.2 234.8 236.4 239.0 241.7 244.2 247.0 249.9 252.8 255.5 Real Personal Income (12$) 319.9 319.6 321.6 323.6 324.6 325.8 327.2 329.0 330.4 332.1 334.1 336.3 338.3 Pct Chg Year Ago 1.1 -10.3 -2.5 0.1 1.4 1.9 1.8 1.7 1.8 2.0 2.1 2.2 2.4 Per Capita Income (Ths) 68.0 68.2 68.9 69.7 70.1 70.6 71.2 71.7 72.2 72.8 73.4 74.1 74.7 Real Per Capita Income (12$) 52.5 52.5 52.8 53.1 53.2 53.3 53.5 53.6 53.8 53.9 54.1 54.3 54.5 Average Annual Wage (Ths) 69.1 69.7 70.0 70.4 70.7 71.1 71.5 71.9 72.3 72.8 73.4 74.0 74.7 Pct Chg Year Ago 2.0 2.0 1.7 2.0 2.3 2.0 2.1 2.1 2.3 2.4 2.7 3.0 3.3
Establishment Employment (Place of Work, Thousands, SA)
Total Employment 2652.1 2676.8 2696.4 2709.1 2719.3 2729.6 2736.6 2740.8 2746.0 2752.1 2759.5 2768.1 2775.1 Pct Chg Year Ago 4.8 4.9 4.5 3.6 2.5 2.0 1.5 1.2 1.0 0.8 0.8 1.0 1.1 Manufacturing 88.8 88.8 89.2 88.8 89.2 89.1 88.9 88.4 88.1 87.8 87.4 87.1 86.8 Pct Chg Year Ago 0.4 1.6 2.9 1.2 0.4 0.3 -0.3 -0.5 -1.2 -1.5 -1.6 -1.5 -1.5 Nonmanufacturing 2563.3 2588.0 2607.2 2620.3 2630.2 2640.5 2647.7 2652.4 2657.9 2664.3 2672.1 2681.1 2688.3 Pct Chg Year Ago 4.9 5.0 4.6 3.7 2.6 2.0 1.6 1.2 1.1 0.9 0.9 1.1 1.1 Construction & Mining 139.0 138.4 138.0 137.7 137.4 137.0 136.5 136.3 136.3 136.4 136.5 136.8 137.1 Pct Chg Year Ago -0.7 -1.7 0.5 -1.2 -1.1 -1.0 -1.1 -1.0 -0.9 -0.4 0.0 0.4 0.6 Trade, Trans, & Utilities 596.7 593.8 592.6 594.8 588.7 586.9 592.1 589.2 588.9 585.2 578.1 577.0 575.9 Pct Chg Year Ago 3.5 2.4 2.0 1.3 -1.3 -1.2 -0.1 -1.0 0.0 -0.3 -2.4 -2.1 -2.2 Wholesale Trade 145.2 147.2 149.9 155.7 157.2 158.8 158.7 159.2 160.0 161.6 163.9 165.3 166.7 Retail Trade 315.4 308.0 302.7 295.7 288.0 284.1 290.5 287.6 286.6 280.5 269.7 266.6 263.3 Trans, Wrhsng, & Util 136.0 138.5 140.1 143.4 143.6 144.0 143.0 142.4 142.3 143.0 144.5 145.1 145.8 Information 49.0 49.8 50.0 50.8 50.2 50.4 50.8 51.0 51.7 52.4 53.0 53.0 53.0 Pct Chg Year Ago 6.1 7.7 8.6 6.1 2.3 1.4 1.6 0.2 3.1 4.0 4.3 4.1 2.5 Financial Activities 192.9 195.7 200.2 204.1 204.0 204.1 202.3 201.4 201.0 201.2 202.0 202.4 202.8 Pct Chg Year Ago 1.6 3.3 6.9 6.2 5.8 4.3 1.0 -1.3 -1.4 -1.4 -0.2 0.5 0.9 Prof & Business Services 446.8 465.5 470.1 468.8 470.1 473.3 471.3 471.4 474.2 478.9 485.4 489.3 492.8 Pct Chg Year Ago 1.8 4.6 5.2 4.8 5.2 1.7 0.3 0.6 0.9 1.2 3.0 3.8 3.9 Educ & Health Services 407.9 409.3 419.7 420.1 415.6 415.7 412.8 412.4 412.8 415.4 418.4 421.3 423.0 Pct Chg Year Ago 2.9 2.8 6.0 4.4 1.9 1.6 -1.6 -1.8 -0.7 -0.1 1.4 2.2 2.5 Leisure & Hospitality 311.4 310.6 306.1 308.7 326.4 333.6 342.3 351.0 352.6 353.3 355.6 356.2 357.1 Pct Chg Year Ago 26.6 20.2 4.2 3.5 4.8 7.4 11.8 13.7 8.0 5.9 3.9 1.5 1.3 Other Services 114.0 115.6 119.6 122.9 123.8 124.3 123.7 123.5 123.7 124.4 125.5 126.7 127.7 Pct Chg Year Ago 9.4 8.5 7.1 9.2 8.6 7.5 3.5 0.5 -0.1 0.0 1.4 2.6 3.2 Federal Government 34.1 34.0 33.9 33.9 33.8 33.8 33.8 33.9 34.0 34.0 34.2 34.3 34.5 Pct Chg Year Ago -5.2 -4.2 -1.2 -0.8 -1.0 -0.7 -0.3 0.1 0.5 0.7 0.9 1.2 1.5 State & Local Government 271.5 275.3 277.1 278.5 280.1 281.3 282.2 282.5 282.8 283.1 283.5 284.0 284.4 Pct Chg Year Ago 1.2 3.9 6.8 4.5 3.2 2.2 1.9 1.4 1.0 0.6 0.5 0.5 0.6
Other Economic Indicators
Population (Ths) 6089.8 6090.7 6093.4 6097.1 6102.7 6110.5 6119.9 6131.9 6146.0 6160.4 6175.2 6190.3 6205.5 Pct Chg Year Ago -0.4 -0.2 0.0 0.1 0.2 0.3 0.4 0.6 0.7 0.8 0.9 1.0 1.0 Labor Force (Ths) 3167.9 3189.1 3196.7 3199.8 3203.3 3208.2 3214.1 3217.7 3221.4 3225.7 3233.3 3243.1 3255.6 Pct Chg Year Ago 5.7 5.3 4.0 2.1 1.1 0.6 0.5 0.6 0.6 0.5 0.6 0.8 1.1 Unemployment Rate (%) 5.4 5.0 4.6 4.4 4.2 4.1 4.0 4.0 4.0 4.0 4.0 4.0 4.1 Total Housing Starts 23776.424279.724049.924925.925575.926157.426434.426578.526739.626586.026271.026200.025940.8 Single-Family 9141.5 9584.510011.710375.510795.711063.011211.011476.911653.611537.811481.511612.911599.2 Multifamily 14634.914695.214038.214550.414780.115094.515223.415101.715086.015048.314789.414587.114341.7
PROFILES
The Miami-Miami Beach-Kendall MSA is located in the southeastern section of the state. Miami-Dade County is estimated to be the most populous county in Florida and the seventh-most populous county in the United States.
QUICK FACTS
• Metro population estimate of 2,716,940 as of 2019 (5-Year Estimate) (U.S. Census Bureau). • Miami-Dade County population estimate of 2,716,940 as of 2019 (5-Year Estimate) (U.S.
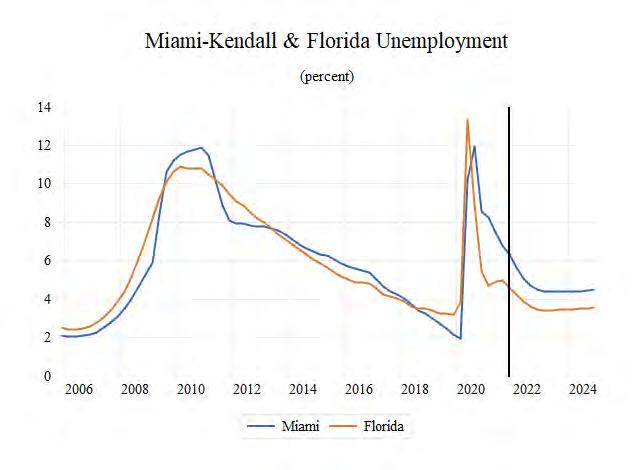
Census Bureau). • Civilian labor force of 1,358,384 in August 2021 (Florida Research and Economic Database). • An unemployment rate of 6.7% as of August 2021, not seasonally adjusted. This amounts to 90,370 unemployed people (Florida Research and
Economic Database).
OUTLOOK SUMMARIES
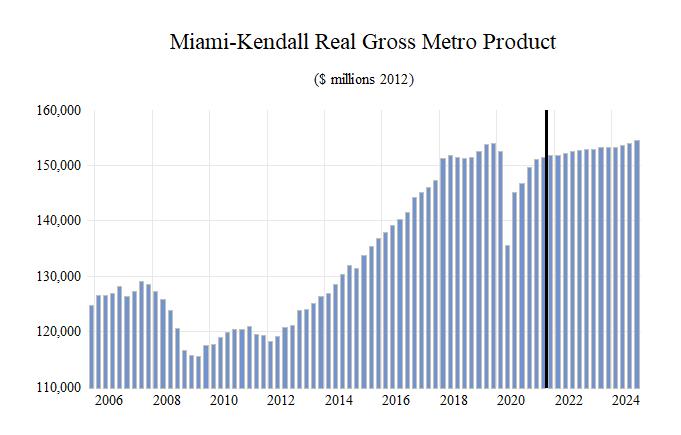
The Miami Dade—Kendall area is expected to show weak levels of growth in the economic indicators. Personal income is expected to grow an average of 4.1 percent annually, ranking 6th out of all twenty-five MSAs studied. The average real per capita income level of $48,100 ranks fourteenth in the areas studied. Average annual wage growth will be 2.8 percent, the second lowest of the MSAs; however, the average annual wage level is expected to be $69,600, the third highest of the studied areas. Miami is expected to average a population growth of -0.4 percent each year. The area has the third highest Gross Metro Product of the MSAs studied at an average level of $150,315.57 million.
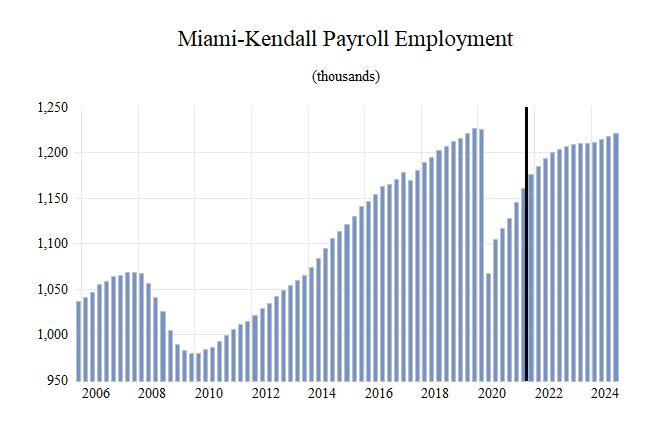
Employment is expected to contract at an average rate of -0.1 percent each year, while unemployment is expected to be the highest at an average rate of 6.2percent.
Miami’s fastest growing sector is expected to be the Professional & Business Services and Financial sector, will experience respective rates of 2.3 and 1.3 percent average annual growth, followed by the Leisure & Hospitality sector, which will grow at an average of 1.3 percent annually. The Other Services sector will experience an average 0.4 percent change in growth.
METRO NEWS SUMMARIES
Sure, we know Miami rents are rising. But by how much?
• According to Zumper’s July 2021 national rent report, Miami has one of the highest month to month rent increases in the country. • Miami came in fifth out of 100 cities, with El
Paso taking the top spot. • The study found that from June to July, rent increased from $1,695 for a one bedroom to $1,790, an increase of 5.3%. Source: Miami Herald, July 27, 2021
More affordable housing is coming to Miami neighborhoods. Here’s where
• Currently there are eight projects planned for affordable housing in Miami and Miami-Dade
County, some of which will be for renters and others will be for buyers. • Households earning between $35,410 and $70,200 will be eligible for affordable housing. • According to an affordable housing report from
Miami Homes for All in July 2020, nearly 35% of the county earn $35,000 or less per year. Source: Miami Herald, July 30, 2021
More money, more projects. Miami-Dade governments bouncing back with help from the feds
• Using money from the American Rescue Plan,
Mayor Daniella Levine Cava, plans to use $60 million on rental assistance. • In addition, she plans to keep the county’s main tac rate flat, however, will use the federal money to increase spending on police and parks. • While the spending plan in Miami has not yet been finalized, a draft shows that the money will be used on affordable housing as well as providing grants to small businesses. Source: Miami Herald, August 19, 2021
Miami-Dade unemployment dips in July, this time for a good reason
• Growth in Miami-Dade had been hindered by events in Latin American economies. • In July, the unemployment rate in Miami-Dade dropped to 5.2%, down 0.1% from June. • In addition to lower unemployment rates, the number of people working increased by nearly 3,000 people. The number of people working had been decreasing every month since February. Source: Miami Herald, August 29, 2021
Middle East developer offers $120 million for collapse site of Surfside condo tower
• A real estate developer from the Middle East has offered $120 million for the two-acre oceanfront property where the condo collapsed in June. • Miami-Dade Circuit Judge Michael Hanzman is in charge of approving the sale. He has expressed that he wants to get as much money as possible, so it can be used to compensate the families of those who died in the collapse. • Other developers can submit their own bids, which might raise the price of the property. Source: Miami Herald, September 13, 2021
Realtors’ tip: If you want that house, come with cash. And the deals are piling up
• 41% of all deals in Miami-Dade in June consisted of cash buyers. In June 2019, only 26% of deals were cash. • This exceeds the national average of cash buyers, which stands at 23%. • 23% of the buyers in Miami are foreign buyers ranging from Argentina to Mexico to Peru. They are more likely to be a cash buyer because it can be difficult for them to get a loan in the US. Source: Miami Herald, September 27, 2021
Miami-Miami Beach-Kendall Division MSA Industry Loca�on Quo�ents
Total Nonagricultural Employment
Total Private
Goods Producing
Service Producing
Private Service Providing
Mining, Logging, and Construc�on
Manufacturing
Trade, Transporta�on, and U�li�es
Wholesale Trade
Retail Trade
Transporta�on, Warehousing and U�li�es
Informa�on
Financial Ac�vi�es
Professional and Business Services
Educa�onal and Health Services
Leisure and Hospitality
Other Services
Government
0 0.2 0.4 0.6 0.8 1 1.2 1.4 1.6 1.8 2

Long Term Outlook for Miami-Miami Beach-Kendall, FL December 2021
2016 2017 2018 2019 2020 2021 2022 2023 2024
Personal Income (Billions $)
Total Personal Income Pct Chg Year Ago Wages and Salaries Nonwage Income Real Personal Income (12$) Pct Chg Year Ago
119.7 132.1 143.4 147.3 154.9 167.0 167.3 172.9 179.8 0.6 10.4 8.6 2.7 5.2 7.8 0.2 3.4 4.0 64.1 67.1 70.9 74.8 74.4 80.4 85.3 88.3 91.4 55.6 64.9 72.5 72.5 80.5 86.6 81.9 84.6 88.4 105.8 113.6 120.3 121.1 125.9 131.1 127.7 129.7 132.2 -1.5 7.4 6.0 0.6 4.0 4.1 -2.6 1.5 1.9 Per Capita Income (Ths) 44.4 48.8 52.9 54.4 57.5 62.5 62.9 64.9 67.1 Real Per Capita Income (12$) 39.3 41.9 44.4 44.7 46.8 49.1 48.0 48.7 49.3 Average Annual Wage (Ths) 55.0 56.8 58.8 61.0 65.6 69.3 70.9 72.6 74.8 Pct Chg Year Ago 1.2 3.2 3.6 3.7 7.5 5.7 2.3 2.4 2.9
Establishment Employment (Place of Work, Thousands, SA)
Total Employment 1157.0 1174.6 1198.3 1218.7 1128.1 1152.1 1195.4 1208.9 1215.8 Pct Chg Year Ago 2.7 1.5 2.0 1.7 -7.4 2.1 3.8 1.1 0.6 Manufacturing 41.2 41.2 41.5 42.4 40.8 40.5 41.2 40.6 39.6 Pct Chg Year Ago 4.1 0.1 0.6 2.2 -3.8 -0.5 1.5 -1.3 -2.5 Nonmanufacturing 1115.8 1133.4 1156.8 1176.4 1087.4 1111.5 1154.2 1168.2 1176.2 Pct Chg Year Ago 2.7 1.6 2.1 1.7 -7.6 2.2 3.8 1.2 0.7 Construction & Mining 44.9 47.7 52.4 54.3 53.4 50.7 49.8 49.8 50.0 Pct Chg Year Ago 9.9 6.2 9.7 3.7 -1.6 -5.0 -1.9 0.1 0.3 Trade, Trans, & Utilities 291.8 294.4 299.3 303.4 281.3 284.0 287.4 285.8 281.0 Pct Chg Year Ago 0.7 0.9 1.7 1.4 -7.3 1.0 1.2 -0.6 -1.7 Wholesale Trade 73.2 73.6 73.9 74.1 70.3 69.5 73.5 76.3 78.5 Retail Trade 147.2 147.0 146.8 144.4 131.9 133.6 126.1 120.8 112.9 Trans, Wrhsng, & Util 71.4 73.8 78.6 84.9 79.0 80.9 87.8 88.7 89.6 Information 19.2 19.4 20.0 20.6 18.7 18.7 19.7 19.9 20.6 Pct Chg Year Ago 2.5 1.0 3.2 3.0 -9.1 -0.3 5.5 1.1 3.5 Financial Activities 78.9 80.7 81.2 81.9 80.6 83.1 87.2 86.2 85.1 Pct Chg Year Ago 1.1 2.2 0.7 0.9 -1.6 3.0 5.0 -1.1 -1.3 Prof & Business Services 168.6 173.2 178.3 182.2 175.0 185.3 197.0 199.0 202.7 Pct Chg Year Ago 4.7 2.7 2.9 2.2 -4.0 5.9 6.3 1.0 1.9 Educ & Health Services 178.6 183.4 187.6 193.1 187.1 186.3 191.6 190.0 192.6 Pct Chg Year Ago 3.8 2.7 2.3 3.0 -3.1 -0.4 2.8 -0.8 1.4 Leisure & Hospitality 140.9 141.4 143.3 146.0 104.5 118.4 129.1 143.7 149.9 Pct Chg Year Ago 3.9 0.4 1.3 1.9 -28.5 13.4 9.0 11.3 4.3 Other Services 52.9 51.4 51.3 50.4 44.9 47.0 50.0 50.8 51.0 Pct Chg Year Ago 1.2 -2.8 -0.2 -1.7 -11.0 4.8 6.4 1.4 0.5 Federal Government 19.9 20.0 20.1 20.5 21.4 20.7 20.3 20.2 20.4 Pct Chg Year Ago 1.1 0.7 0.5 1.9 4.5 -3.5 -1.8 -0.5 0.8 State & Local Government 120.2 121.8 123.4 123.9 120.5 117.3 122.2 122.9 122.9 Pct Chg Year Ago 1.4 1.4 1.3 0.4 -2.8 -2.6 4.2 0.5 0.0
Other Economic Indicators
Population (Ths) 2692.4 2708.8 2710.7 2709.5 2693.5 2671.3 2660.4 2662.7 2678.7 Pct Chg Year Ago 1.0 0.6 0.1 0.0 -0.6 -0.8 -0.4 0.1 0.6 Labor Force (Ths) 1305.2 1349.3 1352.4 1371.8 1292.0 1323.5 1358.2 1361.6 1371.2 Pct Chg Year Ago 0.8 3.4 0.2 1.4 -5.8 2.4 2.6 0.2 0.7 Unemployment Rate (%) 5.5 4.6 3.6 2.6 8.2 7.2 5.0 4.4 4.4 Total Housing Starts 9031.7 8960.7 9582.0 9608.8 8541.2 11292.5 11656.1 10753.2 10135.9 Single-Family 2945.8 2321.9 2339.3 2409.0 2076.0 2503.8 3187.0 3527.3 3464.2 Multifamily 6085.9 6638.9 7242.7 7199.9 6465.2 8788.7 8469.1 7225.9 6671.7


