12 minute read
Crestview–Ft. Walton Beach–Destin......................................... 30


Short Term Outlook for Crestview-Fort Walton Beach-Destin, FL December 2021 Forecast
2021:Q4 2022:Q1 2022:Q2 2022:Q3 2022:Q4 2023:Q1 2023:Q2 2023:Q3 2023:Q4 2024:Q1 2024:Q2 2024:Q1 2024:Q2
Personal Income (Billions $)
Total Personal Income 17.7 17.7 17.9 18.1 18.2 18.3 18.5 18.7 18.9 19.1 19.3 19.5 19.8
Pct Chg Year Ago Wages and Salaries
4.6 -8.2 -0.7 1.1 2.6 3.3 3.5 3.6 3.9 4.4 4.4 4.5 4.5 8.4 8.5 8.6 8.7 8.8 8.9 9.0 9.1 9.2 9.3 9.4 9.5 9.6 Nonwage Income 9.3 9.2 9.3 9.4 9.4 9.5 9.5 9.6 9.7 9.8 9.9 10.1 10.2 Real Personal Income (12$) 16.2 16.1 16.2 16.2 16.3 16.3 16.4 16.5 16.6 16.7 16.8 16.9 17.0 Pct Chg Year Ago -0.1 -11.7 -3.7 -1.1 0.7 1.5 1.6 1.7 2.1 2.4 2.4 2.4 2.4 Per Capita Income (Ths) 60.7 60.5 60.9 61.4 61.7 61.9 62.3 62.9 63.3 63.9 64.3 64.9 65.5 Real Per Capita Income (12$) 55.4 55.0 55.1 55.3 55.3 55.3 55.4 55.6 55.7 55.9 56.0 56.2 56.5 Average Annual Wage (Ths) 61.2 61.7 62.0 62.3 62.5 62.8 63.1 63.6 64.1 64.8 65.5 66.2 66.8 Pct Chg Year Ago 3.2 3.3 2.1 1.9 2.2 1.8 1.9 2.0 2.6 3.1 3.7 4.1 4.2
Establishment Employment (Place of Work, Thousands, SA)
Total Employment 119.1 119.3 120.0 120.5 121.4 121.9 123.0 123.7 124.1 124.2 124.3 124.4 124.6 Pct Chg Year Ago 0.6 1.1 2.3 2.1 2.0 2.2 2.5 2.6 2.2 1.9 1.0 0.6 0.4 Manufacturing 3.5 3.5 3.5 3.4 3.4 3.4 3.4 3.4 3.4 3.4 3.4 3.3 3.3 Pct Chg Year Ago 0.2 2.5 3.4 -1.5 -1.2 -1.6 -1.0 0.0 -0.9 -1.4 -2.0 -2.5 -2.9 Nonmanufacturing 115.6 115.8 116.5 117.1 118.0 118.5 119.6 120.3 120.7 120.8 120.9 121.1 121.3 Pct Chg Year Ago 0.6 1.1 2.2 2.2 2.1 2.3 2.6 2.7 2.3 2.0 1.1 0.7 0.5 Construction & Mining 6.9 6.9 6.8 6.7 6.6 6.5 6.4 6.3 6.3 6.2 6.1 6.1 6.1 Pct Chg Year Ago 0.8 -0.5 -3.2 -5.4 -4.8 -5.2 -4.9 -5.2 -5.1 -4.9 -4.3 -3.6 -2.9 Trade, Trans, & Utilities 20.4 20.2 19.8 19.7 19.2 19.0 19.4 19.3 19.3 19.0 18.5 18.3 18.3 Pct Chg Year Ago -1.2 -1.9 -2.0 -2.6 -5.9 -5.6 -2.2 -2.0 0.4 0.0 -4.4 -5.1 -5.4 Wholesale Trade 1.7 1.7 1.7 1.7 1.8 1.8 1.8 1.8 1.8 1.8 1.9 1.9 1.9 Retail Trade 16.3 16.1 15.7 15.5 15.0 14.8 15.1 15.0 15.0 14.7 14.1 13.9 13.8 Trans, Wrhsng, & Util 2.4 2.4 2.4 2.5 2.5 2.5 2.5 2.5 2.5 2.5 2.5 2.6 2.6 Information 1.4 1.4 1.4 1.4 1.4 1.4 1.4 1.4 1.5 1.5 1.5 1.5 1.5 Pct Chg Year Ago 7.1 8.4 5.7 5.3 1.5 0.3 1.4 1.4 4.8 6.1 6.1 4.5 1.1 Financial Activities 7.4 7.5 7.5 7.7 7.7 7.8 7.9 7.9 8.0 8.1 8.2 8.3 8.3 Pct Chg Year Ago 0.4 0.8 5.6 4.0 4.3 5.1 4.5 3.8 4.0 3.5 4.4 4.5 4.1 Prof & Business Services 19.2 19.8 20.2 20.3 20.4 20.5 20.3 20.2 20.3 20.4 20.6 20.7 20.8 Pct Chg Year Ago -2.9 0.9 5.5 5.8 5.9 3.1 0.7 -0.3 -0.4 -0.1 1.6 2.4 2.4 Educ & Health Services 12.7 12.8 13.1 13.1 12.9 12.9 12.8 12.8 12.9 13.0 13.1 13.2 13.3 Pct Chg Year Ago 3.8 5.2 6.6 3.8 1.7 0.9 -1.7 -1.8 -0.4 0.7 2.3 3.2 3.5 Leisure & Hospitality 21.7 21.2 21.2 21.3 22.6 23.0 24.0 24.8 25.0 25.0 25.2 25.2 25.3 Pct Chg Year Ago 4.5 0.8 -3.0 -0.9 3.9 8.3 13.2 16.4 11.0 9.0 4.9 1.5 0.8 Other Services 5.1 5.2 5.3 5.5 5.5 5.5 5.5 5.5 5.5 5.5 5.6 5.6 5.6 Pct Chg Year Ago 6.8 8.5 10.6 11.8 9.5 7.5 2.6 -0.6 -0.8 -0.2 1.5 2.3 2.8 Federal Government 9.3 9.4 9.6 9.7 9.8 9.9 9.9 9.9 9.9 9.9 10.0 10.0 10.0 Pct Chg Year Ago -0.9 1.9 6.3 7.3 5.5 4.7 3.4 2.3 1.1 0.7 0.7 0.7 0.9 State & Local Government 11.4 11.5 11.7 11.8 11.9 11.9 12.0 12.0 12.1 12.1 12.1 12.1 12.1 Pct Chg Year Ago -2.3 -0.5 3.8 3.9 3.8 3.7 2.7 2.0 1.5 1.0 1.0 0.6 0.6
Other Economic Indicators
Population (Ths) 291.9 292.7 293.2 294.0 294.7 295.6 296.6 297.4 298.4 299.3 300.1 300.9 301.6 Pct Chg Year Ago 1.0 1.0 1.0 1.0 1.0 1.0 1.2 1.2 1.2 1.2 1.2 1.2 1.1 Labor Force (Ths) 135.8 137.0 137.6 138.0 138.2 138.4 138.5 138.6 138.7 138.9 139.1 139.4 139.8 Pct Chg Year Ago 5.1 3.4 2.8 3.2 1.7 1.0 0.7 0.4 0.4 0.4 0.4 0.6 0.8 Unemployment Rate (%) 4.1 4.1 3.9 3.9 3.8 3.6 3.5 3.5 3.4 3.1 3.0 3.0 2.8 Total Housing Starts 3251.9 3012.1 2791.0 2641.9 2502.5 2332.7 2283.9 2314.0 2298.2 2235.6 2190.4 2178.3 2143.1 Single-Family 3032.8 2754.6 2529.3 2336.5 2181.9 2011.1 1923.2 1911.8 1888.7 1831.7 1798.6 1797.5 1771.0 Multifamily 219.1 257.5 261.7 305.3 320.6 321.6 360.7 402.2 409.4 403.9 391.8 380.8 372.1
PROFILES
The Deltona–Daytona–Ormond Beach MSA is comprised of Volusia and Flagler Counties. It is located on the east coast of Florida and is notable for special events that occur throughout the year such as Bike Week. It is home to NASCAR headquarters and the Daytona International Speedway, which hosts popular races such as the Daytona 500.
QUICK FACTS
• Metro population estimate of 646,288 as of 2019 (5-Year Estimate) (U.S. Census Bureau). • Volusia County population estimate of 553,284 as of 2019 (5-Year Estimate) (U.S. Census Bureau). • Civilian labor force of 310,685 in August 2021 (Florida Research and Economic Database). • An unemployment rate of 4.9% as of August 2021, not seasonally adjusted. This amounts to 15,320 unemployed people (Florida Research and
Economic Database).
OUTLOOK SUMMARIES
Growth in the economic indicators studied in this forecast is expected to be around the state averages for the Deltona – Daytona – Ormond Beach Metropolitan Statistical Area (MSA). Gross Metro Product in the Deltona MSA will be $20,320.97 million, placing it 13th in the state for metro output. Personal income levels will grow by an average annual rate of 3.4 percent, driven by a 3.7 percent increase in the average annual wage to $52,700. Per capita income levels will come in below the state average at $44,800, placing it 19th out of the studied MSAs. We expect population growth of 1.1 percent per year.
The Deltona – Daytona – Ormond Beach MSA labor market will experience an average level of annual employment growth at 1.8 percent, leading to an unemployment rate of 5.2 percent, the sixth highest in the state.
The Leisure & Hospitality sector will experience the fastest growth rate in this MSA with an annual growth rate of 7.3 percent. The Other Services sector will follow at 5.3 percent. Information Services will be the third-fastest grower at a rate of 3.9 percent.
METRO NEWS SUMMARIES
Tourism bed-tax collections for May reflect 52% jump over pre-pandemic May 2019
• Data reported by the Volusia County Revenue
Division shows strong demand for travel to the
Volusia-Flagler area from both in-state and outof-state tourists. Hotels, vacation rentals, and other lodging businesses generated over $2.8 million in bed-taxes this May. • This figure is up 51.7% from May 2019, before the COVID-19 pandemic, and up over 120% from a year ago. • Bed-tax revenues are also significantly up in the fiscal-year-to-date period, as the county has reported over $16.5 million in bed-tax collections in the first eight months of its fiscal year beginning October 1st, 2020. This figure is 5.8% above collections during the same period in the county’s previous fiscal year. Source: The Daytona Beach News-Journal, July 12, 2021
Volusia-Flagler employers see rise in applicants, but few job takers
• Labor market frictions continue to spread around the state of Florida, as local businesses in the
Volusia-Flagler area struggle to get adequate staffing even as more workers rejoin the labor force, according to data from the Florida
Department of Economic Opportunity. • A spike in job applications pushed the unemployment rate up in both Volusia and
Flagler Counties during the month of June to 5.8% and 6.0%, respectively. Despite this jump in jobseekers, Volusia County only added 71 new jobs and Flagler only 16. • Wages in both counties continued to lag behind the state average annual wage of $55,845 in 2020, as workers received average annual pay of $44,392 in Volusia County and $38,514 in
Tentative tax hike, current federal funds can’t cover $53M shortfall for Volusia Schools
• Volusia County School District leaders are facing a shortfall in school funding, totaling approximately $53 million for the coming fiscal year. • A combination of drops in enrollment numbers, increases in costs with the Florida Retirement
System, and private school voucher obligations have been the main causes of the district’s deteriorating financial condition. • These financial distresses continue after a school board meeting in late July where board members approved a temporary property tax hike to $5.80 per $1,000 of taxable property value. This is projected to raise an additional $6 million in revenue for the school district. Source: The Daytona Beach News-Journal, August 10, 2021
Daytona city commissioners approve plan to spend $7.5 million in federal COVID-19 relief funds
• Daytona Beach city commissioners agreed on a spending plan to allocate $7.5 million in federal funds given to the city to aid in COVID-19 relief efforts. • $1.85 million will be divided among the city mayor and six city commissioners to fund various recovery efforts in each zone of the city. $1 million will fund a small business grant program. • The largest portion of the funds, approximately $4.2 million, will go toward affordable housing efforts, closing educational disparities, and founding an equity, diversity, and inclusion resource center for local small businesses. Source: The Daytona Beach News-Journal, August 19, 2021
Volusia collects a record $3.9M in tourism bed-tax collections in July
• In a welcomed sign of recovery for the Volusia
County economy, the Volusia County Revenue
Division reported a record $3.9 million in bedtax revenue from hotels, vacation rentals, and other lodgings for the month of July, the result of historically high travel demand from consumers. • The previous record was set in March of this year with $3.48 million reported in bed-tax revenues, thanks to an influx of college “Spring Breakers” and other out-of-state tourists seeking the warm beaches in the Volusia and Flagler County areas. • Fiscal-year-to-date revenues are also on pace to easily surpass pre-pandemic levels. For the first 10 months of the county revenue division’s fiscal year, bed-tax collections stood at $23.9 million, 15.7% above the 2018-2019 fiscal year’s level of $20.7 million. Source: The Daytona Beach News-Journal, September 12, 2021
Volusia Schools dips into savings, approves tax hike again to cover $41M budget shortfall
• Volusia County education officials continue to debate budgeting issues for the county’s education system, as strains from COVID-19 complications and other miscellaneous financial obligations created a $41 million budget deficit for the coming fiscal year. • Factors like dropping student enrollment numbers dried up revenues, and increased operational costs pushed expenses much higher than normal. • County board officials passed an effective property tax rate hike of approximately 2.5% earlier in the year and elected to pull $41 million from budget reserves to address the shortfall. Source: The Daytona Beach News-Journal, September 17, 2021
Deltona -Daytona Beach -Ormond Beach MSA Industry Loca�on Quo�ents
Total Nonagricultural Employment
Total Private
Goods Producing
Service Producing
Private Service Providing
Mining, Logging, and Construc�on
Manufacturing
Trade, Transporta�on, and U�li�es
Wholesale Trade
Retail Trade
Transporta�on, Warehousing and U�li�es
Informa�on
Financial Ac�vi�es
Professional and Business Services
Educa�onal and Health Services
Leisure and Hospitality
Other Services
Government
0.0 0.2 0.4 0.6 0.8 1.0 1.2 1.4


Long Term Outlook for Deltona-Daytona Beach-Ormond Beach, FL December 2021 Forecast
2016 2017 2018 2019 2020 2021 2022 2023 2024
Personal Income (Billions $)
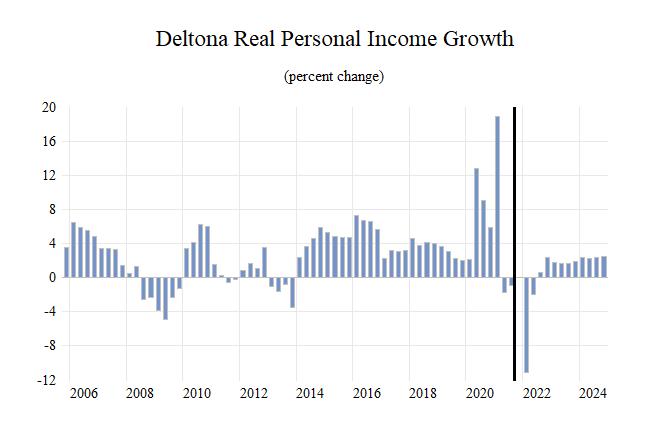
Total Personal Income Pct Chg Year Ago Wages and Salaries Nonwage Income Real Personal Income (12$) Pct Chg Year Ago Per Capita Income (Ths) Real Per Capita Income (12$) Average Annual Wage (Ths) Pct Chg Year Ago 25.5 27.2 28.7 30.2 32.1 34.2 33.9 35.2 36.7 5.9 6.5 5.8 5.2 6.1 6.6 -0.9 4.0 4.1 8.0 8.4 8.9 9.3 9.5 10.3 10.9 11.4 11.8 17.5 18.7 19.9 21.0 22.6 23.9 23.0 23.9 24.9 25.8 27.1 28.0 29.0 30.4 31.3 30.2 30.8 31.4 5.1 5.1 3.2 3.7 4.9 2.9 -3.7 2.1 2.0 40.3 42.2 44.0 45.7 47.8 50.3 49.4 50.8 52.3 40.8 42.1 42.8 43.8 45.3 46.1 43.9 44.4 44.9 40.7 41.8 43.2 44.7 47.5 50.6 52.0 53.1 55.0 1.8 2.7 3.3 3.5 6.4 6.6 2.7 2.2 3.5
Establishment Employment (Place of Work, Thousands, SA)
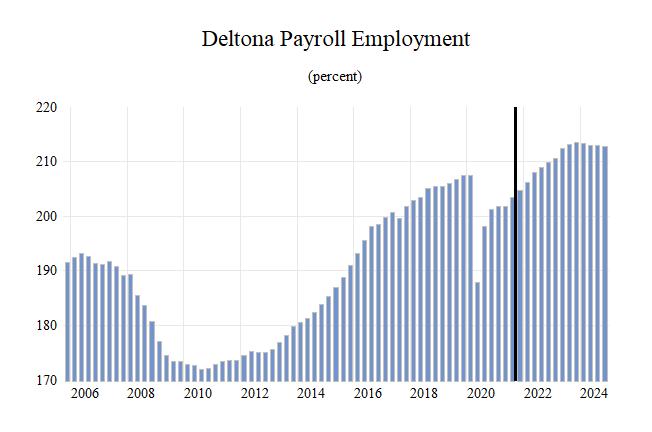
Total Employment 196.4 200.4 204.2 206.4 198.6 203.0 208.2 212.4 213.0 Pct Chg Year Ago 4.5 2.0 1.9 1.1 -3.7 2.2 2.6 2.0 0.3
Manufacturing Pct Chg Year Ago Nonmanufacturing Pct Chg Year Ago Construction & Mining Pct Chg Year Ago Trade, Trans, & Utilities Pct Chg Year Ago
11.5 11.6 11.8 11.4 10.7 11.1 11.3 11.3 11.2 5.6 0.9 1.1 -3.4 -6.0 3.7 1.5 0.5 -1.1 184.8 188.8 192.4 195.0 187.9 191.9 196.9 201.1 201.8 4.4 2.1 1.9 1.3 -3.6 2.1 2.6 2.1 0.4 12.1 12.9 13.8 14.2 14.2 14.9 14.5 13.8 13.3 8.7 6.6 6.8 2.7 0.1 4.7 -2.6 -4.6 -3.7 37.1 38.3 38.7 38.9 38.1 38.1 37.6 37.2 35.7 3.5 3.1 1.2 0.4 -2.0 0.1 -1.4 -1.1 -4.1
Wholesale Trade Retail Trade Trans, Wrhsng, & Util Information Pct Chg Year Ago
4.9 5.1 5.2 5.2 5.0 5.1 5.4 5.7 6.0 29.7 30.6 30.9 31.0 30.1 29.9 28.9 28.2 26.4 2.5 2.6 2.6 2.7 3.0 3.2 3.3 3.3 3.3 2.5 2.4 2.4 2.4 2.0 1.9 2.1 2.2 2.4 -2.0 -3.3 0.0 -0.7 -16.1 -6.0 8.7 6.3 6.8
Financial Activities Pct Chg Year Ago Prof & Business Services Pct Chg Year Ago Educ & Health Services Pct Chg Year Ago Leisure & Hospitality Pct Chg Year Ago Other Services Pct Chg Year Ago Federal Government Pct Chg Year Ago State & Local Government Pct Chg Year Ago
8.6 8.4 8.5 8.7 9.0 9.0 9.5 9.9 10.1 -0.6 -1.9 0.8 2.2 4.3 0.0 5.0 4.0 2.7 23.4 23.7 23.2 23.4 23.5 24.3 25.6 25.8 26.1 11.4 1.3 -2.5 1.2 0.2 3.6 5.3 0.7 1.4 38.0 38.8 39.8 40.7 39.7 40.0 42.2 42.0 42.5 2.8 2.2 2.5 2.2 -2.5 0.7 5.5 -0.3 1.1 30.9 31.4 33.0 32.9 27.6 30.1 31.1 35.1 36.4 5.7 1.6 5.0 -0.3 -16.2 9.2 3.2 12.8 3.9 8.8 9.0 9.0 8.9 8.1 8.2 9.1 9.5 9.9 4.5 2.0 0.0 -0.8 -9.5 1.6 10.3 5.4 3.7 1.4 1.4 1.4 1.5 1.6 1.5 1.5 1.6 1.6 3.1 5.0 0.6 5.3 6.1 -6.8 3.1 4.0 0.7 21.9 22.3 22.5 23.4 24.2 23.8 23.9 24.0 23.8 0.6 1.5 1.3 3.7 3.5 -1.6 0.2 0.5 -0.9
Other Economic Indicators
Population (Ths) Pct Chg Year Ago Labor Force (Ths) Pct Chg Year Ago Unemployment Rate (%) Total Housing Starts Single-Family Multifamily
632.3 643.5 653.0 662.4 671.9 680.1 686.6 693.8 700.6 2.2 1.8 1.5 1.4 1.4 1.2 1.0 1.1 1.0 291.7 295.6 299.1 301.9 296.1 307.1 315.7 317.3 318.0 2.9 1.3 1.2 0.9 -1.9 3.7 2.8 0.5 0.2 5.2 4.5 3.9 3.7 7.7 5.7 5.5 5.0 4.6 2714.1 3082.1 3569.7 4525.4 5822.1 5554.3 5443.5 5290.0 5090.0 2331.0 2860.1 3274.4 3878.3 4664.8 5309.0 5103.9 4355.5 4061.5 383.1 222.0 295.3 647.2 1157.3 245.2 339.6 934.5 1028.4


