
11 minute read
Gainesville...............................................................................................45


Short Term Outlook for Gainesville, FL December 2021 Forecast
2021:Q4 2022:Q1 2022:Q2 2022:Q3 2022:Q4 2023:Q1 2023:Q2 2023:Q3 2023:Q4 2024:Q1 2024:Q2 2024:Q1 2024:Q2
Personal Income (Billions $)
Total Personal Income 15.0 15.1 15.2 15.4 15.5 15.6 15.8 16.0 16.2 16.3 16.5 16.7 16.9
Pct Chg Year Ago Wages and Salaries
6.3 -5.3 0.6 2.3 3.5 3.9 3.8 3.8 4.1 4.4 4.3 4.3 4.4 8.7 8.8 8.9 9.0 9.1 9.2 9.3 9.4 9.5 9.6 9.7 9.8 9.9 Nonwage Income 6.3 6.3 6.3 6.4 6.4 6.5 6.5 6.6 6.7 6.7 6.8 6.9 7.0 Real Personal Income (12$) 13.7 13.7 13.8 13.9 13.9 14.0 14.1 14.1 14.2 14.3 14.4 14.5 14.5 Pct Chg Year Ago 1.5 -8.9 -2.3 0.0 1.6 2.0 1.9 2.0 2.2 2.4 2.3 2.2 2.2 Per Capita Income (Ths) 50.1 50.3 50.8 51.3 51.6 52.0 52.4 53.0 53.4 53.9 54.4 54.9 55.4 Real Per Capita Income (12$) 45.8 45.7 46.0 46.2 46.3 46.4 46.6 46.9 47.1 47.3 47.4 47.6 47.8 Average Annual Wage (Ths) 58.9 59.3 59.4 59.5 59.8 60.0 60.3 60.7 61.2 61.8 62.4 63.0 63.6 Pct Chg Year Ago 3.7 3.9 2.0 1.2 1.6 1.2 1.6 2.0 2.4 2.9 3.4 3.8 3.9
Establishment Employment (Place of Work, Thousands, SA)
Total Employment 146.8 147.9 149.6 150.6 151.4 152.2 153.2 153.9 154.2 154.5 154.6 154.8 154.9 Pct Chg Year Ago 3.4 2.7 2.9 3.4 3.1 2.9 2.4 2.2 1.9 1.5 0.9 0.6 0.5 Manufacturing 4.6 4.6 4.7 4.6 4.7 4.7 4.7 4.6 4.6 4.6 4.6 4.5 4.5 Pct Chg Year Ago 1.4 0.6 0.3 0.6 0.2 0.2 -0.4 -0.1 -0.6 -1.2 -1.7 -2.0 -2.2 Nonmanufacturing 142.2 143.2 145.0 146.0 146.7 147.5 148.6 149.2 149.6 149.9 150.1 150.3 150.4 Pct Chg Year Ago 3.5 2.8 3.0 3.5 3.2 3.0 2.5 2.2 1.9 1.6 1.0 0.7 0.6 Construction & Mining 6.4 6.3 6.3 6.2 6.2 6.1 6.1 6.0 5.9 5.8 5.8 5.8 5.7 Pct Chg Year Ago 3.6 1.7 1.0 -2.7 -2.9 -3.2 -3.5 -4.0 -4.3 -4.5 -4.2 -3.8 -3.1 Trade, Trans, & Utilities 20.9 20.5 20.2 20.1 19.7 19.5 19.8 19.7 19.6 19.4 18.9 18.7 18.5 Pct Chg Year Ago 1.4 -1.4 -3.9 -2.5 -5.6 -4.9 -2.3 -2.2 -0.5 -0.8 -4.6 -5.1 -5.4 Wholesale Trade 3.2 3.2 3.2 3.2 3.2 3.3 3.3 3.3 3.4 3.4 3.5 3.5 3.5 Retail Trade 14.0 13.7 13.4 13.2 12.8 12.5 12.8 12.7 12.6 12.2 11.7 11.4 11.3 Trans, Wrhsng, & Util 3.7 3.6 3.7 3.7 3.7 3.7 3.7 3.7 3.7 3.7 3.7 3.7 3.7 Information 1.6 1.7 1.7 1.7 1.7 1.7 1.7 1.8 1.8 1.8 1.9 1.9 1.9 Pct Chg Year Ago 1.7 3.5 3.8 5.0 2.7 3.2 4.7 5.5 7.9 8.1 7.6 5.4 2.2 Financial Activities 7.0 7.1 7.2 7.4 7.4 7.5 7.5 7.5 7.6 7.6 7.7 7.7 7.7 Pct Chg Year Ago 3.4 4.5 8.5 5.7 5.2 5.7 3.7 2.4 2.6 2.0 2.7 2.6 2.2 Prof & Business Services 16.3 17.1 17.5 17.8 18.0 18.3 18.3 18.4 18.5 18.8 19.1 19.3 19.4 Pct Chg Year Ago 4.9 2.4 8.6 10.1 10.5 7.1 4.6 3.3 2.7 2.8 4.1 4.9 4.8 Educ & Health Services 28.0 28.3 29.0 29.1 28.9 29.0 28.9 28.9 28.9 29.2 29.4 29.6 29.7 Pct Chg Year Ago 2.9 3.7 5.8 5.0 3.3 2.4 -0.4 -0.9 0.0 0.6 1.7 2.4 2.6 Leisure & Hospitality 14.7 14.5 14.6 14.7 15.6 16.0 16.7 17.3 17.4 17.3 17.3 17.2 17.2 Pct Chg Year Ago 15.8 8.9 -2.4 2.0 6.1 10.8 15.0 17.3 11.1 7.8 3.2 -0.2 -0.7 Other Services 4.1 4.3 4.4 4.6 4.6 4.6 4.5 4.5 4.5 4.5 4.6 4.6 4.6 Pct Chg Year Ago 6.6 10.1 10.4 13.1 10.7 7.9 2.5 -0.9 -1.3 -0.9 0.6 1.3 1.8 Federal Government 4.9 4.9 5.0 5.1 5.2 5.2 5.2 5.2 5.3 5.3 5.3 5.3 5.3 Pct Chg Year Ago -3.0 0.4 6.1 8.1 6.5 5.6 4.2 3.0 1.6 0.9 0.4 0.2 0.1 State & Local Government 38.2 38.6 39.0 39.3 39.4 39.6 39.8 40.0 40.1 40.2 40.2 40.3 40.4 Pct Chg Year Ago 0.8 1.8 2.7 2.4 3.2 2.6 1.9 1.7 1.6 1.3 1.2 0.8 0.7
Other Economic Indicators
Population (Ths) 299.3 299.5 299.8 300.1 300.6 301.1 301.5 301.8 302.3 302.8 303.2 303.7 304.1 Pct Chg Year Ago 0.7 0.6 0.5 0.4 0.4 0.5 0.6 0.6 0.6 0.6 0.6 0.6 0.6 Labor Force (Ths) 152.7 154.3 155.4 156.4 157.0 157.6 158.0 158.3 158.6 158.7 158.9 159.2 159.6 Pct Chg Year Ago 8.0 6.9 5.3 3.9 2.8 2.1 1.7 1.3 1.0 0.7 0.5 0.6 0.6 Unemployment Rate (%) 4.6 4.4 4.3 4.3 4.1 4.0 3.8 3.7 3.7 3.3 3.3 3.2 3.0 Total Housing Starts 1912.5 1757.9 1569.3 1477.7 1420.2 1373.4 1349.2 1371.0 1364.8 1340.2 1317.4 1311.1 1289.3 Single-Family 894.5 900.0 882.8 874.5 872.7 844.6 826.3 822.7 813.7 789.1 775.3 776.2 764.2 Multifamily 1018.0 857.9 686.5 603.2 547.6 528.8 522.9 548.3 551.1 551.1 542.1 535.0 525.1
PROFILES
The Homosassa Springs MSA is located in the central northwest portion of the state. Homosassa Springs is a Census designated place in Citrus county and is known for and named after the warm spring located in Homosassa Springs Wildlife State Park which attracts manatees to the area.
QUICK FACTS
• Metro population estimate of 145,169 as of 2019 (5-Year Estimate) (U.S. Census Bureau). • Citrus County population estimate of 145,169 as of 2019 (5-Year Estimate) (U.S. Census Bureau). • Civilian labor force 49,146 in August 2021 (Florida Research and Economic Database). • An unemployment rate of 6.3% as of August 2021, not seasonally adjusted. This amounts to 3,102 unemployed people (Florida Research and
Economic Database).
OUTLOOK SUMMARIES
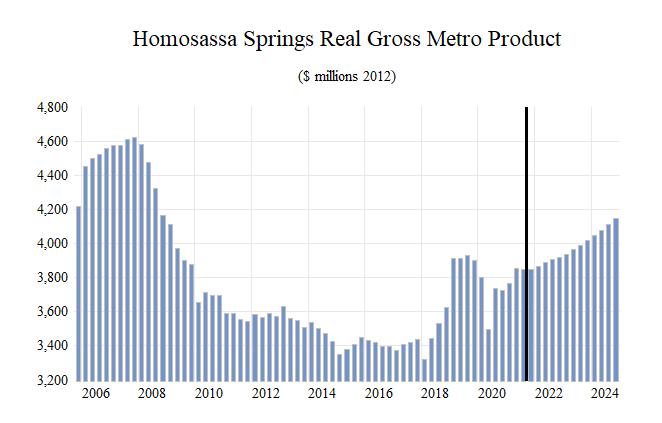
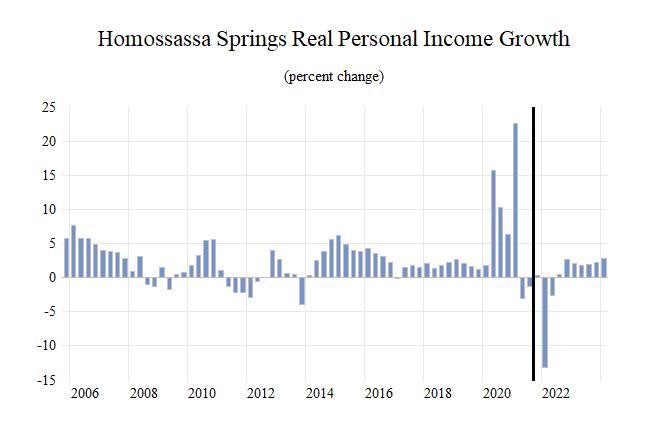
The Homosassa Springs Metropolitan Statistical Area (MSA) is expected to see below-average growth in most of the economic indicators, relative to the other MSAs studied. Homosassa’s expected Gross Metro Product of $3,948.33 million will be third to last in the state. Personal income growth of 3.9 percent will put the MSA’s per capita income level at $41,900. Average annual wage growth of 3.7 percent will push the average annual wage up to $49,800, becoming the lowest the state. Population growth will be 1.3 percent.
Employment growth is expected to average 2.2 percent annually. Homosassa’s unemployment rate will come in at 6.1 percent, the second highest in the state.
The fastest growing sector in the Homosassa Springs MSA will be the Professional & Business Services sector, which will see an average annual growth rate of 7.7 percent. The Other Services sector will come in second at a growth rate of 7.3 percent, followed by the leisure sector at 5.4 percent. Manufacturing will experience a mild pullback in growth at 0.1 percent.
METRO NEWS SUMMARIES
Green: Citrus business rebounding from last year
• Jim Green, who is the treasurer and workshop chairman for Nature Coast Florida SCORE, has said that a lot more people are calling his office wanting to start or expand their business. • Citrus County small-business owners are more hopeful this year than they were this time last year. • According to Green, local business owners have been having success from several federal programs that have helped them with their businesses despite the impact of the pandemic. Source: Chronicle Online, July 24, 2021
Citrus home prices soar: inventory remains low
• In Citrus County, the median price for a singlefamily home increased from $174,900 in June 2020 to $240,000 this year, an increase of 37%.
• In addition, homes ae also selling faster – taking only seven days for the buyer and seller to reach a contract as oppose to nearly 50 days last year. • According to the President of the Realtors
Association of Citrus County, Kelly Tedrick, “If no other homes came available for buyers this month, Citrus County would run out of homes in about 27 days.” Source: Chronicle Online, July 30, 2021
Citrus brisk housing market shows no sign of stopping
• As compared to July 2020, the median sales price for a single-family home in Citrus County rose 31% from $185,000 to $242,500. • However, active property listings was low in July with only 357 available homes, a decrease from the 605 available last year. • According to Cheryl Lambert, President of
Florida Realtors, “Any rebound in inventory is going to be slow, and it will take a long while to get back to the levels we had pre-pandemic.” Source: Chronicle Online, August 30, 2021
County builders enjoying housing boom
• Throughout 2021, the Citrus County Building
Division has 1,363 single-family home permits so far. This already exceeds the number of permits issued throughout all of last year. • A combination of limited existing homes as well as low interest rates has fueled the building boom in Citrus County. • “(Builders) are very optimistic, not only at the
Fairways of Twisted Oaks, but the whole Citrus
County market, especially with the Suncoast
Parkway opening soon,” said Steven Fischer, who is the president of twisted Oak Properties LLC. Source: Chronicle Online, August 31, 2021
Economist: Home ownership a big problem in Citrus
• According to Jennifer Warner, who is an economist and the director of economic development for Florida Realtors, “There’s literally nothing out there for (many people).” She continued, “(The) demand is outstripping supply.” • In addition, despite rising home prices in Citrus
County, there has not been a similar rise in median income, which has hindered some residents’ ability to own a home. As a result, they are forced to pay extremely high rental prices. • Gene McGee, a county lobbyist, said that for those who own a home right now, they are profiting because of rising home values, but for those who don’t own homes “that’s a real problem,” he said. Source: Chronicle Online, September 4, 2021
Citrus County to mull stormwater fee
• Board members voted in July to send out information to residents about the proposed stormwater assessment fee. • The fee will be based on the square footage of the property as well as other surfaces such as parking lots or concrete driveways. • While the fee had previously been part of the real estate ad valorem taxes, there were exemptions available that sometimes resulted in households paying little to none of the fee for stormwater runoff management. Source: Chronicle Online, September 11, 2021
Total Nonagricultural Employment
Total Private
Homosassa Springs MSA Industry Loca�on Quo�ents
Goods Producing
Service Producing
Private Service Providing
Government
0.94 0.96 0.98 1 1.02 1.04 1.06 1.08

Long Term Outlook for Homosassa Springs, FL December 2021 Forecast
2016 2017 2018 2019 2020 2021 2022 2023 2024
Personal Income (Billions $)
Total Personal Income Pct Chg Year Ago Wages and Salaries Nonwage Income Real Personal Income (12$) Pct Chg Year Ago Per Capita Income (Ths) Real Per Capita Income (12$) Average Annual Wage (Ths) Pct Chg Year Ago
5.2 5.4 5.7 6.0 6.4 6.9 6.8 7.1 7.5 3.5 3.6 4.6 5.3 7.6 7.5 -0.8 4.4 4.5 1.3 1.3 1.4 1.4 1.4 1.6 1.7 1.7 1.8 3.9 4.1 4.3 4.5 5.0 5.3 5.2 5.4 5.6 5.7 5.9 5.9 6.1 6.5 6.8 6.5 6.7 6.9 2.4 2.2 1.4 3.4 6.4 3.9 -3.6 2.5 2.4 36.3 36.9 37.9 39.3 41.4 43.8 42.8 44.1 45.7 39.8 40.0 39.9 40.5 42.2 43.1 41.0 41.5 42.1 38.9 40.2 41.2 42.1 44.8 47.9 49.1 50.2 51.9 0.0 3.1 2.6 2.2 6.4 6.8 2.6 2.2 3.4
Establishment Employment (Place of Work, Thousands, SA)
Total Employment 33.3 33.2 33.3 33.3 31.9 32.7 33.8 34.5 34.8 Pct Chg Year Ago 1.3 -0.1 0.2 0.2 -4.2 2.5 3.4 2.0 0.9
Manufacturing Pct Chg Year Ago Nonmanufacturing Pct Chg Year Ago Construction & Mining Pct Chg Year Ago
0.5 0.5 0.5 0.5 0.5 0.6 0.6 0.6 0.6 11.4 1.7 2.8 4.2 1.3 12.1 0.7 -1.1 -3.1 32.8 32.7 32.8 32.8 31.4 32.2 33.2 33.9 34.3 1.2 -0.2 0.1 0.1 -4.3 2.3 3.4 2.1 1.0 2.9 2.9 3.0 3.0 3.0 3.0 3.0 2.9 2.9 7.6 -0.4 3.4 1.6 -0.3 -0.1 -0.6 -1.8 -0.8
Trade, Trans, & Utilities Pct Chg Year Ago 7.5 7.4 7.4 7.3 7.1 7.1 7.0 6.9 6.8 -1.0 -1.5 0.1 -1.1 -2.8 -0.7 -0.6 -1.9 -2.3
Wholesale Trade Retail Trade Trans, Wrhsng, & Util Information Pct Chg Year Ago 1.1 1.0 1.0 1.0 1.0 1.0 1.1 1.1 1.2 5.2 5.1 5.1 5.1 4.9 4.9 4.7 4.5 4.3 1.3 1.2 1.2 1.2 1.2 1.2 1.3 1.3 1.3 0.4 0.3 0.3 0.3 0.3 0.3 0.3 0.3 0.3 -4.9 -0.7 -7.4 -6.9 -7.5 -4.7 5.1 4.3 5.9
Financial Activities Pct Chg Year Ago Prof & Business Services Pct Chg Year Ago Educ & Health Services Pct Chg Year Ago Leisure & Hospitality Pct Chg Year Ago Other Services Pct Chg Year Ago Federal Government Pct Chg Year Ago State & Local Government Pct Chg Year Ago 1.2 1.2 1.2 1.2 1.2 1.3 1.4 1.5 1.5 4.7 -1.3 2.9 3.9 -0.3 8.0 6.1 3.1 2.9 3.0 3.1 3.0 3.0 3.0 3.4 3.7 3.9 4.1 1.3 2.8 -3.8 0.3 0.8 13.0 9.2 4.3 4.2 7.8 7.7 7.5 7.9 7.3 7.3 7.6 7.5 7.7 -1.4 -1.8 -1.8 4.1 -6.8 -0.7 3.9 -0.7 2.2 4.7 4.8 4.9 4.7 4.3 4.5 4.7 5.2 5.2 4.7 2.3 2.6 -4.0 -9.8 6.8 2.8 10.9 1.0 1.0 1.1 1.1 1.0 0.9 1.0 1.1 1.1 1.1 4.2 9.1 2.4 -11.7 -10.3 11.7 12.7 3.4 1.5 0.2 0.2 0.2 0.2 0.2 0.2 0.2 0.2 0.2 3.2 3.8 3.6 3.6 -6.9 -20.0 -0.3 14.2 7.7 4.1 4.1 4.1 4.2 4.1 4.1 4.3 4.4 4.5 1.2 -1.4 0.9 1.2 -1.9 0.3 5.2 2.9 1.2
Other Economic Indicators
Population (Ths) Pct Chg Year Ago Labor Force (Ths) Pct Chg Year Ago Unemployment Rate (%) Total Housing Starts Single-Family Multifamily 144.1 146.7 149.2 151.7 155.0 157.5 159.9 161.9 163.2 1.9 1.9 1.7 1.7 2.1 1.7 1.5 1.2 0.8 48.0 47.8 47.5 47.4 46.5 48.7 50.1 50.0 49.4 0.0 -0.4 -0.7 -0.2 -1.9 4.7 2.9 -0.2 -1.3 6.8 5.9 5.3 5.1 8.5 6.8 6.3 5.8 5.6 476.2 514.8 845.3 873.0 895.4 1030.9 1211.6 1310.7 1255.9 383.5 432.1 824.2 726.6 863.7 972.6 1174.2 1284.2 1230.7 92.7 82.7 21.1 146.4 31.7 58.3 37.4 26.6 25.2


