
Executive Report:
CRIME TRENDS IN COLORADO 2010 – 2021
Callie M. Rennison, PhD
Sheila M. Huss, PhD
February 10, 2023
Our perceptions of crime affect major decisions in our personal lives and our communities – where we live, where our children go to school, what kind of car we drive, whether there is a gun in our household.
Policy makers in Colorado use crime information and concerns from constituents to make decisions ranging from the size of law enforcement budgets to criminal sentencing guidelines.
So it is important for all of us in Colorado to have accurate information about crime, to make sure we are making the right choices for ourselves and for our communities.
But understanding crime data requires more than just checking our social media or the latest headlines. Crime data are easy to manipulate and easy to misinterpret. For example, we might be shocked by a headline blaring that assault in a certain town is up by 100%, but then learn that the actual incidence of assault is still very low – the number of assaults went from one to two. The accuracy of crime data also relies on the willingness of victims to report crimes to local law enforcement, and then the capacity and willingness of the local jurisdiction to properly record and report those crimes to state and federal agencies. Research also shows that most people consistently overestimate their own personal vulnerability to crime, regardless of crime data for their areas or their personal victimization risk. This tendency towards alarm means that crime data can easily be used by politicians looking to play on emotional responses.
just checking our social media or the latest headlines.
For these reasons, the FBI has developed ethical guidelines for the use and interpretation of reported crime data. Unfortunately, those guidelines are often not followed, and panic ensues. However, crime data when used carefully and appropriately can yield important informa tion about trends, areas of concern, and questions that need deeper investigation. For this reason, faculty members at the School of Public Affairs conducted a detailed analysis of crime data for 23 major Colorado jurisdictions over the period 2010-2021, and plan to conduct similar annual analyses in the years to come. This annual Crime in Colorado report is intended to lead to a greater understanding of the nature and uses of crime data among Colorado residents and policymakers, leading to better personal and communitywide decision-making.
Crime Trends in Colorado: 2010 – 2021
Introduction
“But understanding crime data requires more than
Crime data are easy to manipulate and easy to misinterpret.”
“Research also shows that most people consistently overestimate their own personal vulnerability to crime, regardless of crime data for their areas or their personal victimization risk.”
Summary of the 2010-2021 Data
Just as crime rates in individual jurisdictions might be more complicated than they appear, no single crime rate for Colorado can accurately depict the incredible variation in crime rates across time, across jurisdictions, and across types of crime. The heat map below shows this variation in crime trends in the jurisdictions studied over the period 2010-2021.
From this heat map, we can see that attempting to summarize an overall Colorado crime rate masks incredible variation in crime rates across time, across jurisdictions and across types of crime. However, some trends are clear:
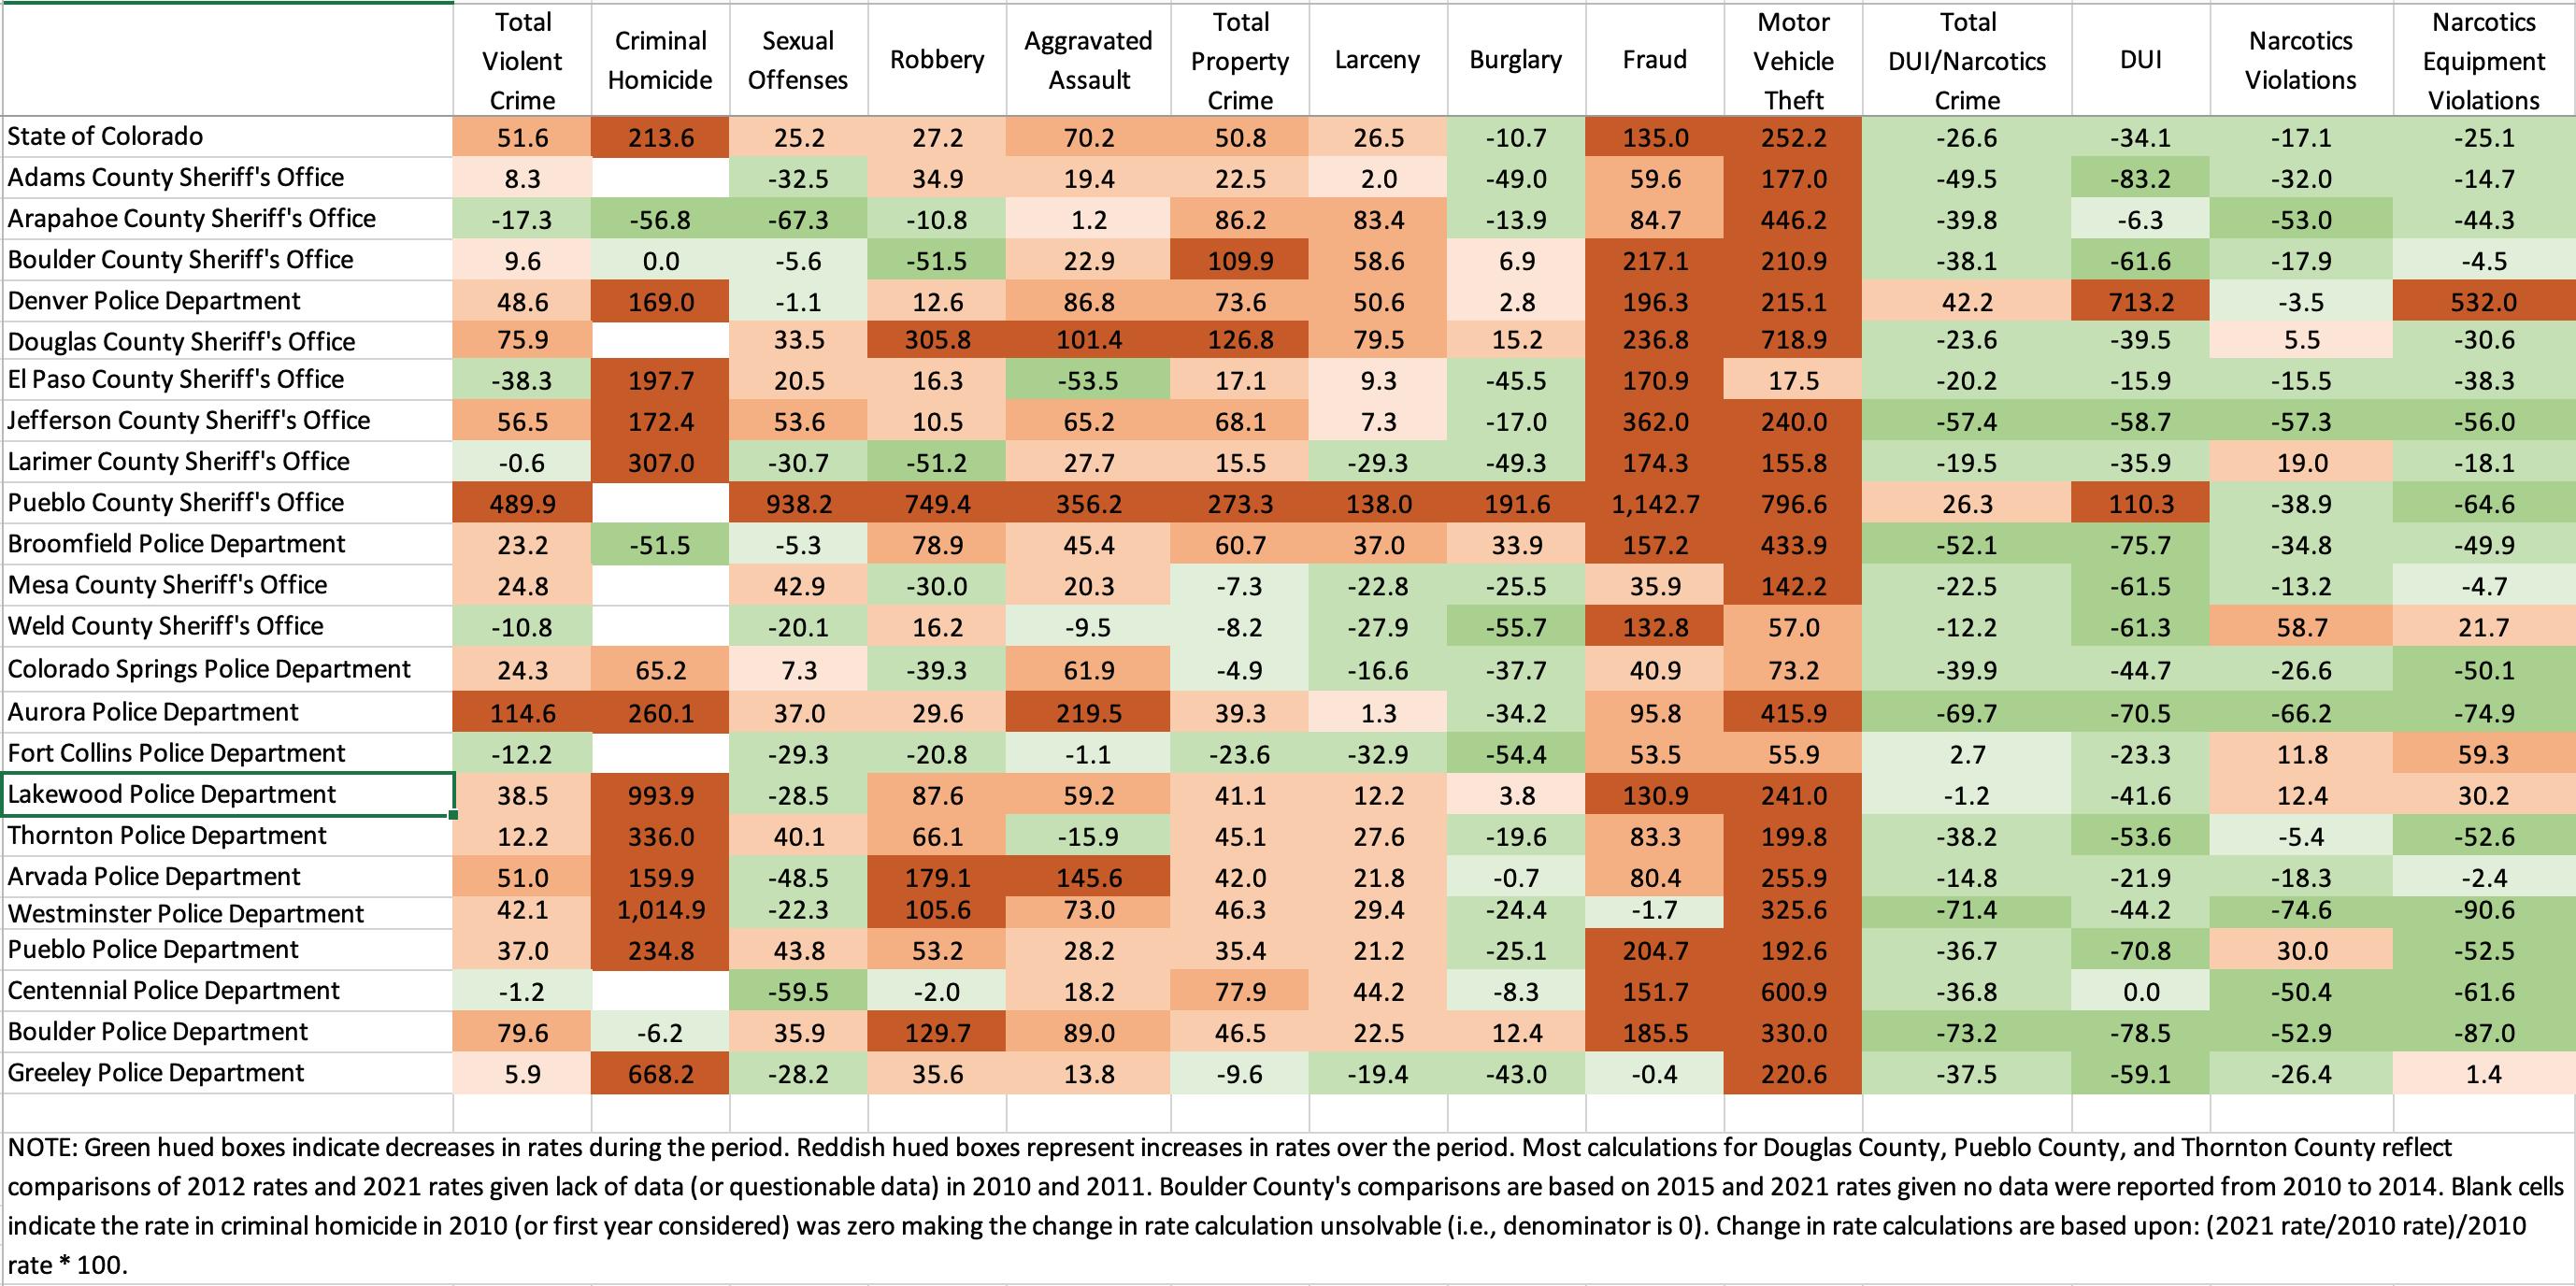
• Burglary rates are down across almost the entire state, with few exceptions
• DUI and narcotics-related crime rates have declined almost universally
• Motor vehicle theft rates have increased uniformly across the state
• Fraud (larceny) rates have increased across most jurisdictions
• Violent crime rates are trending upward in most jurisdictions, although ¼ of the jurisdictions saw a decrease
University of Colorado Denver School of Public Affairs, Center for Community Safety and Resilience
This very high-level data review does not tell us why these trends are occurring. However, a deeper dive into the data, found in the accompanying report, provides some potentially significant insights. For example, we see that what appear to be alarming trends in certain jurisdictions, such as Pueblo County, appear to be related more inconsistencies in reporting to state and local officials.
Another interesting insight from the data is the apparent relationship of guns and violent crimes. In the early part of the period considered, about half of homicides were committed with a firearm. By 2021, more than 80 percent of murder and non-negligent homicides were committed with a firearm. The raw data cannot answer whether there is a cause and effect relationship here.
Finally, it is worth asking whether the COVID-19 pandemic had a significant impact on certain types of crime. For example, did burglary decline because more people stayed at home during the years of the pandemic, thereby decreasing the opportunity for criminals to break into empty houses? Was the increasing rate of motor vehicle theft linked to COVID-caused automotive supply chain issues? These are reasonable hypotheses for further investigation.
For a much more detailed discussion of perceptions of crime, the ethical use of crime data, and a comprehensive analysis of Colorado crime data over the past ten years, please download the full report.
The School of Public Affairs commits to bringing regular objective analysis of crime data to Colorado residents, policy makers, and criminal justice professionals. If you would like more information about our research, programs, and events, please contact ccsr@ucdenver.edu
Crime Trends in Colorado: 2010 – 2021
University of Colorado Denver School of Public Affairs Lawrence Street Center 1380 Lawrence Street, Suite 500 Denver, CO 80204 publicaffairs.ucdenver.edu
ccsr@ucdenver.edu

