For All TREB Member Inquiries:
Market Watch
(416) 443-8152 For All Media/Public Inquiries:
JANUARY 2020
Economic Indicators Real GDP Growth Q3
2019
1.3%
Toronto Employment Growth December
2019
4.6%
Toronto Unemployment Rate (SA) December
2019
5.7%
Inflation (Yr./Yr. CPI Growth) December
2019
2.2%
Bank of Canada Overnight Rate January
2020
1.75%
2020
3.95%
Prime Rate January
Mortgage Rates
January 2020
1 Year
3.64%
3 Year
3.94%
5 Year
5.19%
(416) 443-8158
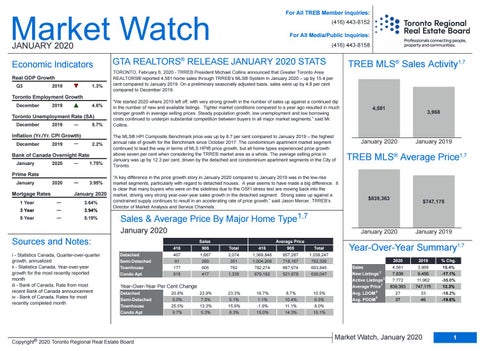
GTA REALTORS® RELEASE JANUARY 2020 STATS TORONTO, February 6, 2020 - TRREB President Michael Collins announced that Greater Toronto Area REALTORS® reported 4,581 home sales through TRREB’s MLS® System in January 2020 – up by 15.4 per cent compared to January 2019. On a preliminary seasonally adjusted basis, sales were up by 4.8 per cent compared to December 2019. “We started 2020 where 2019 left off, with very strong growth in the number of sales up against a continued dip in the number of new and available listings. Tighter market conditions compared to a year ago resulted in much stronger growth in average selling prices. Steady population growth, low unemployment and low borrowing costs continued to underpin substantial competition between buyers in all major market segments,” said Mr. Collins. The MLS® HPI Composite Benchmark price was up by 8.7 per cent compared to January 2019 – the highest annual rate of growth for the Benchmark since October 2017. The condominium apartment market segment continued to lead the way in terms of MLS HPI® price growth, but all home types experienced price growth above seven per cent when considering the TRREB market area as a whole. The average selling price in January was up by 12.3 per cent, driven by the detached and condominium apartment segments in the City of Toronto.
i - Statistics Canada, Quarter-over-quarter growth, annualized ii - Statistics Canada, Year-over-year growth for the most recently reported month iii - Bank of Canada, Rate from most recent Bank of Canada announcement iv - Bank of Canada, Rates for most recently completed month
4,581
3,968
January 2020
January 2019
TREB MLS® Average Price1,7
“A key difference in the price growth story in January 2020 compared to January 2019 was in the low-rise market segments, particularly with regard to detached houses. A year seems to have made a big difference. It is clear that many buyers who were on the sidelines due to the OSFI stress test are moving back into the market, driving very strong year-over-year sales growth in the detached segment. Strong sales up against a constrained supply continues to result in an accelerating rate of price growth,” said Jason Mercer, TRREB’s Director of Market Analysis and Service Channels.
$839,363
$747,175
Sales & Average Price By Major Home Type1,7 January 2020
Sources and Notes:
TREB MLS® Sales Activity1,7
January 2020 Sales
Average Price
Home Type
416
905
Total
416
905
Total
Detached Semi-Detached
407 91
1,667 260
2,074 351
1,369,848 1,004,208
957,287 718,167
1,038,247 792,326
Townhouse Condo Apt
177 918
605 417
782 1,335
782,274 679,182
667,974 521,878
693,845 630,047
23.9% 7.0% 13.3% 5.3%
23.3% 5.1% 15.9% 8.3%
16.7% 1.1% -1.9% 15.0%
8.7% 10.4% 11.1% 14.3%
10.5% 6.5% 8.0% 15.1%
Year-Over-Year Per Cent Change Detached Semi-Detached Townhouse Condo Apt
Copyright® 2020 Toronto Regional Real Estate Board
20.8% 0.0% 25.5% 9.7%
January 2019
Year-Over-Year Summary1,7 Name
2020
2019
Sales
4,581
3,968
15.4%
7,836 7,772 839,363 27 37
9,456 11,962 747,175 33 46
-17.1% -35.0% 12.3% -18.2% -19.6%
New Listings 2 Active Listings 3 1 Average Price 5 Avg. LDOM 5 Avg. PDOM
Market Watch, January 2020
% Chg.
1