For All TREB Member Inquiries:
Market Watch
(416) 443-8152
For All Media/Public Inquiries:
December 2019
(416) 443-8158
Economic Indicators GTA REALTORS® Release December & Annual 2019 Stats Real GDP Growth
Q3
i
2019
1.3%
Toronto Employment Growth ii
November
2019
5.3%
Toronto Unemployment Rate
November
2019
--
5.7%
Inflation Rate (Yr./Yr. CPI Growth) ii
November
2019
2.2%
Bank of Canada Overnight Rate iii
December
2019
--
2019
--
Prime Rate iv
December
----
While sales were up in 2019, the number of new listings entered into TREB’s MLS® System was down by 2.4 per cent year-over-year. For the past decade, annual new listings have been largely in a holding pattern between 150,000 and 160,000, despite the upward trend in home prices over the same period.
1.75% “Over the last ten years, TREB has been drawing attention to the housing supply issue in the GTA. Increasingly, policy makers, research groups of varying scope and other interested parties have acknowledged that the lack of a diverse supply of ownership and rental housing continues 3.95% to hamper housing affordability in the GTA. Taking 2019 as an example, we experienced a strong sales increase up against a decline in supply. Tighter market conditions translated into accelerating price growth. Expect further acceleration in 2020 if there is no relief on the supply front,” said Jason Mercer, TREB’s Chief Market Analyst. 3.64% 3.94% The MLS® Home Price Index Composite Benchmark was up by 7.3 per cent on a year-over-year basis in December 2019. From June 2019 onward, the annual growth rate in the MLS® HPI 5.19% Composite Benchmark accelerated. The average selling price in December 2019 was $837,788 – up almost 12 per cent year-over-year. For calendar year 2019, the average selling price was $819,319 – up by four per cent compared to $787,856 in 2018.
Sources and Notes: i - Statistics Canada, Quarter-over-quarter growth, annualized ii - Statistics Canada, Year-over-year growth for the most recently reported month iii - Bank of Canada, Rate from most recent Bank of Canada announcement iv - Bank of Canada, Rates for most recently completed month
Sales & Average Price By Major Home Type1,7 December Metrics2019 Sales Average Price 2019 Detached Semi - Detached Townhouse Condo Apartment
416
905
Total
416
905
Total
465 126 185 884
1,519 255 546 371
1,984 381 731 1,255
$1,363,357 $1,004,477 $717,369 $656,233
$956,792 $706,651 $657,577 $508,173
$1,052,081 $805,144 $672,709 $612,464
19.5% 6.9% 0.4% 10.3%
7.7% 7.0% 11.1% 11.9%
11.6% 6.5% 7.8% 10.4%
Year-Over-Year Per Cent Change Detached Semi - Detached Townhouse Condo Apartment
Detached 38.0% 23.0% 26.2% Detached 12.1% 8.6%Semi - 13.8% Townhouse 14.2% 21.1% 19.2% Apartment 6.9% 5.1%Condo11.4%
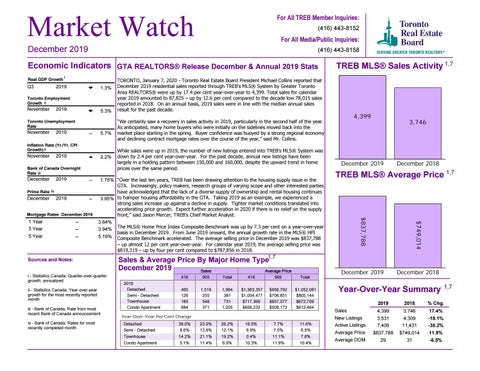
4,399
3,746
December 2019
December 2018
TREB MLS® Average Price 1,7
$749,014
11 Year Year 33 Year Year 55 Year Year
“We certainly saw a recovery in sales activity in 2019, particularly in the second half of the year. As anticipated, many home buyers who were initially on the sidelines moved back into the market place starting in the spring. Buyer confidence was buoyed by a strong regional economy and declining contract mortgage rates over the course of the year,” said Mr. Collins.
$837,788
Mortgage December2019 2019 Month RatesDecember
TORONTO, January 7, 2020 - Toronto Real Estate Board President Michael Collins reported that December 2019 residential sales reported through TREB’s MLS® System by Greater Toronto Area REALTORS® were up by 17.4 per cent year-over-year to 4,399. Total sales for calendar year 2019 amounted to 87,825 – up by 12.6 per cent compared to the decade low 78,015 sales reported in 2018. On an annual basis, 2019 sales were in line with the median annual sales result for the past decade.
TREB MLS® Sales Activity 1,7
December 2019
December 2018
Year-Over-Year Summary Sales New Listings Active Listings Average Price Average DOM
1,7
2019
2018
% Chg.
4,399 3,531 7,406 $837,788 29
3,746 4,309 11,431 $749,014 31
17.4% -18.1% -35.2% 11.9% -6.5%