For All TREB Member Inquiries:
Market Watch
(416) 443-8152
For All Media/Public Inquiries:
November 2019
(416) 443-8158
Economic Indicators GTA REALTORS® Release November 2019 Stats Real GDP Growth
Q2
i
2019
3.7%
Toronto Employment Growth ii
October
2019
5.6%
Toronto Unemployment Rate
September
2019
2019
--
Bank of Canada Overnight Rate iii
November
2019
--
2019
--
Prime Rate iv
November
1.9%
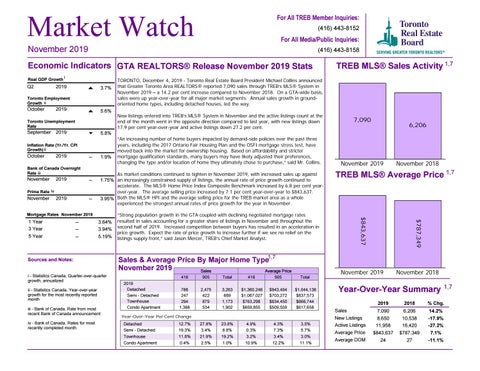
New listings entered into TREB’s MLS® System in November and the active listings count at the end of the month went in the opposite direction compared to last year, with new listings down 17.9 per cent year-over-year and active listings down 27.2 per cent.
7,090
6,206
Sources and Notes: i - Statistics Canada, Quarter-over-quarter growth, annualized ii - Statistics Canada, Year-over-year growth for the most recently reported month iii - Bank of Canada, Rate from most recent Bank of Canada announcement iv - Bank of Canada, Rates for most recently completed month
“Strong population growth in the GTA coupled with declining negotiated mortgage rates resulted in sales accounting for a greater share of listings in November and throughout the second half of 2019. Increased competition between buyers has resulted in an acceleration in price growth. Expect the rate of price growth to increase further if we see no relief on the listings supply front,” said Jason Mercer, TREB’s Chief Market Analyst.
Sales & Average Price By Major Home Type1,7 November Metrics 2019 Sales Average Price 2019 Detached Semi - Detached Townhouse Condo Apartment
416
905
Total
416
905
Total
788 247 294 1,368
2,475 422 879 534
3,263 669 1,173 1,902
$1,360,246 $1,067,027 $763,298 $659,855
$943,494 $703,272 $634,450 $509,559
$1,044,138 $837,573 $666,744 $617,658
4.9% 0.3% 3.2% 10.9%
4.3% 7.3% 3.4% 12.2%
3.5% 5.7% 3.0% 11.1%
Year-Over-Year Per Cent Change Detached Semi - Detached Townhouse Condo Apartment
Detached 12.7% 27.8% 23.8% Semi - Detached 19.3% 3.4% 8.8% Townhouse 11.8% 21.9% 19.2% 0.4%Condo Apartment 2.5% 1.0%
November 2018
TREB MLS® Average Price 1,7
$787,349
3.64% 3.94% 5.19%
November 2019
$843,637
----
“An increasing number of home buyers impacted by demand-side policies over the past three years, including the 2017 Ontario Fair Housing Plan and the OSFI mortgage stress test, have moved back into the market for ownership housing. Based on affordability and stricter mortgage qualification standards, many buyers may have likely adjusted their preferences, changing the type and/or location of home they ultimately chose to purchase,” said Mr. Collins.
As market conditions continued to tighten in November 2019, with increased sales up against 1.75% an increasingly constrained supply of listings, the annual rate of price growth continued to accelerate. The MLS® Home Price Index Composite Benchmark increased by 6.8 per cent yearover-year. The average selling price increased by 7.1 per cent year-over-year to $843,637. 3.95% Both the MLS® HPI and the average selling price for the TREB market area as a whole experienced the strongest annual rates of price growth for the year in November.
Mortgage November2019 2019 Month RatesNovember
11 Year Year 33 Year Year 55 Year Year
TORONTO, December 4, 2019 - Toronto Real Estate Board President Michael Collins announced that Greater Toronto Area REALTORS® reported 7,090 sales through TREB’s MLS® System in November 2019 – a 14.2 per cent increase compared to November 2018. On a GTA-wide basis, sales were up year-over-year for all major market segments. Annual sales growth in groundoriented home types, including detached houses, led the way.
5.8%
Inflation Rate (Yr./Yr. CPI Growth) ii
October
TREB MLS® Sales Activity 1,7
November 2019
November 2018
Year-Over-Year Summary Sales New Listings Active Listings Average Price Average DOM
1,7
2019
2018
% Chg.
7,090 8,650 11,958 $843,637 24
6,206 10,538 16,420 $787,349 27
14.2% -17.9% -27.2% 7.1% -11.1%