For All TREB Member Inquiries:
Market Watch
(416) 443-8152
For All Media/Public Inquiries:
September 2018
(416) 443-8158
GTA REALTORS® Release September Stats Economic Indicators TORONTO, ONTARIO, October 3, 2018 – Toronto Real Estate Board President Garry Bhaura Real GDP Growth
Q2
i
2018
2.9%
Toronto Employment Growth ii
August
2018
2.3%
Toronto Unemployment Rate
August
2018
--
6.1%
Inflation Rate (Yr./Yr. CPI Growth) ii
August
2018
2.8%
Bank of Canada Overnight Rate iii
September
2018
--
2018
--
Prime Rate iv
September
3.49% 4.30% 5.34%
Sources and Notes: i - Statistics Canada, Quarter-over-quarter growth, annualized ii - Statistics Canada, Year-over-year growth for the most recently reported month iii - Bank of Canada, Rate from most recent Bank of Canada announcement iv - Bank of Canada, Rates for most recently completed month
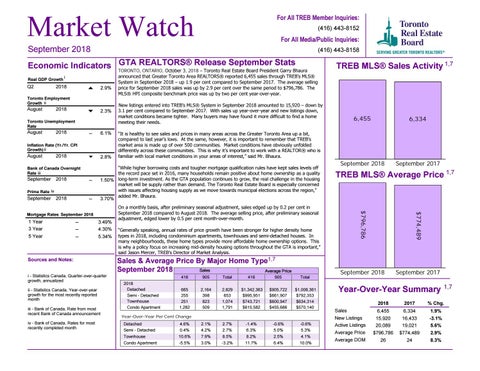
6,455
6,334
September 2018
September 2017
“It is healthy to see sales and prices in many areas across the Greater Toronto Area up a bit, compared to last year’s lows. At the same, however, it is important to remember that TREB’s market area is made up of over 500 communities. Market conditions have obviously unfolded differently across these communities. This is why it’s important to work with a REALTOR® who is familiar with local market conditions in your areas of interest,” said Mr. Bhaura.
On a monthly basis, after preliminary seasonal adjustment, sales edged up by 0.2 per cent in September 2018 compared to August 2018. The average selling price, after preliminary seasonal adjustment, edged lower by 0.5 per cent month-over-month. “Generally speaking, annual rates of price growth have been stronger for higher density home types in 2018, including condominium apartments, townhouses and semi-detached houses. In many neighbourhoods, these home types provide more affordable home ownership options. This is why a policy focus on increasing mid-density housing options throughout the GTA is important,” said Jason Mercer, TREB’s Director of Market Analysis.
Sales & Average Price By Major Home Type1,7 Metrics 2018 Sales September Average Price 2018 Detached Semi - Detached Townhouse Condo Apartment
416
905
Total
416
905
Total
665 255 251 1,282
2,164 398 823 509
2,829 653 1,074 1,791
$1,342,363 $995,951 $743,721 $615,582
$905,722 $661,907 $600,947 $455,686
$1,008,361 $792,353 $634,314 $570,140
-1.4% 6.3% 8.2% 11.7%
-0.6% 5.0% 2.5% 6.4%
-0.6% 5.3% 4.1% 10.0%
Year-Over-Year Per Cent Change Detached Semi - Detached Townhouse Condo Apartment
4.6%Detached 2.1% 2.7% 0.4%Semi - Detached 4.2% 2.7% Townhouse 10.6% 7.9% 8.5% Condo Apartment -5.5% 3.0% -3.2%
TREB MLS® Average Price 1,7
$774,489
----
New listings entered into TREB’s MLS® System in September 2018 amounted to 15,920 – down by 3.1 per cent compared to September 2017. With sales up year-over-year and new listings down, market conditions became tighter. Many buyers may have found it more difficult to find a home meeting their needs.
$796,786
11 Year Year 33 Year Year 55 Year Year
announced that Greater Toronto Area REALTORS® reported 6,455 sales through TREB’s MLS® System in September 2018 – up 1.9 per cent compared to September 2017. The average selling price for September 2018 sales was up by 2.9 per cent over the same period to $796,786. The MLS® HPI composite benchmark price was up by two per cent year-over-year.
“While higher borrowing costs and tougher mortgage qualification rules have kept sales levels off the record pace set in 2016, many households remain positive about home ownership as a quality 1.50% long-term investment. As the GTA population continues to grow, the real challenge in the housing market will be supply rather than demand. The Toronto Real Estate Board is especially concerned with issues affecting housing supply as we move towards municipal elections across the region,” added Mr. Bhaura. 3.70%
Mortgage September2018 2018 Month RatesSeptember
TREB MLS® Sales Activity 1,7
September 2018
September 2017
Year-Over-Year Summary Sales New Listings Active Listings Average Price Average DOM
1,7
2018
2017
% Chg.
6,455 15,920 20,089 $796,786 26
6,334 16,433 19,021 $774,489 24
1.9% -3.1% 5.6% 2.9% 8.3%