For All TREB Member Inquiries:
Market Watch
(416) 443-8152
For All Media/Public Inquiries:
July 2018
(416) 443-8158
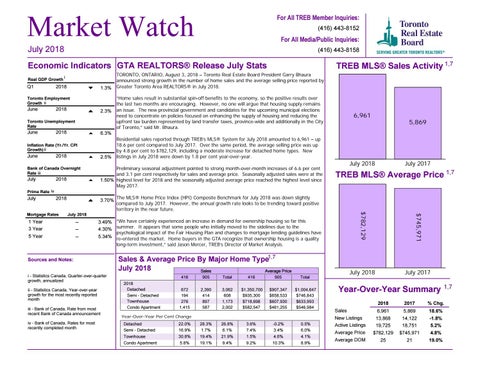
TREB MLS® Sales Activity 1,7
Economic Indicators GTA REALTORS® Release July Stats Real GDP Growth
Q1
i
2018
1.3%
Toronto Employment Growth ii
June
2018
2.3%
Toronto Unemployment Rate
June
2018
2018
2.5%
Bank of Canada Overnight Rate iii
July
“Home sales result in substantial spin-off benefits to the economy, so the positive results over the last two months are encouraging. However, no one will argue that housing supply remains an issue. The new provincial government and candidates for the upcoming municipal elections need to concentrate on policies focused on enhancing the supply of housing and reducing the upfront tax burden represented by land transfer taxes, province-wide and additionally in the City of Toronto,” said Mr. Bhaura.
6,961
5,869
6.3%
Inflation Rate (Yr./Yr. CPI Growth) ii
June
TORONTO, ONTARIO, August 3, 2018 – Toronto Real Estate Board President Garry Bhaura announced strong growth in the number of home sales and the average selling price reported by Greater Toronto Area REALTORS® in July 2018.
2018
Residential sales reported through TREB’s MLS® System for July 2018 amounted to 6,961 – up 18.6 per cent compared to July 2017. Over the same period, the average selling price was up by 4.8 per cent to $782,129, including a moderate increase for detached home types. New listings in July 2018 were down by 1.8 per cent year-over-year.
Preliminary seasonal adjustment pointed to strong month-over-month increases of 6.6 per cent and 3.1 per cent respectively for sales and average price. Seasonally adjusted sales were at the 1.50% highest level for 2018 and the seasonally adjusted average price reached the highest level since May 2017.
July 2018
July 2017
TREB MLS® Average Price 1,7
Prime Rate iv
July
2018
3.70%
11 Year Year 33 Year Year 55 Year Year
----
3.49% 4.30% 5.34%
Sources and Notes: i - Statistics Canada, Quarter-over-quarter growth, annualized ii - Statistics Canada, Year-over-year growth for the most recently reported month iii - Bank of Canada, Rate from most recent Bank of Canada announcement iv - Bank of Canada, Rates for most recently completed month
“We have certainly experienced an increase in demand for ownership housing so far this summer. It appears that some people who initially moved to the sidelines due to the psychological impact of the Fair Housing Plan and changes to mortgage lending guidelines have re-entered the market. Home buyers in the GTA recognize that ownership housing is a quality long-term investment,” said Jason Mercer, TREB’s Director of Market Analysis.
Sales & Average Price By Major Home Type1,7 July 2018 Metrics Sales Average Price 2018 Detached Semi - Detached Townhouse Condo Apartment
416
905
Total
416
905
Total
672 194 276 1,415
2,390 414 897 587
3,062 608 1,173 2,002
$1,350,700 $935,300 $718,698 $582,547
$907,347 $658,533 $607,930 $461,255
$1,004,647 $746,843 $633,993 $546,984
3.6% 7.4% 1.5% 9.2%
-0.2% 3.4% 4.6% 10.3%
0.5% 6.0% 4.1% 8.9%
Year-Over-Year Per Cent Change Detached Semi - Detached Townhouse Condo Apartment
Detached 22.0% 28.3% 26.8% Semi - Detached 16.9% 1.7% 6.1% Townhouse 30.8% 19.4% 21.9% Apartment 9.4% 5.8%Condo19.1%
$745,971
Mortgage 20182018 Month RatesJuly July
$782,129
The MLS® Home Price Index (HPI) Composite Benchmark for July 2018 was down slightly compared to July 2017. However, the annual growth rate looks to be trending toward positive territory in the near future.
July 2018
July 2017
Year-Over-Year Summary Sales New Listings Active Listings Average Price Average DOM
1,7
2018
2017
% Chg.
6,961 13,868 19,725 $782,129 25
5,869 14,122 18,751 $745,971 21
18.6% -1.8% 5.2% 4.8% 19.0%