For All TREB Member Inquiries:
Market Watch
(416) 443-8152
For All Media/Public Inquiries:
June 2018
(416) 443-8158
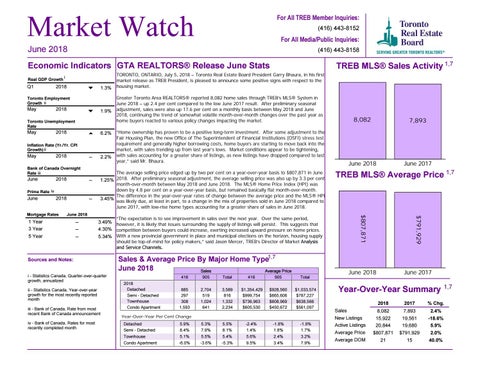
TREB MLS® Sales Activity 1,7
Economic Indicators GTA REALTORS® Release June Stats Real GDP Growth
Q1
i
2018
1.3%
Toronto Employment Growth ii
May
2018
1.9%
Toronto Unemployment Rate
May
2018
6.2%
Inflation Rate (Yr./Yr. CPI Growth) ii
May
2018
--
Bank of Canada Overnight Rate iii
June
2018
--
2018
--
Prime Rate iv
June
----
The average selling price edged up by two per cent on a year-over-year basis to $807,871 in June 1.25% 2018. After preliminary seasonal adjustment, the average selling price was also up by 3.3 per cent month-over-month between May 2018 and June 2018. The MLS® Home Price Index (HPI) was down by 4.8 per cent on a year-over-year basis, but remained basically flat month-over-month. The difference in the year-over-year rates of change between the average price and the MLS® HPI 3.45% was likely due, at least in part, to a change in the mix of properties sold in June 2018 compared to June 2017, with low-rise home types accounting for a greater share of sales in June 2018. “The expectation is to see improvement in sales over the next year. Over the same period, 3.49% however, it is likely that issues surrounding the supply of listings will persist. This suggests that 4.30% competition between buyers could increase, exerting increased upward pressure on home prices. 5.34% With a new provincial government in place and municipal elections on the horizon, housing supply should be top-of-mind for policy makers,” said Jason Mercer, TREB’s Director of Market Analysis and Service Channels.
Sources and Notes: i - Statistics Canada, Quarter-over-quarter growth, annualized ii - Statistics Canada, Year-over-year growth for the most recently reported month iii - Bank of Canada, Rate from most recent Bank of Canada announcement iv - Bank of Canada, Rates for most recently completed month
“Home ownership has proven to be a positive long-term investment. After some adjustment to the Fair Housing Plan, the new Office of The Superintendent of Financial Institutions (OSFI) stress test requirement and generally higher borrowing costs, home buyers are starting to move back into the market, with sales trending up from last year’s lows. Market conditions appear to be tightening, with sales accounting for a greater share of listings, as new listings have dropped compared to last year,” said Mr. Bhaura.
Sales & Average Price By Major Home Type1,7 June 2018 Metrics Sales Average Price 2018 Detached Semi - Detached Townhouse Condo Apartment
416
905
Total
416
905
Total
885 297 308 1,593
2,704 519 1,024 641
3,589 816 1,332 2,234
$1,354,429 $999,754 $736,963 $605,530
$928,560 $665,606 $608,969 $450,672
$1,033,574 $787,227 $638,566 $561,097
-2.4% 1.4% 5.6% 9.5%
-1.8% 1.8% 2.4% 3.4%
-1.9% 1.7% 3.2% 7.9%
Year-Over-Year Per Cent Change Detached Semi - Detached Townhouse Condo Apartment
5.9%Detached 5.3% 5.5% 8.4%Semi - Detached 7.9% 8.1% 5.1%Townhouse 5.5% 5.4% Condo -3.6% Apartment -5.3% -6.0%
8,082
7,893
June 2018
June 2017
TREB MLS® Average Price 1,7
$791,929
11 Year Year 33 Year Year 55 Year Year
Greater Toronto Area REALTORS® reported 8,082 home sales through TREB’s MLS® System in June 2018 – up 2.4 per cent compared to the low June 2017 result. After preliminary seasonal adjustment, sales were also up 17.6 per cent on a monthly basis between May 2018 and June 2018, continuing the trend of somewhat volatile month-over-month changes over the past year as home buyers reacted to various policy changes impacting the market.
$807,871
Mortgage 20182018 Month RatesJuneJune
2.2%
TORONTO, ONTARIO, July 5, 2018 – Toronto Real Estate Board President Garry Bhaura, in his first market release as TREB President, is pleased to announce some positive signs with respect to the housing market.
June 2018
June 2017
Year-Over-Year Summary Sales New Listings Active Listings Average Price Average DOM
1,7
2018
2017
% Chg.
8,082 15,922 20,844 $807,871 21
7,893 19,561 19,680 $791,929 15
2.4% -18.6% 5.9% 2.0% 40.0%