For All TREB Member Inquiries:
Market Watch
(416) 443-8152
For All Media/Public Inquiries:
March 2018
(416) 443-8158
Economic Indicators GTA REALTORS® Release March Stats Real GDP Growth
Q4
i
2017
--
1.7%
Toronto Employment Growth ii
February
2018
4.0%
Toronto Unemployment Rate
February
2018
5.8%
Inflation Rate (Yr./Yr. CPI Growth) ii
February
2018
2.2%
Bank of Canada Overnight Rate iii
March
2018
2018
The MLS Home Price Index Composite Benchmark was down by 1.5 percent on a year-over-year basis for the TREB market area as a whole. The overall average selling price was down by 14.3 per cent compared to March 2017.
----
3.34% “Right now, when we are comparing home prices, we are comparing two starkly different periods 4.15% of time: last year, when we had less than a month of inventory versus this year with inventory 5.14% levels ranging between two and three months. It makes sense that we haven’t seen prices climb back to last year’s peak. However, in the second half of the year, expect to see the annual rate of price growth improve compared to Q1, as sales increase relative to the below-average level of listings,” said Jason Mercer, TREB’s Director of Market Analysis.
Sources and Notes: i - Statistics Canada, Quarter-over-quarter growth, annualized ii - Statistics Canada, Year-over-year growth for the most recently reported month iii - Bank of Canada, Rate from most recent Bank of Canada announcement iv - Bank of Canada, Rates for most recently completed month
Sales & Average Price By Major Home Type1,7 Metrics Sales Average Price March 2018 416 905 Total 416 905 2018 Detached Semi - Detached Townhouse Condo Apartment
706 236 260 1,573
2,414 450 865 610
3,120 686 1,125 2,183
Total
$1,293,903 $1,032,358 $735,650 $590,184
$921,515 $651,967 $609,375 $449,967
$1,005,779 $782,831 $638,558 $551,003
-17.1% -5.0% -3.5% 7.1%
-17.9% -12.4% -11.7% 2.1%
-17.1% -8.8% -9.5% 6.1%
Year-Over-Year Per Cent Change Detached Semi - Detached Townhouse Condo Apartment
Detached -41.1% -47.7% -46.3% Semi --31.6% Detached -30.6% -28.5% Townhouse -27.8% -35.9% -34.2% Condo-34.7% Apartment-32.7% -32.0%
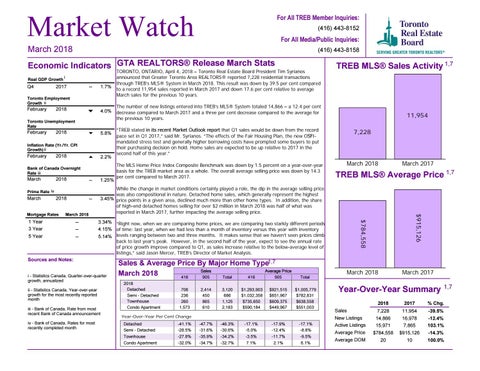
7,228
March 2018
March 2017
TREB MLS® Average Price 1,7
$915,126
--
While the change in market conditions certainly played a role, the dip in the average selling price was also compositional in nature. Detached home sales, which generally represent the highest 3.45% price points in a given area, declined much more than other home types. In addition, the share of high-end detached homes selling for over $2 million in March 2018 was half of what was reported in March 2017, further impacting the average selling price.
11,954
$784,558
11 Year Year 33 Year Year 55 Year Year
“TREB stated in its recent Market Outlook report that Q1 sales would be down from the record pace set in Q1 2017,” said Mr. Syrianos. “The effects of the Fair Housing Plan, the new OSFImandated stress test and generally higher borrowing costs have prompted some buyers to put their purchasing decision on hold. Home sales are expected to be up relative to 2017 in the second half of this year.”
1.25%
Mortgage March 2018 2018 Month RatesMarch
TREB MLS® Sales Activity 1,7
The number of new listings entered into TREB’s MLS® System totaled 14,866 – a 12.4 per cent decrease compared to March 2017 and a three per cent decrease compared to the average for the previous 10 years.
--
Prime Rate iv
March
TORONTO, ONTARIO, April 4, 2018 – Toronto Real Estate Board President Tim Syrianos announced that Greater Toronto Area REALTORS® reported 7,228 residential transactions through TREB’s MLS® System in March 2018. This result was down by 39.5 per cent compared to a record 11,954 sales reported in March 2017 and down 17.6 per cent relative to average March sales for the previous 10 years.
March 2018
March 2017
Year-Over-Year Summary Sales New Listings Active Listings Average Price Average DOM
1,7
2018
2017
% Chg.
7,228 14,866 15,971 $784,558 20
11,954 16,978 7,865 $915,126 10
-39.5% -12.4% 103.1% -14.3% 100.0%