For All TREB Member Inquiries:
Market Watch
(416) 443-8152
For All Media/Public Inquiries:
January 2018
(416) 443-8158
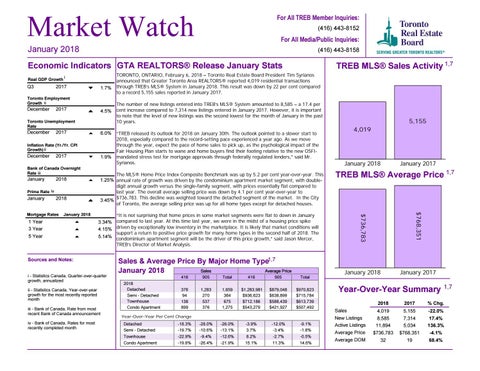
TREB MLS® Sales Activity 1,7
Economic Indicators GTA REALTORS® Release January Stats Real GDP Growth
Q3
i
2017
1.7%
Toronto Employment Growth ii
December
2017
4.5%
Toronto Unemployment Rate
December
2017
6.0%
Inflation Rate (Yr./Yr. CPI Growth) ii
December
2017
Bank of Canada Overnight Rate iii
January
2018
Prime Rate iv
January
2018
1.9%
“TREB released its outlook for 2018 on January 30th. The outlook pointed to a slower start to 2018, especially compared to the record-setting pace experienced a year ago. As we move through the year, expect the pace of home sales to pick up, as the psychological impact of the Fair Housing Plan starts to wane and home buyers find their footing relative to the new OSFImandated stress test for mortgage approvals through federally regulated lenders,” said Mr. Syrianos.
ii - Statistics Canada, Year-over-year growth for the most recently reported month iii - Bank of Canada, Rate from most recent Bank of Canada announcement
Sales & Average Price By Major Home Type1,7 Metrics Sales Average Price January 2018 2018 Detached Semi - Detached Townhouse Condo Apartment
416
905
Total
416
905
Total
376 94 138 899
1,283 270 537 376
1,659 364 675 1,275
$1,283,981 $936,623 $712,186 $543,279
$879,048 $638,899 $588,439 $421,927
$970,823 $715,784 $613,739 $507,492
-3.9% 3.7% 8.2% 15.1%
-12.0% -3.4% -2.7% 11.3%
-9.1% -1.8% -0.5% 14.6%
Year-Over-Year Per Cent Change Detached Semi - Detached Townhouse Condo Apartment
Detached -18.3% -28.0% -26.0% Semi --10.6% Detached -13.1% -19.7% Townhouse -22.9% -9.4% -12.6% Condo-26.4% Apartment-21.9% -19.8%
4,019
January 2018
January 2017
TREB MLS® Average Price 1,7
$768,351
i - Statistics Canada, Quarter-over-quarter growth, annualized
“It is not surprising that home prices in some market segments were flat to down in January compared to last year. At this time last year, we were in the midst of a housing price spike driven by exceptionally low inventory in the marketplace. It is likely that market conditions will support a return to positive price growth for many home types in the second half of 2018. The condominium apartment segment will be the driver of this price growth,” said Jason Mercer, TREB’s Director of Market Analysis.
5,155
$736,783
3.34% 4.15% 5.14%
Sources and Notes:
iv - Bank of Canada, Rates for most recently completed month
The number of new listings entered into TREB’s MLS® System amounted to 8,585 – a 17.4 per cent increase compared to 7,314 new listings entered in January 2017. However, it is important to note that the level of new listings was the second lowest for the month of January in the past 10 years.
The MLS® Home Price Index Composite Benchmark was up by 5.2 per cent year-over-year. This 1.25% annual rate of growth was driven by the condominium apartment market segment, with doubledigit annual growth versus the single-family segment, with prices essentially flat compared to last year. The overall average selling price was down by 4.1 per cent year-over-year to $736,783. This decline was weighted toward the detached segment of the market. In the City 3.45% of Toronto, the average selling price was up for all home types except for detached houses.
Mortgage January 2018 2018 Month RatesJanuary
11 Year Year 33 Year Year 55 Year Year
TORONTO, ONTARIO, February 6, 2018 – Toronto Real Estate Board President Tim Syrianos announced that Greater Toronto Area REALTORS® reported 4,019 residential transactions through TREB’s MLS® System in January 2018. This result was down by 22 per cent compared to a record 5,155 sales reported in January 2017.
January 2018
January 2017
Year-Over-Year Summary Sales New Listings Active Listings Average Price Average DOM
1,7
2018
2017
% Chg.
4,019 8,585 11,894 $736,783 32
5,155 7,314 5,034 $768,351 19
-22.0% 17.4% 136.3% -4.1% 68.4%