For All TREB Member Inquiries:
Market Watch
(416) 443-8152
For All Media/Public Inquiries:
February 2016
(416) 443-8158
TREB MLS® Sales Activity 1,7
Economic Indicators Record February Sales Real GDP Growth
Q4
i
2015
0.8%
Toronto Employment Growth ii
January
2016
4.8%
Toronto Unemployment Rate
January
2016
7.1%
Inflation Rate (Yr./Yr. CPI Growth) ii
January
2016
2.0%
Bank of Canada Overnight Rate iii
February
2016
-
Prime Rate iv
February
2016
-
----
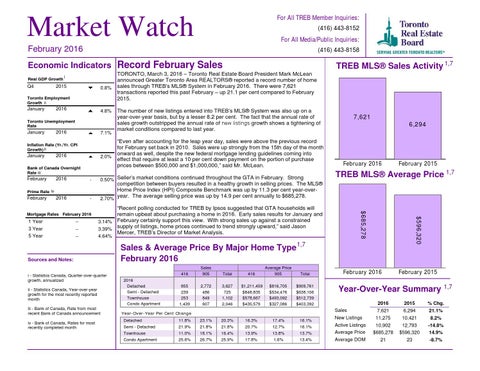
“Even after accounting for the leap year day, sales were above the previous record for February set back in 2010. Sales were up strongly from the 15th day of the month onward as well, despite the new federal mortgage lending guidelines coming into effect that require at least a 10 per cent down payment on the portion of purchase prices between $500,000 and $1,000,000,” said Mr. McLean.
0.50% Seller’s market conditions continued throughout the GTA in February. Strong
6,294
February 2016
February 2015
TREB MLS® Average Price 1,7
competition between buyers resulted in a healthy growth in selling prices. The MLS® Home Price Index (HPI) Composite Benchmark was up by 11.3 per cent year-overyear. The average selling price was up by 14.9 per cent annually to $685,278. 2.70% “Recent polling conducted for TREB by Ipsos suggested that GTA households will remain upbeat about purchasing a home in 2016. Early sales results for January and 3.14% February certainly support this view. With strong sales up against a constrained 3.39% supply of listings, home prices continued to trend strongly upward,” said Jason Mercer, TREB’s Director of Market Analysis. 4.64%
Sources and Notes:
Sales & Average Price By Major Home Type 1,7 February 2016 Metrics
i - Statistics Canada, Quarter-over-quarter growth, annualized ii - Statistics Canada, Year-over-year growth for the most recently reported month iii - Bank of Canada, Rate from most recent Bank of Canada announcement iv - Bank of Canada, Rates for most recently completed month
7,621
$596,320
11 Year Year 33 Year Year 55 Year Year
The number of new listings entered into TREB’s MLS® System was also up on a year-over-year basis, but by a lesser 8.2 per cent. The fact that the annual rate of sales growth outstripped the annual rate of new listings growth shows a tightening of market conditions compared to last year.
$685,278
Mortgage February 2016 2016 Month RatesFebruary
TORONTO, March 3, 2016 – Toronto Real Estate Board President Mark McLean announced Greater Toronto Area REALTORS® reported a record number of home sales through TREB’s MLS® System in February 2016. There were 7,621 transactions reported this past February – up 21.1 per cent compared to February 2015.
2016 Detached Semi - Detached Townhouse Condo Apartment
416
Sales 905
Total
416
Average Price 905
Total
855 239 253 1,439
2,772 486 849 607
3,627 725 1,102 2,046
$1,211,459 $848,835 $578,667 $435,579
$816,705 $534,476 $493,092 $327,086
$909,761 $638,106 $512,739 $403,392
Year-Over-Year Per Cent Change Detached Semi - Detached Townhouse Condo Apartment
Detached 11.8% 23.1% 20.3% Semi - 21.8% Detached 21.8% 21.9% Townhouse 11.0% 18.1% 16.4% Condo26.7% Apartment 25.9% 25.6%
16.3% 20.7% 13.9% 17.8%
17.4% 12.7% 13.8% 1.6%
16.1% 16.1% 13.7% 13.4%
February 2016
February 2015
Year-Over-Year Summary Sales New Listings Active Listings Average Price Average DOM
1,7
2016
2015
% Chg.
7,621 11,275 10,902 $685,278 21
6,294 10,421 12,793 $596,320 23
21.1% 8.2% -14.8% 14.9% -8.7%