For All TREB Member Inquiries:
Market Watch
(416) 443-8152
For All Media/Public Inquiries:
January 2016
(416) 443-8158
TREB MLS® Sales Activity 1,7
Economic Indicators Strong Start to 2016 Real GDP Growth
Q3
i
2015
2.3%
Toronto Employment Growth ii
December
2015
4.5%
Toronto Unemployment Rate
December
2015
--
7.0%
Inflation Rate (Yr./Yr. CPI Growth) ii
December
2015
1.6%
Bank of Canada Overnight Rate iii
December
2015
--
0.50%
2015
--
2.70%
Prime Rate iv
December
----
3.14% 3.39% 4.64%
Sources and Notes:
The MLS® Home Price Index Composite Benchmark Price for January 2016 was up by 10.7 per cent on a year-over-year basis. The average selling price over the same period was up by 14.1 per cent. The difference in the annual growth rates for the MLS® HPI and average price was largely due to a greater share of high-end detached homes sold in the regions surrounding the City of Toronto this year compared to last. The MLS® HPI removes the impact of shifts in the share of different property types sold from one year to the next. “Market conditions in January were tighter compared to a year earlier, with an annual increase in sales up against a decline in listings. This is why growth in the MLS® HPI benchmarks continued to be strong, especially for singles, semis and townhouses, where there has been a persistent lack of inventory,” said Jason Mercer, TREB’s Director of Market Analysis.
Sales & Average Price By Major Home Type 1,7 January 2016 Metrics
i - Statistics Canada, Quarter-over-quarter growth, annualized ii - Statistics Canada, Year-over-year growth for the most recently reported month iii - Bank of Canada, Rate from most recent Bank of Canada announcement iv - Bank of Canada, Rates for most recently completed month
2016 Detached Semi - Detached Townhouse Condo Apartment
416
Sales 905
Total
416
Average Price 905
Total
496 122 172 897
1,613 330 559 405
2,109 452 731 1,302
$1,061,789 $713,972 $519,732 $416,104
$783,565 $515,024 $472,039 $319,855
$848,999 $568,723 $483,261 $386,165
Year-Over-Year Per Cent Change Detached Semi - Detached Townhouse Condo Apartment
Detached 11.2% 5.4% Semi - 14.6% Detached -3.2% Townhouse 14.7% 8.3% Condo Apartment 11.6% 3.6%
6.7% 9.2% 9.8% 9.0%
11.6% 7.3% 1.3% 8.6%
20.9% 12.8% 12.0% 3.1%
18.5% 9.3% 9.3% 7.5%
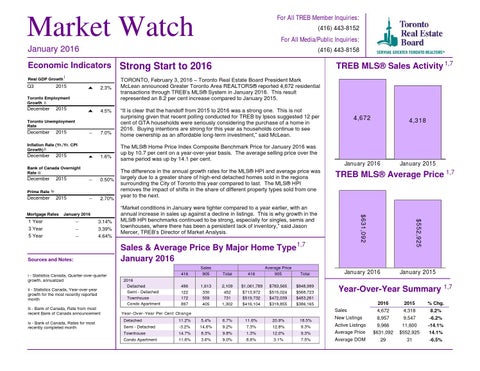
4,672
4,318
January 2016
January 2015
TREB MLS® Average Price 1,7
$552,925
11 Year Year 33 Year Year 55 Year Year
“It is clear that the handoff from 2015 to 2016 was a strong one. This is not surprising given that recent polling conducted for TREB by Ipsos suggested 12 per cent of GTA households were seriously considering the purchase of a home in 2016. Buying intentions are strong for this year as households continue to see home ownership as an affordable long-term investment,” said McLean.
$631,092
Mortgage January 2016 2016 Month RatesJanuary
TORONTO, February 3, 2016 – Toronto Real Estate Board President Mark McLean announced Greater Toronto Area REALTORS® reported 4,672 residential transactions through TREB’s MLS® System in January 2016. This result represented an 8.2 per cent increase compared to January 2015.
January 2016
January 2015
Year-Over-Year Summary Sales New Listings Active Listings Average Price Average DOM
1,7
2016
2015
% Chg.
4,672 8,957 9,966 $631,092 29
4,318 9,547 11,600 $552,925 31
8.2% -6.2% -14.1% 14.1% -6.5%