Historic Statistics TorontoMLS Sales and Average Price Year
Sales*
Average Sale Price*
Year
Sales*
Average Sale Price*
1970 1971 1972 1973 1974 1975 1976 1977 1978 1979 1980 1981 1982 1983 1984 1985 1986 1987 1988 1989 1990 1991 1992
10,498 13,085 14,613 16,335 17,318 22,020 19,025 20,512 21,184 23,466 26,017 29,625 25,336 30,046 31,905 45,509 52,919 43,475 49,381 38,960 26,779 38,144 41,703
$29,429 $30,426 $32,513 $40,605 $52,806 $57,581 $61,389 $64,559 $67,333 $70,830 $75,694 $90,203 $95,496 $101,626 $102,318 $109,094 $138,925 $189,105 $229,635 $273,698 $255,020 $234,313 $214,971
1993 1994 1995 1996 1997 1998 1999 2000 2001 2002 2003 2004 2005 2006 2007 2008 2009 2010 2011 2012 2013 2014 2015
38,990 44,237 39,273 55,779 58,014 55,344 58,957 58,343 67,612 74,759 78,898 83,501 84,145 83,084 93,193 74,552 87,308 85,545 89,096 85,496 87,049 92,782 101,299
$206,490 $208,921 $203,028 $198,150 $211,307 $216,815 $228,372 $243,255 $251,508 $275,231 $293,067 $315,231 $335,907 $351,941 $376,236 $379,347 $395,460 $431,276 $465,014 $497,130 $522,958 $566,624 $622,217
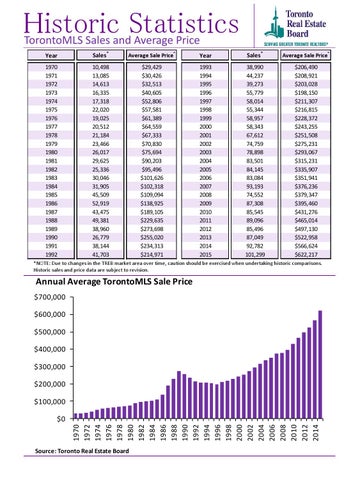
*NOTE: Due to changes in the TREB market area over time, caution should be exercised when undertaking historic comparisons. Historic sales and price data are subject to revision.
Annual Average TorontoMLS Sale Price $700,000 $600,000 $500,000
$400,000 $300,000 $200,000 $100,000
1970 1972 1974 1976 1978 1980 1982 1984 1986 1988 1990 1992 1994 1996 1998 2000 2002 2004 2006 2008 2010 2012 2014
$0
Source: Toronto Real Estate Board