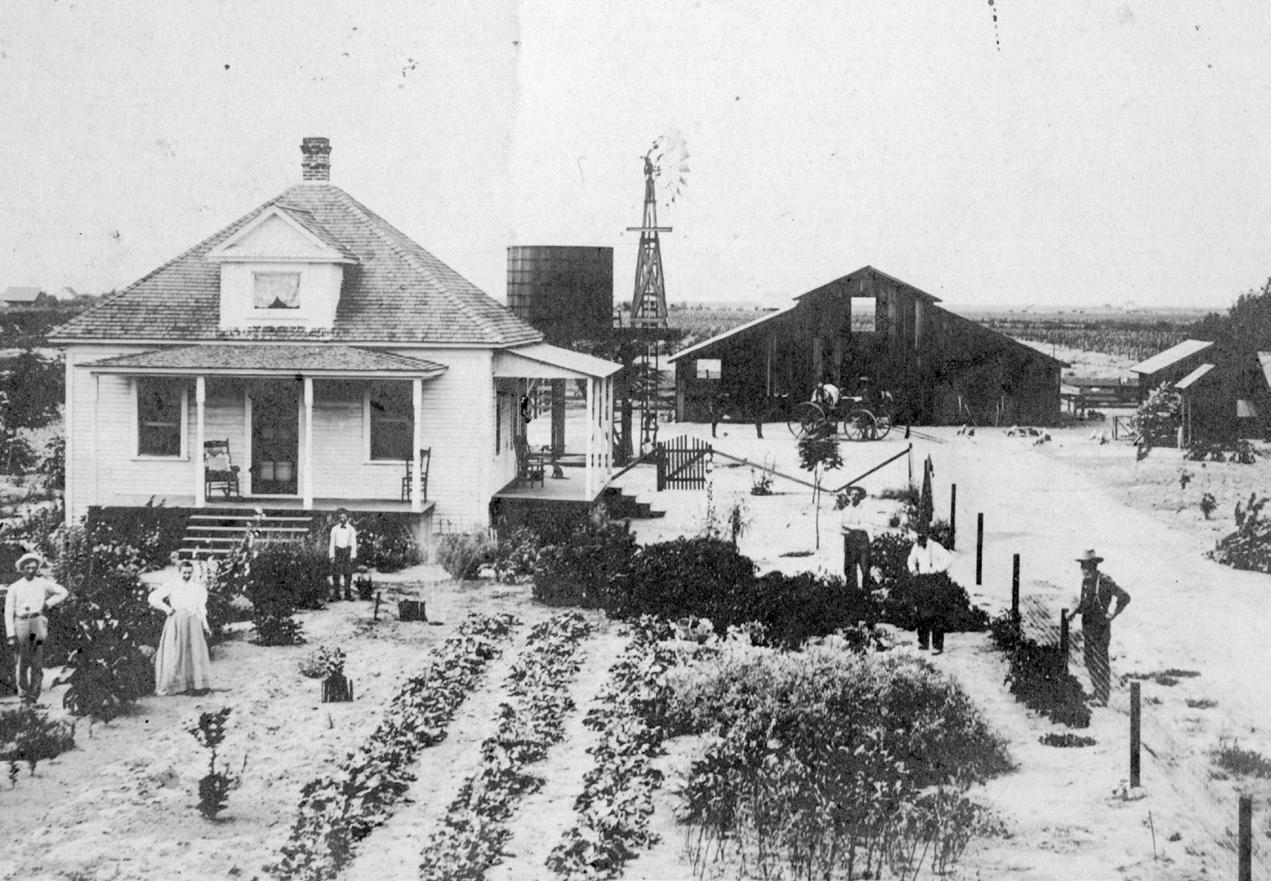


In our fast-paced world, it is rare that we give ourselves an opportunity to stop and reflect on the idea of what was “then” and how things are “now.” Most of the time we find ourselves needing to deal with the challenges of tomorrow. As I think about 2022, TID’s 135th anniversary as an irrigation district, I am reminded that the principles and priorities that our visionaries laid out for our customers then, still ring true now.
135 years ago, our community understood the need for reliable irrigation water in order for our communities to thrive. Now, our community of growers tend to the most vital farmland in the Nation. in 1923, TID entered the retail electric market and now serves electricity to customers within the 662-square miles service territory it is today. We have come a long way over the years. I’m pleased to take a moment now to reflect on a few highlights and the challenges our impressive team tackled throughout 2022.
This was a year worth pausing for, to recognize our ability to navigate through the third driest three-year period on record and surpassing our historic peak energy load without impacting service to our customers.
I commend the talent and dedication of our team and Board of Directors, who addressed the challenges and opportunities of 2022 with the same ambition of those who established the District in 1887.


 Michelle Reimers General Manager, Turlock Irrigation District
Michael Frantz President Division 1
Rob Santos Director Division 4
Ron Macedo Vice President Division 5
Charlie Fernandes Director Division 2
Joe Alamo Secretary Division 3
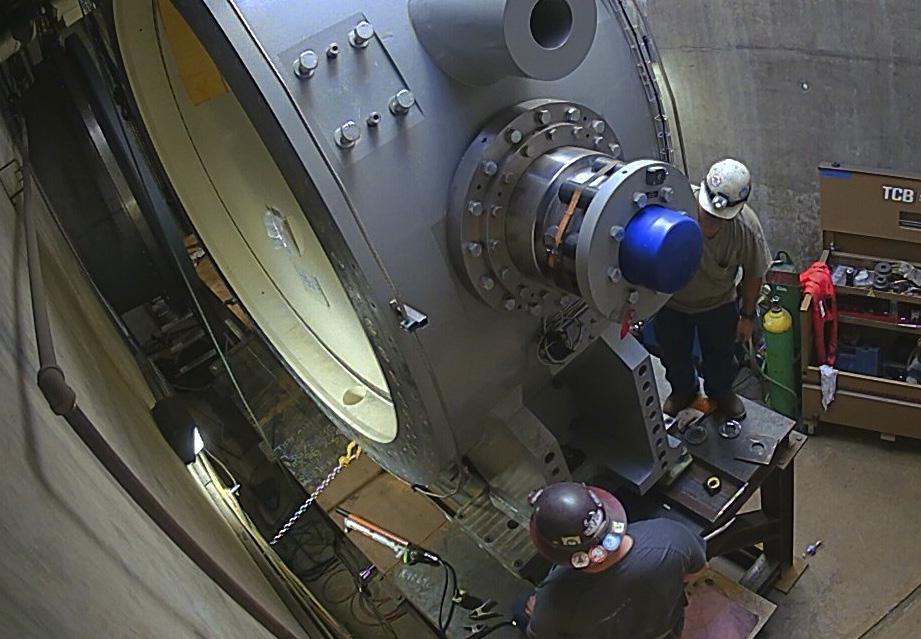
Updates and upgrades to the Don Pedro Project are designed to maintain the integrity of Don Pedro and achieve an additional 50-year life expectancy. In 2022, the upgrades included essential value replacements and a crane rail extension project.


TID, with MID, filed a water rights application with the State Water Resources Control Board to capture unappropriated flood waters from the Tuolumne River. An initial analysis indicates that since 1998 there have been thirteen years when water would be available, averaging approximately 840,000 AF annually in additional water captured in each of those thirteen years.


TID Introduced Project Nexus, a first in the nation project, to demonstrate the proof of concept of installing solar panels over both narrow and wide-span canals. The innovative project will investigate the scalability for both TID’s 250 miles of canals, as well as state-owned wide-span canals. In addition to the renewable energy generated by the panels, there is potential for reduction in both aquatic growth and evaporation in our canals. TID sees the potential value of the solar over canals project as an innovative solution to help maintain our 100-plus year-old irrigation system and meet our need for additional renewable power. To learn more, visit TID.org/ProjectNexus.


The Upper Dawson Hydroelectric Project is an example of TID’s innovation and resourcefulness in maintaining our infrastructure. The project helps provide irrigation reliability to the District’s Upper Main Canal system. The installed gates increase the flow capacity of the Dawson facility by 50% as compared to previous design capacities. The gates also reduce risk to the irrigation system that supplies water to 150,000 acres of some of the most valuable and productive farmland in the world.


During the September heat wave, TID Balancing Authority electric demand hit an all-time high of 735 megawatts (MW) . The previous all-time high was 692 MW in 2020. With the State potentially experiencing rolling blackouts, the experts at TID worked around the clock to coordinate resources to ensure reliable power for TID customers and provided resources to assist the state.


MY TID , an online portal for energy customers, was launched in April. The platform provides added value to customers through increased self-service capabilities, usage data, reporting and payment flexibility.
2022 TID RATE COMPARISON USING TID AVERAGE USAGE PER RATE CLASS


1,138 residential customers received rebates
42 non-residential customers received 3,547,484 kWh in rebate savings
972 fixtures replaced in Dusk to Dawn streetlights with LED’s, saving 626,394 kWh
301 Electric Vehicle rebates issued
4,630,428 total kilowatt hours saved

169 Electric Vehicle Charger rebates issued

TID offered customers an inside look at our history, operations, and future plans through the Customer Academy which launched in September. Participants, who applied to be part of the program, were presented with information from TID subject matter experts from across the District, giving TID an opportunity to strengthen the relationship between the District and the community through transparency and education.
TID invited customers, employees and their families to attend a Celebration of Water & Power recognizing Public Power Week, Water Professionals Appreciation Week, and Customer Service Week. Fifteen departments presented attendees with information on their role in supporting how TID provides the essential services of power and irrigation water to the communities we serve.
TID installed a 7.2 kW ChargePoint Level 2 charger at the Ceres Community Center. TID’s board approved the installation and operation of ten Level 2 EV chargers throughout our service territory. TID will study the use of the public chargers to better understand customer behavior for the creation of potential rebate programs. TID used Low Carbon Fuel Standards (LCFS) dollars to fund this project. The intent of LCFS is to promote transportation electrification.


The efforts of Team TID, the employee-founded, giveback organization, were recognized by two industry associations. Northwest Public Power Association (NWPPA) named Team TID as the recipient of the 2022 Paul J. Raver Community Service Award. Additionally, American Public Power Association (APPA) selected Team TID as the recipient of the 2022 Sue Kelly Community Service Award. Both awards recognized the exceptional commitment TID employees have to their communities.

0.6 miles of underground cable replaced 0.8 miles of conduit installed
4,214 customers enrolled in CARES Rate Assistance program 1,952 customers enrolled in Medical Rate Assistance program

TID quick facts
water year
Third driest 3-year period on record
27 inches available water per parcel
65.8% precipitation compared to average year
1,057,824 acre-feet of water in storage at Don Pedro storage at the end of the water year
power
9 days of above 100 degree temperatures
735 BA peak load
40 MW over previous record in 2020
$1,029,306.47 LIHEAP dollars received by eligible customers
875,258 total payments processed (all methods)
149,799 total number of calls answered
22 Water & Power Podcast episodes
4,299 downloads
1,960 Media mentions
1,813 new social media followers 681,000 impressions
Number of Employees:
458
Electric Service Customer Breakdown: Electrical Service Area:
72% Residential
Irrigation Service Area: Miles of Gravity-Fed Canals:
307 miles2 250 miles
20%
662 miles2 Includes agricultural and municipal water pumping and street lighting
Irrigation Accounts: Electric Population Served:
7% Commercial
1%
TID will provide reliable and competitively priced water and electric service, while being good stewards of our resources and providing a high level of customer satisfaction.
TID’s reputation will be as a trusted partner, innovative leader, and model of sustainability in enhancing the quality of life for our community, through embracing our core values at every level of our organization.
• Reliability. TID plans, builds and maintains its water and electric systems to reliably serve its customers.
• Affordability. TID provides stable, competitive rates for its customers.
• Stewardship. TID provides leadership by sustainably managing the resources entrusted to us.
• Safety. TID ensures a safe environment for employees and customers.
• Quality Workforce. TID attracts and retains highly-skilled and experienced team members.
Established in 1887, the Turlock Irrigation District (TID) was the first irrigation district in the state. Today it is one of only four irrigation districts in California that also provides electric retail energy directly to homes, farms and businesses. Organized under the Wright Act, the District operates under the provisions of the California Water Code as a special district. TID delivers irrigation water through 250 miles of a gravity-fed canal system that irrigates approximately 150,000 acres of farmland.
• Customer Focus. TID is committed to building strong and lasting relationships with our customers and community through engagement, transparency, accountability and trust.
• Local Control. Decisions made by local people to address local needs are essential to TID’s continued success.
• Visionary. TID proactively balances nearterm decision making with the long-term well-being of its customers.
In addition, TID owns and operates an integrated and diverse electric generation, transmission and distribution system that serves a population of approximately 240,000 within a 662 square-mile area. TID is one of eight Balancing Authorities in California and operates independently within the Western United States power grid. A Balancing Authority must ensure customers’ usage and resources are matched on a moment-bymoment basis. TID is governed by a fivemember, locally elected Board of Directors.
