‘Freakonomics’ podcast examines and discusses dayto-day economic issues see ARTS AND LIVING / PAGE 5
Men’s and women’s track and field teams shine at nationals
The singles are ready to mingle: the Daily reviews the big pop singles arriving this spring see ARTS AND LIVING / PAGE 5
SEE SPORTS / PAGE 10
THE
INDEPENDENT
STUDENT
N E W S PA P E R
OF
TUFTS
UNIVERSITY
E S T. 1 9 8 0
T HE T UFTS DAILY
VOLUME LXXI, NUMBER 36
tuftsdaily.com
Wednesday, March 16, 2016
MEDFORD/SOMERVILLE, MASS.
Students, Tufts launches new ‘Diversity Dashboard’ to faculty discuss improve demographic transparency new Science, Technology and Society program by Abigail Feldman News Editor
by Daniel Nelson
Contributing Writer
Students and faculty gathered in the Sophia Gordon Multipurpose Room last Thursday for a Student Summit on the new Science, Technology and Society (STS) program, which was introduced this semester to provide students with an interdisciplinary approach to study topics in science and technology as well as their effects on society. Last week’s summit provided a forum for interested students and alumni to discuss the new program, which offers both a co-major, to be declared along with the completion of another major, and a minor. The three main tracks of study of the STS program include Bodies, Health and Medicine, Science and the State as well as Mathematics and Modeling, according to the program’s website. Program Director Moon Duchin, an associate professor of mathematics, hosted the Student Summit. She said the event allowed students interested in STS to share their ideas for the development of the program. “We want to hear what students are interested in; we want to hear about how to build a community that works for [the students],” Duchin said at the event. “The forum is designed to figure out which courses will appeal to [students] and have [them] pitch ideas for that courses could fill.” Over time, Duchin hopes to build a community of students within the STS program. As the program is still in its inaugural semester, her primary concern is getting it off the ground. The Student Summit was a part of her campaign to increase awareness for the new major. At the forum, students shared their desires for the major’s future. Ideas ranged from broadening the program to include courses studying music theory and the physics of instruments to examining the use of mathematics of elections to introducing reading labs for reading-intensive courses. Spearheading the creation of the program, Duchin also assembled a comsee STS, page 2
Please recycle this newspaper
Partly Cloudy 56 / 43
/thetuftsdaily
The university launched a new Diversity and Inclusion site on Monday, alongside the new tufts.edu homepage. The site includes an expansive “Diversity Dashboard” geared toward making university demographics more accessible to the Tufts community members and prospective students. According to Jessica Sharkness, senior associate director of the Office of Institutional Research and Evaluation (OIRE) and co-chair of the Diversity and Inclusion Working Group (DIWG), the interactive dashboard uses graphics to display data on race/ethnicity and gender distribution of students at both the undergraduate and graduate levels, faculty and staff, broken down by school. It also provides information on students’ country/ state of origin and graduation rates within four, five and six years of undergraduate students who enrolled at Tufts in 2009. The dashboard currently displays data from the fall 2015 semester and will be updated annually with fall semester census information according to Sharkness, who focused on preparing data for the site and creating its visuals. She explained that all information on the site has been gathered from initial data collection surveys on Tufts’ admissions and job applications, as well as through the Student Information System (SIS) an d Oracle’s PeopleSoft human resource system used by faculty and staff. Currently enrolled students can change their racial/ethnic identification at any time on SIS, as can faculty and staff members through PeopleSoft. “This is not secret data,” Chief Diversity Officer and Associate Provost Mark Brimhall-Vargas said. “We’re trying to do it so you don’t have to do a lot of homework from year to year.” While schools receiving federal aid are mandated to report certain demographic information, according to OIRE’s website, relatively few universities release data in the visually-appealing way that the dashboard does, Sharkness said. “I’m proud of the way we have made it more accessible,” she told the Daily in an email. “I believe our decision to include a full tally of all of the race/ethnicities that individuals selected as well as our commitment to making this information easily understood make us relatively unique.” In addition to displaying demographic data as it is reported to the federal government through the Integrated Postsecondary Education Data System (IPEDS) — a series of
For breaking news, our content archive and exclusive content, visit tuftsdaily.com @tuftsdaily
tuftsdaily
tuftsdaily
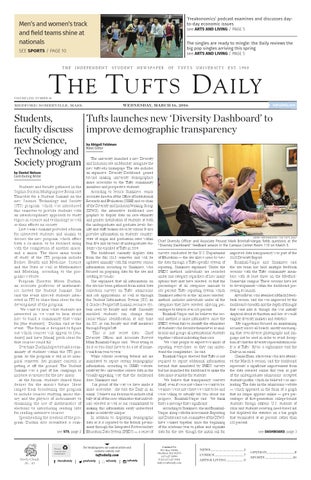
HENRY HINTERMEISTER / THE TUFTS DAILY
Chief Diversity Officer and Associate Provost Mark Brimhall-Vargas fields questions at the “Diversity Dashboard” feedback session in the Campus Center Room 113 on March 3. surveys conducted by the U.S. Department of Education — the site allows users to view the data through a Tufts-specific system of reporting, Sharkness explained. Under the IPEDS method, individuals are recorded under one category, regardless of how many options they may have selected, so that the percentages of all categories amount to 100 percent. Tufts’ reporting system, which Sharkness refers to as the “all races selected” method, includes individuals under all the categories they have selected, allowing percentages to total to over 100 percent. Brimhall-Vargas said he believes the second method is more informative, since the IPEDS system fails to identify the ethnicities of students who describe themselves as multiracial and groups all international students together without indicating their race. “We want people to expect two kinds of reporting everywhere, so they can understand the complexities,” he said. Brimhall-Vargas stressed that Tufts is not required to report additional information beyond that mandated by IPEDS surveys but has launched the dashboard to make the data more available for students. “We believe that transparency conveys [that]; even if we’re not where we want to be, we know we’re not where we want to be and we’re willing to actually tell you about our progress,” Brimhall-Vargas said. “We think that’s a message that’s significant.” According to Sharkness, she and BrimhallVargas, along with the Assessment, Reporting and Dashboard sub-committee of the DIWG, have worked together since the beginning of the academic year to gather and organize data for the site, though the initial call for
Contact Us P.O. Box 53018, Medford, MA 02155 617 627 3090 FAX 617 627 3910 daily@tuftsdaily.com
improved data transparency was part of the 2013 Diversity Report. Brimhall-Vargas and Sharkness said the site team has held multiple feedback sessions with the Tufts community members with at least three on the Medford/ Somerville campus. These sessions have led to developments within the dashboard preceding its launch. Alyssa Rivas, who attended a March 3 feedback session, said she was impressed by the dashboard’s breadth and the depth of thought that went into it, though she was initially skeptical about its function and how it would employ diversity markers and statistics. “My suggestions focused on maintaining accuracy across all boards, mostly encouraging that ‘over-diverse’ photographs and language not be used in order to avoid deception of what the diversity representation really is at Tufts,” Rivas, a sophomore, told the Daily in an email. Charlie Zhen, a first-year who also attended the March 3 session, said the dashboard represents a significant improvement from the data released earlier this year as part of the undergraduate admissions’ accepted students profile, which he believed was misleading. The data on the admissions website — which appeared in the form of a graph that no longer appears online — gave percentages of first-generation college-bound students, foreign citizens, U.S. students of color and students receiving need-based aid but displayed the statistics on a bar graph that terminated at 40 percent, rather than 100 percent.
NEWS............................................1 COMICS....................................... 7 ARTS & LIVING.......................5
see DASHBOARD, page 3
OPINION.....................................8 SPORTS.....................................10