


2024-2026
Northern Cochise Community Hospital
Benson Health

Benson Health (Benson) and Northern Cochise Community Hospital (NCCH), both located in Cochise County in the southeastern corner of Arizona, are pleased to present this jointly developed 2024-2026 Community Health Needs Assessment (CHNA). This CHNA details the socioeconomic characteristics of the communities we serve. It also provides key health indicators and trends on health status, health outcomes, and health disparities in these same communities. In addition to data, our CHNA process included soliciting insights and perceptions of other organizations, community members, and civic leaders serving our Cochise County communities.
The CHNA concludes by identifying the most pressing health needs in our respective service areas. As the final step in this process, and after reviewing the data and considering available resources, existing programs, and other needs, each hospital will individually select its top priorities and focus areas and then create and adopt a three-year Implementation Plan. The strategies included in the implementation plans will reflect each hospital’s commitment to promoting health and well-being in their communities.
In 2010, the Patient Protection and Affordable Care Act became law. With the passage of this legislation came the requirement that every not-for-profit hospital in the nation conduct a CHNA once every three years. Using the infrastructure created through the Healthy Cochise Initiative, in 2013, Benson and NCCH, along with other parties including Cochise Health and Social Services, Copper Queen Community Hospital, and the Legacy Foundation of Southeast Arizona, conducted a joint county-wide CHNA that included robust community and stakeholder engagement utilizing a modified Mobilizing Through Planning and Partnership (MTPP) framework. This process worked well and was used again in 2016-2017 for the CHNA that covered the years ending in 2020.
Because the process made possible by the Healthy Cochise Initiative infrastructure was not replicated, NCCH and Benson moved forward with a joint CHNA in 2020 for the 2021-2023 time period. This 2024-26 CHNA builds off these previous efforts, providing a current and comprehensive assessment of community health and healthcare needs.

Northern Cochise Community Hospital and Benson Health – Our Shared Mission, Vision, and Values

Our Mission: Our mission is to provide exceptional healthcare with compassion.
Our Vision: We aspire to serve our community by being the best health system, as measured by the quality of the care we deliver, the experiences we create, and the value we bring.
Our Values:
▪ Compassion
We have heart
We respect diversity and individuality
We honor body, mind, and spirit
▪ Dedication
We work hard for our patients and each other
We are committed to professionalism and excellence
We listen, we learn, we grow
▪ Community
We are welcoming and friendly
We practice kindness in all our relationships
We reach out as teachers and as leaders
▪ Integrity
We tell the truth
We are responsible in how we use our resources
We have the courage to uphold our values
NCCH, located in Willcox, also includes Sulphur Springs Medical Center (SSMC) and Sunsites Medical Clinic (SMC).
NCCH’s history is rich, having contributed significantly to the progress and direction of medicine in Arizona. Our predecessor, known as the Municipal Hospital, was the first hospital in Willcox. It was built in 1952 and had 12 beds. As Municipal Hospital became outdated and the Willcox community grew, it was increasingly difficult to provide needed care for patients NCCH opened in 1968 to provide updated and more modern hospital services and facilities to the community. The new hospital opened with 25 beds and was one of only 23 hospitals in the State of Arizona, not including hospitals owned by the mines. NCCH ultimately served as a model for the development of other community hospitals in Arizona.


What started out as a hospital of 38 employees has grown to include over 175 employees today. NCCH has the distinction of being the first hospital in the State to grant privileges to Doctors of Osteopathic Medicine (DO), creating a culture and environment whereby DOs and MDs work side-by-side in the hospital setting, to the direct benefit of patients served.
In 2021, NCCH joined TMC Health, a regional non-profit healthcare system serving communities across southern Arizona but retained its community board
TMC Health is the region’s fastest growing health system. It is the parent company to some of the region’s most trusted and respected healthcare facilities, including Tucson Medical Center. Today, TMC Health brings additional medical resources and technologies to the residents of southeastern Arizona, establishing relationships with both Benson and NCCH, as well as Rincon Health Campus and Tucson Medical Center - Rincon.
NCCH is a federally-designated critical access hospital (CAH), meaning that the federal government has designated it as an essential community provider and reimburses based on allowable costs NCCH operates a Level IV Trauma Emergency Department and offers a range of primary and preventive healthcare services such as senior services, a pharmacy, and rehabilitation services In addition to the hospital, NCCH operates two rural health clinics (RHCs) and several specialty clinics, including cardiology, nephrology, podiatry, and urology.
The original hospital in Benson was privately owned and located where the current public library resides In 1963, the San Pedro Valley Hospital District was formed, and in April of 1966, plans were initiated to build a new hospital at the present location. Private residents donated ten acres of land for the site, and in early July 1970, the Benson Hospital was opened to receive patients.
What started as a small community hospital designed to meet the basic needs of patients in southeastern Arizona has grown substantially. In 2018, Benson Health also joined the TMC Health system to improve the quality and coordination of care of the patients they serve.
With the influx of hundreds of winter visitors and many new permanent residents, the need for emergency, laboratory, radiology, and rehabilitation services have increased dramatically. Benson is a 22-bed CAH, serving the entirety of the San Pedro Valley Hospital District, the surrounding communities of southeast Arizona, and the influx of winter visitors each year to the community. Along with inpatient and skilled nursing care, the hospital operates several outpatient services, including infusion therapy, wound care treatment, mammography, and rehabilitation. Benson also provides Level IV Trauma emergency services staffed with physicians 24/7. Benson is one of only 13 Level IV Traumadesignated emergency departments in the state
In 2017, Benson invested in primary care to expand access to the community. Today, Benson operates two RHCs, one in Benson and one in Vail, and also operates specialty clinics and a retail care clinic embedded in a local supermarket.


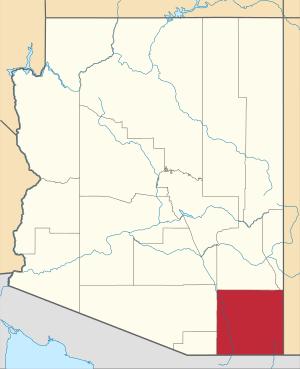
Founded in 1881, 31 years before Arizona achieved Statehood, Cochise County has a rich and diverse history. Located in the southeast corner of Arizona (see Exhibit 1) and covering nearly four million acres, it is larger than the states of Connecticut and Rhode Island combined. The county’s namesake, the legendary Apache Chief Cochise, waged battle with U.S. Cavalry units in the Dragoon mountains, while his fellow Apache fighter, Geronimo, was pursued deep into the Chiricahua Mountains.
Today, people of diverse cultures and with varying social, economic, and health needs call Cochise County home. The communities comprising the county include Tombstone; the copper town turned artistic community of Bisbee; Sierra Vista; Fort Huachuca; the vineyards and farms of Willcox; the natural beauty of the San Pedro Valley; and the crossborder bustle of Douglas.
Cochise County’s 2023 population is approximately 126,000. This represents a marginal growth from the 2020 census, but a decline of nearly 4% overall between 2010 and 2023. The Arizona Office of Economic Opportunity projects Cochise County will grow by 2% by 2030. Collectively, the service areas of NCCH and Benson cover about 80% of the land area of Cochise County. The populations of the two combined service areas represent about 53% of the county’s population. Each hospital’s service area, shown in Exhibit 2, was determined based on actual patient origin data.
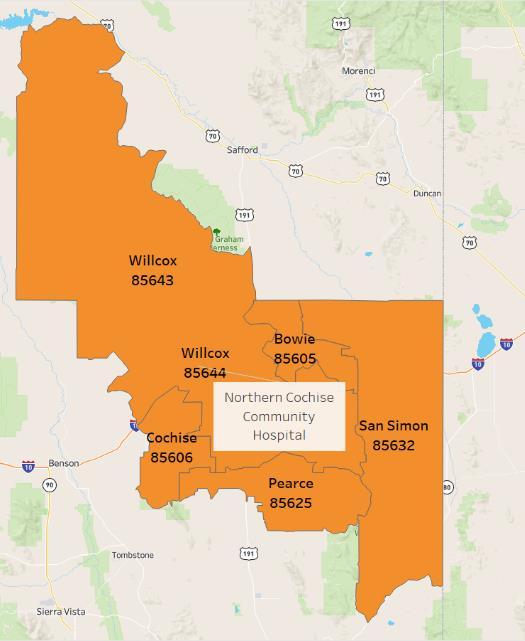
NCCH Service Area includes six zip codes. These zip codes, one of which is a PO Box, represent the area from which 85% of NCCH’s patients reside, and include:
85643 Willcox 85625 Pearce 85644 Willcox 85606 Cochise 85605 Bowie 85632 San Simon
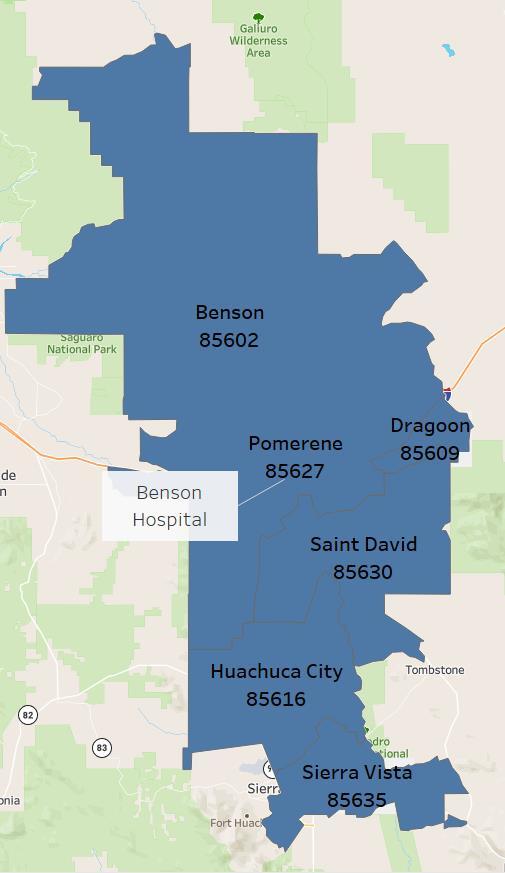
The Benson Service Area also includes six zip codes, one of which is a PO Box. Roughly 83% of Benson’s patients reside in these six zip codes:
85602 Benson 85630 Saint David 85616 Huachuca City 85635 Sierra Vista 85627 Pomerene 85609 Dragoon
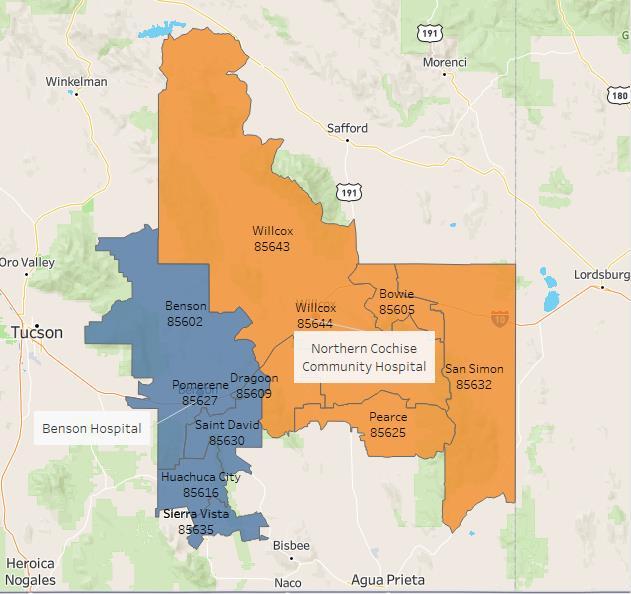
Exhibit 3 maps the NCCH Service Area As shown in Exhibit 4, the population of the Northern Cochise Service Area is estimated at 12,318. The service area’s population declined by about 15% between 2010 and 2023 and is expected to decline another 3.2% by 2028. Of interest is the fact that the 0-64 population declined by 25% between 2010 and 2023, while the 65+ population grew by nearly 25% over the same time frame. The same is expected between 2023 and 2028, with the under 64 demographic declining by another 6.8% as the 65+ demographic is expected to grow 5.8%. Today, nearly one-third (29%) of the population is over the age of 65, and by 2028, this percentage is projected to grow to 31%.
American Indians represent about 1.5% of the total population in the service area, while Hispanics represent about 40%. The Hispanic population is expected to grow an additional 2.8% by 2028, while the American Indian population is expected to decline by 11.6%.
Source: Nielsen Claritas
Exhibit 5 shows the Benson Service Area. As shown in Exhibit 6, the 2023 population of the Benson Service Area is estimated at 54,218. The service area’s population declined by nearly 2.6% between 2010 and 2023 and is expected to grow a modest 0.6% between 2023 and 2028. As with the NCCH Service Area, the 064 population declined by 11.4% between 2010 and 2023, while the 65+ demographic grew by 35.5% over the same period. By 2028, the 0-64 population is expected to decline another 2%, while the 65+ is expected to grow by about 8%. Today, 25.8% of the population is over the age of 65.
American Indians represent 1.1% of the total population of the service area, while Hispanics represent 23%. The Hispanic population is expected to grow by about 8% by 2025, and the American Indian population is expected to decline 7.4%.
Source: Nielsen Claritas

The service areas of the two hospitals comprise about 80% of the land area of Cochise County, and about 53%of the population.
▪ The NCCH Service Area’s population declined by about 15% between 2010 and 2023. Continued decline is projected; all of the decline is in the 0- 64 cohort. Today, nearly one-third (29%) of the population is over the age of 65, and by 2028, this percentage will grow to 31%.
▪ The population of the Benson Service Area also declined, but by only 2.6% between 2010 and 2023. It is projected to grow by less than 1% over the next five years. As with the NCCH Service Area, the population age 0-64 declined, and that decline is expected to continue. Today, 25.8% of the population is over the age of 65. Data from the CDC’s National Ambulatory Care Survey demonstrates that persons age 65+ use healthcare at three to four times the rate of those under 65.
▪ About 40% of the NCCH community and about 23% of the Benson community is Hispanic.
▪ The continued aging of the population and the loss of work-age residents will have significant impacts on healthcare needs and the ability of staff to meet the demands of an aging community.
Through the 2021-2023 CHNA process, both NCCH and Benson created individual, communityspecific CHNA priorities and developed strategies for implementing those priorities. Accomplishments related to those 2021-23 CHNA individual priorities and strategies for each hospital are outlined in Exhibit 7
Exhibit 7:
Northern Cochise Community Hospital Priorities and Accomplishments, 2021-23
Priority: Mental Health and Substance Abuse – Accomplishments
▪ Implemented depression screenings as part of primary care services.
▪ Partnered with Concert Health for the provisions of mental health services at SSMC.
▪ Connected with Arizona HOSA, a career and technical student organization dedicated to helping students enter the healthcare field, to begin a collaborative effort with the schools to introduce health-related careers to students.
▪ Continued the feasibility analysis of implementing swing beds in the community to provide a local long-term care option.
▪ Collaborated with Tucson Medical Center to virtually host senior health education programs
▪ Collaborated with community organizations to re-initiate services at the Senior Center post-COVID.
▪ Developed and opened an outpatient Geriatric-Psychiatry Program.
Priority: Primary Care
▪ Implemented robust recruitment programs with the goal of adding additional days of operation to the clinics. While still in the recruitment process, NCCH was able to expand clinic days of operation to three days per week during the snowbird season.
▪ Continued recruitment efforts focused on adding an additional Nurse Practitioner to SSMC.
▪ Continued Medical Director recruitment efforts made to help support services at each of the clinics.
▪ Evaluated the feasibility of providing fluoride treatments to Medicaid children within the clinics.
▪ Collaborating with Chiricahua FQHC’s planned dental expansion to Willcox.
▪ Hired an additional 40 employees in the past five years and reinvested nearly $6 million into hospital infrastructure.
▪ Partnered with The Center for the Future of Arizona, Ft. Huachuca, and The Benson Unified School District on career based educational training and paid internships.
▪ Collaborated with the City of Benson and Elected Officials on community residential and industry expansion plans and added hospital representation to several community boards.
▪ Added a Community Connected Health Manager and New Rural Health Navigators to work with providers and the Chronic Care Management Program to screen patients for Social Determinants of Health issues and connect patients to community resources.
▪ Collaborated with community partners on events to generate revenue and improve tourism.
▪ Provided opioid educational materials and built a student led approach to reducing addictions through the Benson Unified School District through collaboration with the University of Arizona Center for Rural Health and the Center for Future Arizona
▪ Provided mental health training to hospital and community partner staff in partnership with NAMI and conducted community presentations on the importance of mental health care.
▪ Collaborated with Counseling in the Streets program, a peer-to-peer mental health support system.
▪ Ongoing participation in the Arizona Complete Health behavioral health programs including working on the Cochise County Crisis panel and the Cochise Addiction and Recovery Program
▪ Helped establish the Sunshine House in Benson where families can access licensed counselling services.
▪ Actively collaborated with and provided ongoing healthy eating and community education resources and support to multiple community partners.
▪ In partnership with community partners, offered ongoing food drives, health education, cooking classes, and free diabetes testing, and provided healthy food and resources to those in need.
▪ Provided food boxes to elderly patients at hospital discharge and through the outpatient clinics and are working to formalize this process into the State’s Closed Loop Referral Program.
▪ Partnered with the Benson Unified School District to stock its internal food pantries and provide backpacks of food for food insecure students when on break from school.
1 See Appendix 1 for more details on Benson Health’s 2021-2023 accomplishments.
This joint CHNA includes data collected from federal, state, and, where available, regional-level sources to better understand the demographics, health behaviors, social and economic factors, physical environment, and clinical care characteristics of the two hospital service areas and Cochise County as a whole.
When possible, data was analyzed at the individual hospital service area level, and if not, data from the Arizona Department of Health Sciences Service’s Primary Care Statistical Areas (PCSA) was used as a very close proxy (the Sierra Vista and Benson PCSAs closely resemble the Benson Service Area, and the Willcox and Bowie PCSA align with the NCCH Service Area). Where service area or PCSA data were not available, findings are reported at the county level.
In addition, NCCH and Benson jointly developed a community survey and then each distributed the survey in their respective service areas, with particular focus on prioritization and recommended strategies for meeting those needs.
To guide the process for this CHNA, NCCH and Benson used the Robert Wood Johnson Foundation’s (RWJF) model of community health (see Exhibit 8). This model emphasizes the many factors that influence how long and how well a community lives. It uses more than thirty measures that help communities understand how healthy their residents are today (health outcomes) and the factors that will impact their health in the future (health factors). The same process was used in the 2021-2023 CHNA.
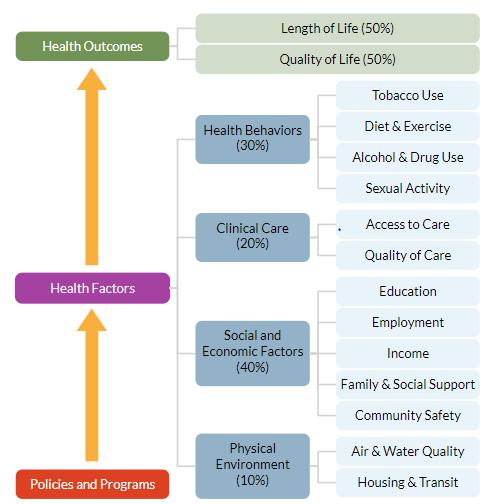
One real value of the RWJF model is that it demonstrates the role of factors beyond clinical care that affect the health of a community and its residents. As identified in Exhibit 8, clinical care represents only 20% of the factors influencing health outcomes, while social and economic factors and health behaviors account for 40% and 30%, respectively
The Robert Wood Johnson Foundation publishes an annual report of health data for every county in the United States called County Health Rankings. Data from this County Health Rankings report was used throughout this CHNA.
The data in Exhibit 9 identifies Cochise County’s progress on the RWJF metrics when ranked in comparison to the other 14 counties in Arizona. Between 2020 and 2023, the County maintained its overall position for Health Outcomes compared to all counties (8th out of 15), with its composite scores for Length and Quality of Life both improving since the 2020 CHNA
The County also maintained its overall position for Health Factors compared to all counties (6th out of 15). Since 2020, Cochise County saw a decline in its composite score for Social and Economic Factors and a rise in the composite score for Physical Environment. The composite scores for Health Behaviors and Clinical Care held steady over the same period.
Using the RWJF process, we were able to undertake the critical work to evaluate and then understand how to influence each of these modifiable health factors. This process will be fully reflected in each hospital’s Implementation Plan.
Source: 2023 RWJ County Health Rankings


In the United States, the leading causes of death and disease are attributed to unhealthy behaviors. For example, poor nutrition and low levels of physical activity are associated with higher risk of cardiovascular disease, type 2 diabetes, and obesity. Tobacco use is associated with heart disease, cancer, and poor pregnancy outcomes if the mother smokes during pregnancy. Excessive alcohol use is associated with injuries, certain types of cancers, and cirrhosis.
Health behaviors are actions individuals take that affect their health. They include actions that lead to improved health, such as eating well and being physically active, and actions that increase risk of disease, such as smoking, excessive alcohol intake, and risky sexual behavior. Health behaviors are modifiable.
Addressing health behaviors requires strategies to encourage individuals to engage in healthy behaviors, as well as ensuring that they have access to nutritious food, safe spaces to be physically active, and supports to make healthy choices.

Health Behaviors – Key Take-Aways:
▪ The overall burden of chronic disease is greater in the County than the State, with higher rates of cardiovascular disease, cancer, and chronic lower respiratory diseases.
▪ Cochise County is less physically active and has less access to exercise opportunities than the State as a whole.
▪ Cochise County has almost twice the level of food insecurity as the State.
▪ Student binge drinking in the County is higher than the State, but student vaping and cigarette usage is down across all grades since 2018.
▪ Cochise County has a slightly higher percentage of residents reporting they have poor or fair health than the State average, and both the County and State’s rates are more than 25% higher than top US performers.
▪ In terms of poor physical health days (the average number of physically unhealthy days reported in the past 30 days), County residents report on average 16% more poor physical health days than the State and 20% higher than top performers in the nation.
The most common behavioral contributors to chronic disease, morbidity, or mortality include diet and activity patterns, and the use of alcohol, drugs, and tobacco. Importantly, the social and economic costs related to these behaviors, and the burden of these diseases on the health of an individual, family, and community, can all be greatly reduced by changes in behaviors.
According to the Centers for Disease Control (CDC), chronic diseases are among the most common, costly, and preventable of all health problems.
As can be seen in Exhibit 10, the self-reported rates of being obese or having diabetes in Cochise County are in line with the state and the top U.S. performing counties. People who have been told that they are obese, compared to those with a normal or healthy weight, are at increased risk for many serious diseases and health conditions, including high blood pressure, diabetes, heart disease, and stroke.
The overall burden of chronic disease is greater in Cochise County than in the State of Arizona as a whole. As identified in Exhibit 11, this burden is expressed in the fact that the county has higher age-adjusted death rates than the state for most top causes of death related to chronic diseases, including cardiovascular disease, cancer, and chronic lower respiratory diseases.
Exhibit 11: Age-Adjusted Mortality Rates (per 100,000) for Selected Leading Causes of Death, Cochise County and Statewide, 2020
Source: Arizona Department of Health Sciences 2020
Diet and activity patterns are closely correlated with chronic disease. As shown in Exhibit 12, the percent of the county population that is physically inactive (24%) is higher than the state (22%) and the top U.S. county performers (20%). Importantly, the percentage of adults who live reasonably close to exercise opportunities in the county is nearly 20% lower than the percent statewide.
Alcohol-impaired driving deaths significantly contribute to unintentional injury rates One-third of all traffic-related deaths involve alcohol, and drunk driving is the number one cause of death among teenagers. The potential for death is much higher for drunk driving incidents compared to other types of alcohol-related injury. Cochise County has a higher percentage of alcohol impaired driving deaths (26%) than the state (22%).
Evidence suggests teen pregnancy significantly increases the risk of repeat pregnancy and of contracting a sexually transmitted infection (STI), both of which can result in adverse health outcomes for mothers, children, families, and communities. The number of teen births in Cochise County exceeds that of the state or top U.S. performing counties (30 per 1,000 females ages 15-19, compared to 20 and 19, respectively)
Adult physical inactivity (% of adults ages 20+ reporting no leisure-time physical activity in the past month)
Access to exercise opportunities (% of adults who live reasonably close to exercise activities)
Alcohol-impaired driving deaths (% of motor vehicle crash deaths with alcohol involvement)
Teen births (# of births per 1,000 female population ages 15-19)
Source: 2023 RWJ County Health Rankings
Years of potential life lost (YPLL) is a widely used measure of the rate and distribution of premature mortality. Measuring premature mortality, rather than overall mortality, focuses on deaths that could have been prevented. Exhibit 13 identifies that adults in Cochise County, while on par with the rest of Arizona, have a slightly higher rate of premature death than the nation. Despite this, county life expectancy is on par with both the state and nation.
Premature death (# of deaths under age 75 per 100,000 population)
or fair health
Poor physical health days in last 30 days
Source: 2023 RWJ County Health Rankings
Poor or Fair Health measures the percentage of adults in a county who self-report that they consider themselves to be in poor or fair health. While Cochise County has a slightly higher percentage of residents reporting they have poor or fair than the state, it is important to note that Cochise County and Arizona percentages are 25-33% higher (worse) than the top U.S. performers on this indicator. Poor Physical Health Days measures the average number of physically unhealthy days reported in the past 30 days. In terms of this measure, Cochise County is reporting, on average, 16% more poor physical health days than the state, and 20% more than top performers in the nation.
The lack of consistent access to nutritious, balanced, and sufficient amounts of food is called “food insecurity” and is related to negative health outcomes such as weight gain and premature mortality. In addition to assessing the consistency of food availability in the past year, the food insecurity measure also evaluates the access of individuals and families to balanced meals. The Food Environment Index (FEI) ranges from a scale of 0 (worst) to 10 (best) and equally weighs indicators of food insecurity and limited access to healthy foods.
As shown in Exhibit 14, Cochise County’s Food Environment Index is slightly better than the state overall. However, food insecurity rates, defined as the percentage of the population who did not have access to a reliable source of food during the past year, are 18% higher than the state, while limited access to healthy foods is 78% higher. Limited access to healthy foods is defined as the percentage of the population who are low-income and do not live close to a grocery store.
Source: 2023 RWJ County Health Rankings
Behavioral health is an umbrella term that includes mental health and substance use, life stressors and crises, and stress-related physical symptoms. Behavioral health issues can negatively impact physical health, leading to an increased risk of some conditions. Unmet needs related to behavioral health services were identified as a priority in the 2017 and 2020 county-wide CHNAs. As seen in Exhibit 15, Cochise County adults report a worsening trend related to poor mental health days when compared to the state and the top U.S. performing counties, with county adults reporting, on average, 4.6 poor mental health days in the last 30 days, up from 3.7 in 2017 and 4.3 in 2020.
Source: 2023 RWJ County Health Rankings
Exhibit 16: Number of Opioid Overdose Deaths, Arizona, 2017-2021
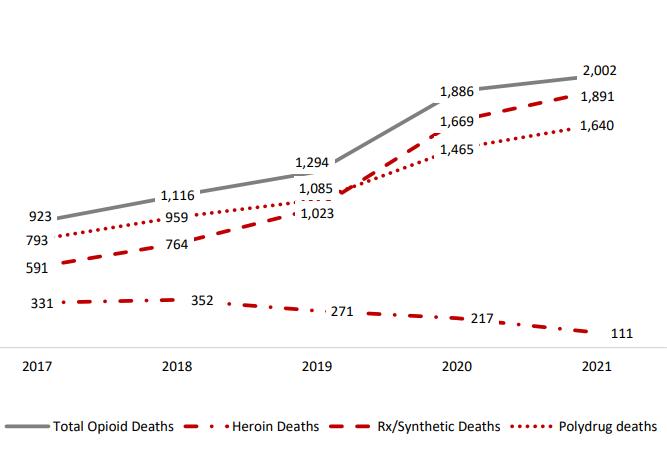
Source: 2021, Arizona Department of Health Services (Arizona Vital Statistics)
Opioids are a class of drug that include the illegal drug heroin, synthetic opioids such as fentanyl, and pain relievers available legally by prescription, such as oxycodone (OxyContin®) or hydrocodone (Vicodin®). When used as directed under a healthcare provider's supervision, prescription pain medicines are helpful. However, misusing prescription opioids risks dependence and addiction.
As reported in the 2020 CHNA, Arizona’s rates of opioid-attributed deaths rose steadily between 2012 (454 deaths) and 2018 (1,116 deaths). As Exhibit 16 illustrates, the state’s rate of opioid deaths has continued to rise between 2019 (1,294 deaths) and 2021 (2,002 deaths).
Exhibit 17 shows the 2022 rate of opioid-attributed deaths in the County was 22.9 per 100,000, up from 11.5 per 100,000 in 2018, a nearly 100% increase. Despite the large jump, the rate is still lower than the state’s 26.3 per 100,000 (a 68% increase since 2018). The overall drug overdose death rate saw an increase of 5% in Cochise County, compared to a 27% increase statewide.
Adult smoking is a critical component of the burden of chronic disease and should be a key focus of prevention. Cigarette smoking harms nearly every organ of the body and causes many diseases. Smokers are more likely than nonsmokers to develop heart disease, stroke, and several forms of cancer. As Exhibit 18 shows, smoking is more prevalent in the Benson Service Area (24%) than in the county (22%), the state (22%) or the NCCH Service Area (17%).
Binge drinking, defined as males having five or more drinks on one occasion and females having four or more drinks on one occasion, is the most common, costly, and deadly pattern of excessive alcohol use in the United States. Binge drinking is a risk factor for several adverse health outcomes such as alcohol poisoning, hypertension, acute myocardial infarction, sexually transmitted infections, unintended pregnancy, fetal alcohol syndrome, sudden infant death syndrome, suicide, interpersonal violence, and motor vehicle crashes.
Binge drinking is less prevalent in the county (18%) than the state (23%). However, Exhibit 18 indicates that the Benson Service Area is seeing binge drinking rates up to 33% higher than Northern Cochise (15%) and 11% higher than the county (18%).
Cigarette smoking during adolescence causes significant health problems, including an increase in the number and severity of respiratory illnesses, decreased physical fitness, and potential effects on lung growth and function. In a positive trend, Cochise County youth smoking and vaping data has declined since 2020. Exhibits 19 and 20 show student vaping and cigarette usage are down across all grades since 2018.
Exhibits 19: Cochise County Student Electronic Cigarette (Vaping) Usage, 2016-2022
Exhibit 20: Cochise County Student Cigarette Usage, 2014-2022
Source: 2022 Arizona Youth Survey
Source: 2022 Arizona Youth Survey
Binge drinking is the most common pattern of alcohol consumption among high school youth who drink alcohol and is strongly associated with a wide range of other health risk behaviors. As seen in Exhibits 21 and 22, student binge drinking rates, defined as having had five or more drinks in a row at least once during the previous two weeks, have decreased since 2018, decreasing by 34% for all reported grades combined, and, importantly, by 100% for students in grade 10 (from 18% to 9%).
In Cochise County, students continue to outpace the state in terms of binge drinking for grades 8, 10, and 12. Binge drinking for all grades combined in Cochise County (8.2%) is more than 50% higher than the state (5.3%).
Exhibit 21: Student Binge Drinking, 2022
Exhibit 22: Student Binge Drinking, 2018
Grade 8 Grade 10 Grade 12 Total
Cochise County State
Source: 2022 Arizona Youth Survey
Access to affordable, quality, and timely healthcare can prevent disease by detecting and addressing health concerns early. Understanding clinical care in a community helps in understanding how the community can improve the health of its neighbors.
Advances in clinical care over the last century, including breakthroughs in vaccinations, surgical procedures such as transplants and chemotherapy, and preventive screenings have led to significant increases in life expectancy. Clinical care and practice continue to evolve, with advances in telehealth and care coordination leading to improved quality and availability of care.
Those without regular access to quality providers and care are often diagnosed at later, less treatable stages
Grade 8 Grade 10 Grade 12 Total
Cochise County State
Source: 2018 Arizona Youth Survey
Clinical care includes what people view as medicine: primary care providers, vaccines, screenings, etc. Access means making sure all people can get these services in convenient, timely, and affordable ways. There are many barriers to accessing health services, from financial to geographic limitations. Provider ratios per 1,000 residents and rates of insured are also important factors.
of a disease than those with insurance, and, overall, have worse health outcomes, lower quality of life, and higher mortality rates.

Clinical Care – Key Findings:
▪ Approximately 26% of residents in the Benson Service Area and 24% in the NCCH Service Area are without a usual source of healthcare.
▪ Almost 60% of Benson Service Area and 55% of Northern Cochise Service Area residents have not seen a dentist in the last year.
▪ The Service Areas and Cochise County as a whole are designated as health professional shortage and medically underserved areas and have higher (worse) resident-to-provider ratios than the State.
▪ A smaller percentage of Medicare recipients in Cochise County receive flu vaccines and mammography screenings than in the State and further disparities exist when data is considered by race.
▪ Willcox and Bowie PCSA (Northern Cochise Service Area) have a higher percentage of mothers receiving late or no prenatal care than the Sierra Vista and Benson PCSAs (Benson Service Area) and the county and state.
Exhibit 23: Access to Care Meaures
Adults with No Dental Visit in Past Year
Adults Who Have Delayed/ Not Sought Care Due to Cost
Adults with No Usual Source of Care
Source: UDS Mapper 2023
Having a usual source of care defined as a personal doctor or other healthcare provider like a health clinic where someone would usually go if they were sick—is seen as a strong indicator of healthcare access. Exhibit 23 shows approximately one-fourth of residents in the NCCH and Benson Service Areas reported having no usual source of care. This compares to nearly one-third in Cochise County and the state.
This is concerning, as patients with a usual source of care are more likely to receive recommended preventive services such as flu shots, blood pressure screenings, and cancer screenings. For patients without a usual source of care, disparities in access to primary healthcare exist, and patients face barriers that increase the risk of poor health outcomes.
The high cost of healthcare can also be a barrier to access for both insured people (particularly those with high deductibles) and the uninsured, and costs can be particularly burdensome for people in worse health. As seen in Exhibit 23, 13% of Northern Cochise and 12% of Benson Service Area residents report not seeking or delaying care due to cost, which is better than both the county (18%) and state (19%).
Source: 2023 Arizona Department of Health Services Primary Care Area Statistical Profiles
Importantly, the percentage of adults with no dental visit in the last year was higher in both Northern Cochise and Benson Service Areas than in the county or state.
Low birthweight is a valuable public health indicator of maternal health, nutrition, healthcare access, and poverty. Factors such as early intervention services, education, employment and economic opportunities, social supports, and availability of resources to meet daily needs influence maternal health behaviors, pregnancy outcomes, and infant and child health. As Exhibit 24 indicates, when comparing low birthweight by Arizona’s primary care areas, the Sierra Vista and Benson PCSAs (the Benson Service Area), have a low birthweight measure ranging from 64.1 per 1,000 live births in Benson to a high of 83.2 per 1,000 in Sierra Vista (which is significantly higher than the county and state). The Willcox and Bowie PCSA (the Northern Cochise Service Area) has 79.7 per 1,000 low birthrate measure, which is also higher than the county or state. Late prenatal care (defined as starting in the third trimester of pregnancy) and no prenatal care are both indicators of a lack of access to care and lead to increased
Exhibit 25: No Prenatal Care & Prenatal Care Starting in Trimester 3
No Prenatal Care
Trimester 3
Source: 2023 Arizona Department of Health Services Primary Care Area Statistical Profiles
maternal/infant health risks, e.g., lower birthweights and infant and maternal morbidity and mortality. As Exhibit 25 suggests, the Willcox and Bowie PCSA (Northern Cochise Service Area) have a higher percentage of mothers receiving late or no prenatal care than the Sierra Vista and Benson PCSAs (Benson Service Area) and the county and state.
Key markers of access to healthcare in a community are rates of preventive screenings and vaccines. Getting vaccinated prevents many life-threatening illnesses from occurring, and preventive screenings catch disease processes early so treatments are more effective. Yearly influenza outbreaks can prove deadly to seniors, children, pregnant women, those with asthma, and people who are immunocompromised. Vaccines prevent people from getting the flu and help lessen the intensity of the illness if they do contract the virus. Mammograms and other routine preventive screenings can help catch disease in its early stages, when it is easier to treat.
As Exhibit 26 shows, the rate of mammography screenings for Medicare recipients in Cochise County (30%) is lower than the state and the nation. Significantly fewer Cochise residents receive flu vaccines compared to the state (34% versus 48%). This is important as even Arizona’s rates for these preventive care measures are significantly lower than the U.S. top performers.
Additional disparities in these rates arise when reviewed by race. Per Exhibit 27 below, among Medicare recipients in Cochise County, only 21% of the American Indian/Alaska Native population and 23% of the Hispanic population received recommended mammography screenings, compared to 30% of the White population. Black and Hispanic rates of flu vaccination (29% and 28%, respectively) are lower when compared to White residents (35%).
Source: 2023 County Health Rankings
Preventable hospital stays are hospitalizations for ambulatory care-sensitive conditions. These are conditions that, if diagnosed and treated in outpatient settings, could have prevented a hospitalization. Preventable hospital stays can be classified as both a quality and access measure, as some literature describes hospitalization rates for ambulatory care-sensitive conditions primarily as a proxy for access to primary healthcare. This measure may also represent a tendency to overuse hospitals as a main source of care.
As shown in Exhibit 28, the Willcox and Bowie PCSA (Northern Cochise Service Area) is doing worse than the county and state in terms of preventable hospital stays, with a rate of 59.8 per 1000 compared to 52.7 for the county and 34.5 for the state. The PCSAs within the Benson Service Area were also worse than the county and state, with a rate of 58.6 per 1000.
The Federal Health Resources and Service Administration (HRSA) deems geographies and populations as Medically Underserved Areas (MUAs), Medically Underserved Populations (MUPs), and/or Health Professional Shortage Areas (HPSAs). MUAs and MUPs are managed by the Division of Policy and Shortage Designation (DPSD), which is part of the Bureau of Health Workforce (BHW). HPSA designations identify areas or populations as having a shortage of primary care, dental, or mental health care providers. There are several types of HPSAs depending on whether shortages are widespread or limited to specific groups of people or facilities. These include a geographic HPSA wherein the entire population in a certain area has difficulty accessing healthcare providers and the available resources are considered overused, or a population HPSA wherein some groups of people in a certain area have difficulty accessing healthcare providers (e.g., low-income, migrant farmworkers, Native Americans).
Once designated, per Exhibit 29 below, HRSA scores HPSAs on a scale of 0-25, with higher scores indicating greater need. HPSA designations are available for three different areas of healthcare: primary medical care, primary dental care, and mental health care.
Three scoring criteria are common across all disciplines of HPSA:
▪ The population-to-provider ratio,
▪ The percentage of the population below 100% of the Federal Poverty Level (FPL), and
▪ The travel time to the nearest source of care (NSC) outside the HPSA designation.
The following figure provides a broad overview of the four components used in Primary Care HPSA scoring:
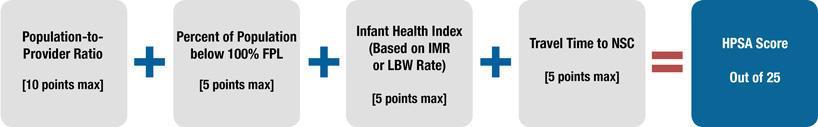
Source: Health Resources and Services Administration (HRSA)
These designations are important as more than 30 federal programs depend on the shortage designation to determine eligibility or funding preference to increase the number of physicians and other health professionals who practice in those designated areas. Exhibit 30 reflects Cochise County’s HPSA designations and scoring for the areas within the Northern Cochise and Benson Service Areas
Source: HRSA Data Warehouse – HPSA Find
Per Exhibit 31, the MUA/P score is dependent on the Index of Medical Underservice (IMU) calculated for the area or population proposed for designation. Under the established criteria, an area or population with an IMU of 62.0 or below qualifies for designation as an MUA/P.
MUA/P Indicators
• Provider per 1,000 population ratio
• % population at 100% of the Federal Poverty Level (FPL)
• % population age 65 and over
• Infant mortality rate Exhibit 31: MUA/P Scoring Criteria
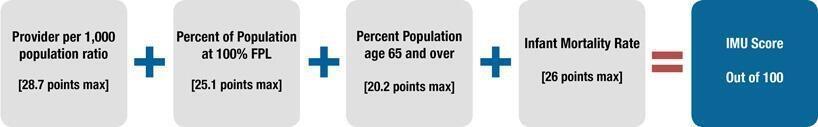
Source: Health Resources and Services Administration (HRSA)
As seen in Exhibit 32, both the Northern Cochise (Bowie/Willcox) Service Area and the Benson (Sierra Vista/Benson) Service Area are designated as Medically Underserved Areas by HRSA.
Source: Health Resources and Services Administration (HRSA)
Exhibit 33: Resident to Provider Ratio (# or Residents to 1 Provider)
Primary Care Physicians
Further, Cochise County has worse ratios for primary care providers, dentists, and mental health providers than the rest of the state, as can be seen in Exhibit 33; and Arizona generally does not fare well against the rest of the nation. Arizona ranks 38th in the nation in the number of primary care providers per 100,000 population, 28th in number of dentists, and 47th for mental health according to the 2019 Arizona State Health Assessment by the Arizona Department of Health Sciences.
Our basic social and economic supports good schools, stable jobs, and strong social networks are foundational to achieving long and healthy lives. For example, family-wage employment provides income that shapes opportunities around housing, education, childcare, food, medical care, and more. In contrast, unemployment limits these choices and the ability to accumulate savings and assets that can help cushion households in times of economic distress.
Social and economic factors are not commonly considered when it comes to health, yet strategies to improve these factors can have an even greater impact on health than many strategies traditionally associated with health improvement.
Key Findings:
Social and economic factors such as income, education, employment, community safety, and social supports significantly affect how well and how long we live. These factors affect our ability to make healthy choices and to afford medical care and housing.

▪ While the Northern Cochise Service Area has fewer people living in poverty (under 100% of the FPL), it has more people (32%) struggling to make ends meet (under 200% of the FPL) than the Benson Service Area (28%), County (28%), or State (25%)
▪ The Northern Cochise Service Area has a significantly higher percentage of uninsured individuals (12.3%) than the Benson Service Area (7.3%), Cochise County, and State.
▪ The percentage of children in single-parent homes in the County has decreased 10% since 2020
▪ 42% of Arizonans and 35% of Arizona youth experienced two or more Adverse Childhood Experiences (ACEs)
As identified in Exhibit 34, Cochise County is comparable with the State of Arizona in terms of income inequality (measured as the ratio of household income at the 80th percentile to income at the 20th percentile). Children in single-parent households are at higher risk for social isolation, have an increased risk for illness and mental health problems, and are more likely to engage in unhealthy behaviors than their counterparts. Importantly, the percentage of children in single-parent homes in the county has decreased 10% since 2020 and is now close to state and national rates. The county fares relatively well on violent crime rates (the number of reported violent crime offenses per 100,000 population).
Poverty is defined by family size and income and is the primary measure of financial stability. While it is often described in terms of the percent of families at or below 100% of the Federal Poverty Level (FPL), many families living above the poverty line still cannot make ends meet. To address this, Exhibit 35 shows the percentage of families at or under 100% and also those at or under 200% (as a measure of those families still struggling economically). While the Northern Cochise Service Area has fewer families and children living at or below the FPL than the Benson Service Area or Cochise County, it has a higher percentage of families struggling to make ends meet (32%) as compared to Benson and the county (28%) or the state (25%).
Source: 2023 RWJ County Health Rankings
As shown in Exhibit 36, unemployment rates in both Northern Cochise (6.7%) and Benson Service Areas (6.0%) decreased slightly since 2020 and are currently both below the county level (7.1%) but higher than the state (5.6%).
Families under 100% of FPL
Families under 200% of FPL
in Poverty
Northern Cochise’s median household income ($44,929) lags behind Benson and the county (around $55,000) and the state (nearly $66,000). There are discrepancies at the service area-level related to health insurance coverage, with the Northern Cochise Service Area having a much higher percentage of the population with no health insurance than the Benson Service Area or the county.
Northern Cochise Service Area
Service Area
Exhibit
Source: 2017-2021 American Community Survey
As seen in Exhibit 37, the Northern Cochise Service Area has a higher percentage of individuals who have not graduated high school by the age of 25. Higher levels of education can lead to a greater sense of control over one’s life, which is linked to better health, healthier lifestyle decisions, and fewer chronic conditions.
Exhibit 37: Educational Attainment by 25 – Less Than High School
Source: 2017-2021 American Community Survey
Adverse childhood experiences, or ACEs, are traumatic events that occur in childhood and cause stress that changes a child’s brain development. Exhibit 38 illustrates that exposure to ACEs has been shown to have adverse health and social outcomes in adulthood. ACEs include emotional, physical, or sexual abuse; emotional or physical neglect; seeing intimate partner violence; having mental illness or substance abuse in a household; enduring a parental separation or divorce; and having an incarcerated member of the household.
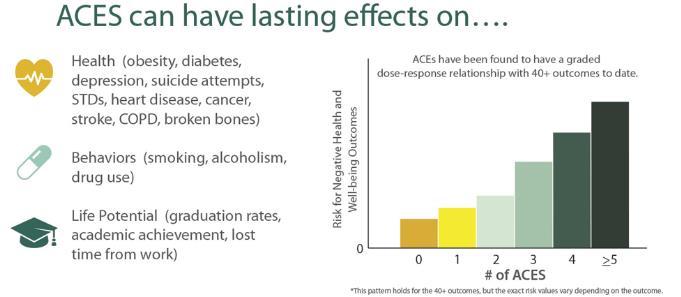
The relationship of ACEs to adult physical and mental health outcomes in Arizona was explored using aggregated BRFSS data, 2014-2020, by the Arizona Department of Health Services. As shown in Exhibit 39, data shows that ACEs are common in Arizona and frequently occur together. In fact, more than half (64%) of Arizona adults have experienced at least one ACE, while 42% have experienced two or more (39% in Cochise County).
Exhibit 39: Association between ACEs and Negative Health Outcomes
Source: Arizona Department of Health Services, 2023
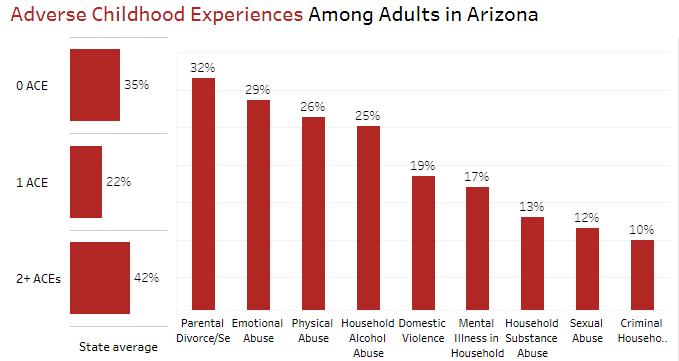
The number of ACEs is impacted by socio-economic factors including income level, family structure, ethnicity, insurance status, and the educational attainment of adults in the household. Exhibit 40 illustrates the relationship that exists between ACEs and gender, race/ethnicity, and household education.
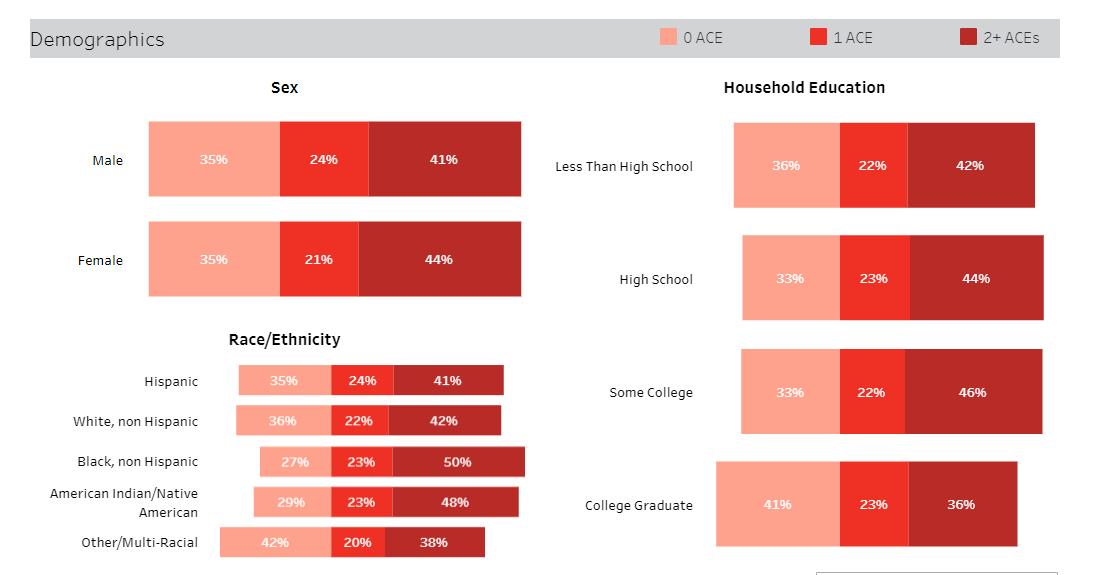
The fact that significantly more Arizonans report multiple ACEs than those who report just one has potential implications because the higher the ACE score, the greater the risk for numerous health and social problems throughout a person’s lifetime. For example, Arizonans with more ACEs were more likely to rate their health as fair or poor; to report smoking; to report having been diagnosed with gastrointestinal or autoimmune disorders; to have been diagnosed with depression, anxiety, bipolar disorder, or other mental disorder; and to have serious employment problems.
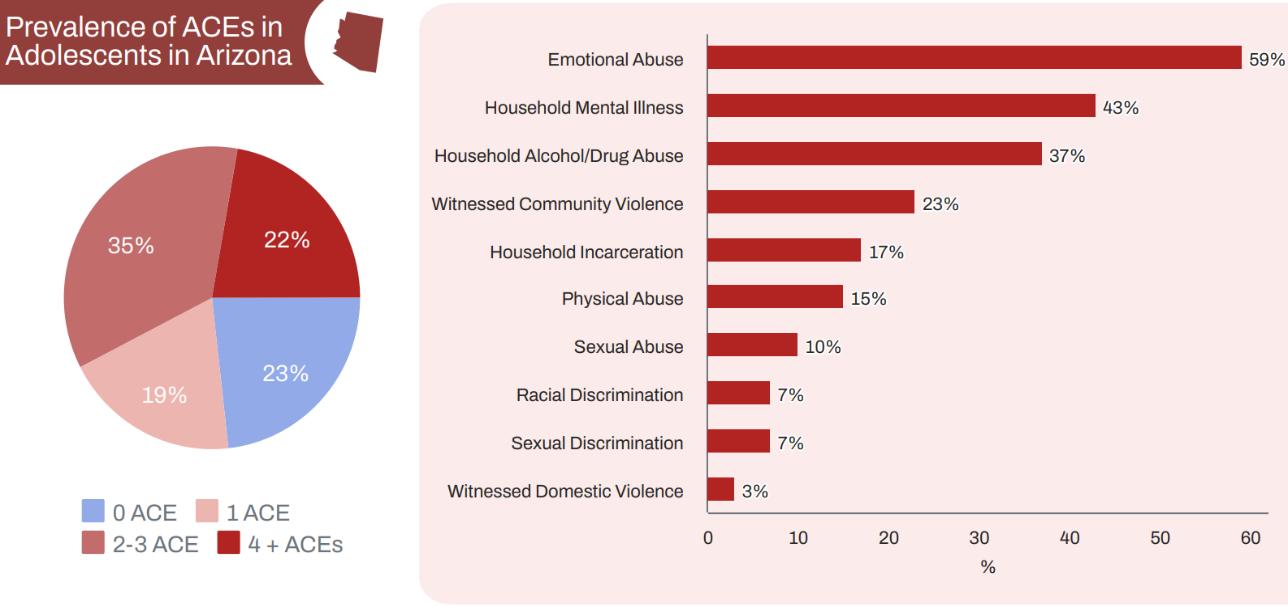
According to the Arizona Youth Risk Behavior Survey (see Exhibit 41), ACEs are common in Arizona’s children as well. Around one in five children ages 0 to 17 experienced one adverse family experience and over one-third (35%) have experienced two or more. Arizona is worse than the nation against all nine ACE measures.
Exhibit 41: Findings from the 2021 Arizona Youth Risk Behavior Survey
Source: Arizona Department of Health Services, 2023
Risk and Protective Factors
Risk and protective factors (RPF) are personal and environmental factors that influence a person’s likelihood of engaging in problem behaviors. Risk factors increase the chances of participation in problem behaviors, while protective factors decrease this likelihood. The RPF scales included in the Arizona Youth Risk Behavior Survey are grouped into four domains: peer/individual, family, school, and community. Exhibit 42 combines risk factors to determine the percentage of children exhibiting high risk factors. This data identifies that when evaluating combined grades (8, 10, and 12) data, Cochise County is in line with the state. However, 13% more 8th graders in Cochise County have high risk factors compared to their peers statewide, while fewer 12th graders in Cochise County have high risk factors compared to their peers across the state. As Exhibit 43 identifies, Cochise County has more students in all grades with high protective factors.
Source:2022ArizonaYouthSurvey
Clean air and safe water are necessary for good health. Air pollution is associated with increased asthma rates and lung diseases, and an increase in the risk of premature death from heart or lung disease. Water contaminated with chemicals, pesticides, or other contaminants can lead to illness, infection, and increased risks of cancer.
The physical environment is where individuals live, learn, work, and play. People interact with their physical environment through the air they breathe, water they drink, houses they live in, and the transportation they access to travel to work and school. Poor physical environments affect our ability and that of our families and neighbors to live long and healthy lives
Stable, affordable housing can provide a safe environment for families to live, learn, grow, and form social bonds. Housing is often the single largest expense for a family, and when a large proportion of a paycheck goes to paying the rent or mortgage, the high housing cost burden can force people to choose among paying for other essentials such as utilities, food, transportation, or medical care.
Our collective health and well-being depend on opportunity for everyone, yet across and within communities there are stark differences in the opportunities to live in safe, affordable homes, especially for people with low incomes.

Key Findings:
▪ Nearly 40% of renters in both Hospitals’ Service Areas are considered housing “cost burdened” and are spending more than 30% of their household income on housing.
▪ The number of “cost-burdened” homeowners in the NCCH Service Area (nearly one-third) is higher than the Benson Service Area, County or State.
▪ Homelessness in Arizona has increased by nearly 25% since 2020, and unsheltered homelessness has increased by 62% since 2012.
▪ Cochise County is one of 12 of the State’s 15 counties that received at least one drinking water violation in 2021.
▪
RWJF defines a “cost burdened” household as a household that spends 30% or more of their household income on housing and a “severely cost burdened” household as a household that spends more than 50% of their household income on housing.
While Exhibit 42 identifies that the County’s cost-burdened and severely cost burdened household rates for renters are lower (better) or in-line with the State, the reality is that many renters in both service areas are at risk, with nearly 40% facing housing cost burdens. In the NCCH Service Area, nearly a third of homeowners are also cost burdened (more than the Benson Service Area, the County and the State).
Cost Burden (Renters)
Severe Housing Cost Burdened (Renters)
Source: ACS 2017-2021
Households experiencing these cost burdens face difficult trade-offs in meeting other basic needs. When most of a paycheck goes toward the rent or mortgage, it makes it hard to afford health insurance, healthcare and medication, healthy foods, utility bills, or reliable transportation to work or school. This, in turn, can lead to increased stress levels and emotional strain and increases the risk of homelessness. Being homeless puts an individual at increased risk of multiple health issues including psychiatric illness, substance use, chronic disease, musculoskeletal disorders, skin and foot problems, poor oral health, and infectious diseases such as tuberculosis, hepatitis C and HIV infection.
According to the 2022 State of Homelessness Annual Report by the Arizona Department of Economic Security, the percentage of people experiencing homelessness in Arizona has increased nearly 25% since 2020 and has been on a steady rise in Arizona since 2017. Unsheltered homelessness has increased by 62% since 2012. Housing insecurity and homelessness are exacerbated by the lack of affordable housing in the State.
RWJ’s County Health Rankings measures air pollution by the particulate matter in the air. It reports the average daily density of fine particulate matter in micrograms per cubic meter. Fine particulate matter is defined as particles of air pollutants with an aerodynamic diameter less than 2.5 micrometers (PM2.5). As seen in Exhibit 43, Cochise County and the State fared better than the Nation on this measure of air quality.
Ensuring the safety of drinking water is important to prevent illness, birth defects, and death. One method for measuring the safety of water in a community is to evaluate drinking water violations (defined as at least one community water system in the area receiving at least one health-based violation in the last year). Cochise County is one of 12 of the State’s 15 counties that received at least one drinking water violation in 2021.
To assure community voice in the CHNA process, NCCH and Benson actively solicited input from their respective communities, targeting individuals and state and regional community partners that also serve the same communities. An online survey was distributed between August and October 2023. A total of 135 surveys were completed.
The survey was designed to solicit feedback on perceived improvements in each hospital’s 2021-2023 priorities. It also specifically solicited community input on other health needs and gaps in the community, specific healthcare disparities and access. Despite targeted efforts, the Hospitals are aware the survey under-represents the Hispanic community. To adjust for this, where there are differences in the responses, we report Hispanic responses separately,
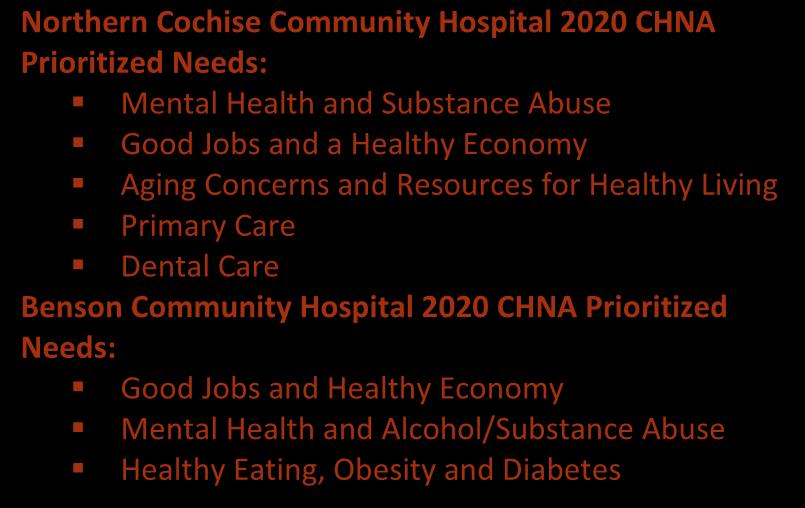
Northern Cochise Community Hospital 2020 CHNA Prioritized Needs:
▪ Mental Health and Substance Abuse
▪ Good Jobs and a Healthy Economy
▪ Aging Concerns and Resources for Healthy Living
▪ Primary Care
▪ Dental Care
Benson Community Hospital 2020 CHNA Prioritized Needs:
▪ Good Jobs and Healthy Economy
▪ Mental Health and Alcohol/Substance Abuse
▪ Healthy Eating, Obesity and Diabetes
The survey sought to understand respondent experience and/or perception about change in the community related to each of the 2021-2023 priorities. The specific question read: Please identify if you have seen or experienced any positive change in the community related to the priorities that are identified in the CHNA. Mixed responses were received regarding whether improvement on the priorities exists, but the percentage of respondents indicating they felt they did not have enough information to weigh in on whether improvement had been made is lower than in prior years, suggesting some success in each Hospital’s outreach efforts to do more to inform the community generally, and its health and social service partners specifically, about the CHNA’s strategies and programs.

As shown in Exhibit 45, responses from those living in and/or serving the NCCH service area reported the most progress on Good Jobs and Health Economy and Aging Concerns & Resources for Healthy Living, where more than 45% of respondents indicated moderate to much progress. Conversely, Dental Care was flagged by 66% of respondents as having little or no progress.
Exhibit 45: NCCH Community Survey Responses, Change on Priorities
or No
Much Progress Do not know/prefer not to answer
Similarly, and as identified in Exhibit 46 those living in and/or serving the Benson service area also reported moderate to much progress on Good Jobs & Healthy Economy. 51% also reported moderate to much progress on Healthy Eating, Obesity and Diabetes. The majority saw little to no improvement in Mental Health and Substance Use Priorities.
Exhibit 46: Benson Community Survey Response, Change in Priorities Little or No
Good Jobs & Healthy Economy
Progress
Progress Do not know/prefer not to answer
In each Service Area, differences were noted between those indicating that they were Hispanic, especially related to Good Jobs and a Healthy Economy, with 63% of Hispanic respondents seeing no to little improvement on this priority compared to about 38% of NCCH and Benson respondents overall. While the Hispanic “n” is low, it does suggest that inequities in family wage jobs and overall economic position.
Respondents were also asked if think that any of the priorities identified in the current CHNA should continue to be a priority in the coming year?
Exhibit 47: Should the Priority Continue to be a Focus?
Healthy Eating, Obesity and Diabetes
Primary Care Dental Care
Aging Concerns & Resources for Healthy Living
Good Jobs & Healthy Economy
Mental Health and Substance Abuse
As identified in Exhibit 47 an overwhelming majority of respondents from both Service Areas concluded that the priorities identified by each hospital should continue to be priorities in the upcoming years, with mental health and substance abuse rising to the top in both Service Areas. The high rate of support for continuing the 2021-2023 priorities was evident in the Hispanic responses as well.
Respondents were additionally provided a list of common health problems and were asked What do you think the three greatest "health problems" in the community are? Exhibit 48 demonstrates that the top health problems identified varied between Service Area respondents and the Hispanic population. For the NCCH Service Area, and likely attribute to the high percentage of elderly and Hispanic, Chronic Health Conditions were seen as the top problem (72%), followed by Mental Health Conditions (57%). While the Benson Service Area ranked the same two problems as top, Mental Health Conditions (60%) was ranked as the number one problem (Chronic Health Conditions (53%). Hispanic respondents identified Health Inequalities (56%) and Opioids and Other Drug Use (56%) as the top two health problems.
Respondents were additionally provided with a list of factors that could improve the health and quality of life of in the community and were asked to prioritize the most important factors.
Exhibit 48: What do you think the three greatest "health problems" in the community are today?
Respondents were additionally provided with a list of factors that could improve the health and quality of life of in the community and were asked to prioritize the most important factors. Exhibit 49 provides the responses and shows that the ability to recruit and retain a quality healthcare workforce was identified as the most important factor in the NCCH Service Area (57% of respondents) and second most important in the Benson Service Area (47% of respondents). The top factor in the Benson community was better access to behavioral health In both service areas, services to support seniors aging in place was also top. Hispanic residents ranked better access to behavioral health services as the most important factor (50%), with the ability to recruit and retain a quality healthcare workforce and affordable housing tying for second (44%).
Exhibit 49: What are the most important factors that will improve the health and quality of life in the community?
The survey asked, open-ended, if respondents were aware of any populations in the community that were less healthy or experiencing greater inequities. While only 20 respondents (15%) included a response, the responses are consistent with the data throughout this CHNA and with earlier survey responses, and include: seniors, low income, behavioral health (mental health and substance use), Hispanic, youth and dental care.
Substance Use Disorder in adults and youth flags as a key issue in the survey. As already discussed in this section, it is both a defined need and strongly supported as a continuing priority in the community.
While more than 50% of NCCH respondents, almost 80% of Benson respondents, and over 90% of Hispanic respondents indicated substance use has increased among adults and youth, Exhibit 51, shows that very few respondents felt that more SUD services are available in the community. Nearly 60% of the Hispanic population thought there have been less services available over the last few years.
Exhibit 51. In the last few years, in terms of substance use disorder services in the community, do you think there are:
Together, the data and community convening process fully suggests that the priorities established for the 2021-2023 CHNA should, with refinement and additional focus, continue. The combined 2021-2023 priorities include: mental health and substance abuse/misuse, supporting good jobs and a healthy economy, aging concerns and resources for healthy living, primary care, dental care, and healthy eating, obesity and diabetes
The updated data and community input included in this CHNA shows an increasing reality and recognition that:
▪ The demographics of the two service areas, and specifically the loss of the work age population (those under 65) in the NCCH Service Area and the limited growth in that population in the Benson Service Area (Benson) will challenge the ability to staff the health care services needed to support the community into the future. Mitigating this requires community wide efforts and partnerships to attract younger families to the region by advancing economic development, family wage jobs and overall livability
▪ Specific strategies and partnerships to support healthy aging, including management of chronic care conditions, behavioral health supports and access to care should be prioritized, especially in the NCCH Service Area.
▪ Both Service Areas, but particularly Benson need to continue to support prevention, treatment and recovery services for substance use and grow and embed mental health services for all segments of the community
▪ Improving access to dental care should be prioritized, particularly for the NCCH Service Area.
▪ Finally, specific strategies around recognizing and addressing inequities, starting with DEI efforts within the organizations that acknowledge the history and needs of the diverse and aging communities.
Based on the above, the preliminary 2024-2026 priorities include:
▪ Support, advocate, and lead efforts to realize a healthy, diverse, inclusive, and welcoming community that offers all residents access to quality health care and that attracts families and workforce because of its affordability and livability.
▪ Provide services and support for healthy aging in place for our rapidly growing senior residents.
▪ Partner, advocate, educate and directly provide services to address the community’s growing behavioral health needs.
▪ Improve access to primary care and dental services
Consistent with 26 CFR § 1.501(r)-3, NCCH and Benson will both independently adopt an Implementation Strategy on or before the 15th day of the fifth month after the end the taxable year in which the CHNA is adopted, or by May 15, 2024. Prior to this date, the Implementation Plan will be presented to each hospital’s board for review and consideration. Once approved, the Implementation Plans will be appended to this CHNA and widely disseminated. It will serve as guidance for the next three years in prioritizing and decision-making regarding resources and will guide the development of a plan for each hospital that operationalizes their individual initiatives.