47 minute read
Cool-Season & Warm-Season Grasses Overview


COOL-SEASON AND WARM-SEASON
GRASSES OVERVIEW
By Kevin Morris
2021 is the twenty-second year that Kevin Morris has provided Turf News with an update on the data collected on commercial varieties and experimental turfgrasses entered in the National Turfgrass Evaluation Program (NTEP). This information helps turfgrass producers choose the varieties that will best perform in their specific growing area and under their management programs. TPI and Turf News wish to thank Mr. Morris for the significant amount of time and effort he puts into providing this valuable overview. At any one time, the National Turfgrass Evaluation Program (NTEP) is evaluating over 600 cultivars and experimental selections in nationwide tests. Data collected and summarized from these trials can be obtained directly from the NTEP website (www.ntep.org). We still have, however, printed copies of reports available on request.
NTEP Data Presentation
NTEP information includes data collected on many descriptive and performance characteristics. Descriptive characteristics describe the entries tested, i.e. genetic color, leaf texture, and density characterize a grass’ appearance. Performance characteristics document the response to various stresses, such as disease, cold, and drought. For instance, the percent ground cover rating, although not necessarily affected by a single stress, reflects the grass’ ability to withstand and/or recover from a stress or a series of stresses. The most widely used data in NTEP reports are the turfgrass quality (TQ) ratings. Quality ratings are collected monthly during the growing season using a 1-9 scale with 9=ideal turf. Turfgrass quality ratings are collected by evaluators considering all the factors that make good turf, i.e., good green color, density, adequate ground cover, freedom from disease, and other stresses, etc. Quality ratings show a lot about the grasses, that is why they are so important. NTEP turfgrass quality tables focus on grouping by region or management level. In addition, we have the data from each state available on our website. Hopefully,
this makes the data more useful to growers within their geographical region or under their specific management level. NTEP recommends that growers first review data collected in their state or region, also under the management regime most suited to their needs. To find data for a specific state, go to www.ntep.org/states/states.htm.
NTEP Implemented Improved Data Reporting Procedure
NTEP is committed to improving its data collection, analysis, and reporting. To that end, NTEP spent ten years researching new statistical methods and is now implementing a new reporting procedure, the ‘Location Performance Index’ or ‘LPI,’ on its newest trials. The LPI is based on ‘AMMI,’ a more complete, accurate statistical analysis program for predicting cultivar performance across many locations. The LPI is only used on turfgrass quality data, but in reading the turfgrass quality tables, you will notice that locations may not be grouped by any apparent geographical orientation. For instance, in the 2012 data from our 2011 Kentucky bluegrass trial, ‘LPI Group 1' included Amherst, MA, West Lafayette, IN, Urbana, IL, St. Paul, MN, Manhattan, KS, and Pullman, WA. It seems that these locations have nothing in common, geographically, or climatically. However, what they do have in common is a very important similar ‘interaction pattern,’ i.e., the varieties performed in a similar manner, relative to each other, at each of these locations in that year. For that reason and most appropriately, the LPI groups them together for analysis. And that ‘interaction pattern’ can, and very often will, vary from year to year. Therefore, investigate the LPI Group data containing locations that are closest to you, or your market. The LPI is used on new trials as they are initiated. Go to the website, www.ntep.org, to read more about the LPI and the reasons for utilizing this new procedure.
Focus On Specific Traits
NTEP is designing its trial programs such that more data on specific traits are collected. For instance, standard trial locations, conducted at university sites using prescribed management schemes, collect traditional data, such as turfgrass quality, color, density, any diseases present, etc. NTEP also sponsors ancillary trial locations that collect data on specific traits, such as shade tolerance, traffic tolerance and sod strength. These ancillary trials must often be conducted in unique locations (i.e., under shade trees) or using specialized equipment (i.e., a traffic simulator). Because ancillary trials are applying unique stress to the entries, the data from these locations are often summarized and reported in separate tables. NTEP plans on conducting more of these ancillary trials in the future and is in fact, co-sponsoring with USGA, an entire trial just to evaluate cool-season and warm-season grasses for drought resistance and water use. The cool-season water use trial was established in fall 2016, with ten locations conducting drought evaluations through 2019 or 2020. The warm-season version of this trial was established in summer 2018, so the first data from warmseason grasses is included in this report. In addition, NTEP sponsored a low input trial for cool-season grasses and mixtures in fall 2015, while also establishing a warm-season low input trial in summer 2018. It is our hope that this type of data will provide much needed information to consumers on these important traits.
Update On Cultivars
Covid-19 presented some challenges for NTEP data collection in 2020. Several universities limited employees in how often they visited research facilities and in staff available to maintain trials. This situation tended to loosen over the growing season, with data collection at many sites only restricted early, and possibly into midgrowing season. Therefore, we were fortunate to receive most required data from NTEP trial sites. The following is an overview of the latest information on commercially available and experimental cultivars.
Kentucky Bluegrass
Our latest trial of Kentucky bluegrass was established in 2017; this report focuses on its third annual report (2020 data). Typically, first year data strongly reflects rate of establishment, as well as the performance without significant thatch development. Second-year data is the first indication of longer-term performance. Year three data, particularly from Kentucky bluegrass, often contains responses to stresses such as disease, shade, drought. In this summary, we look at locations in the different regions and identify top performers.
COOL-SEASON
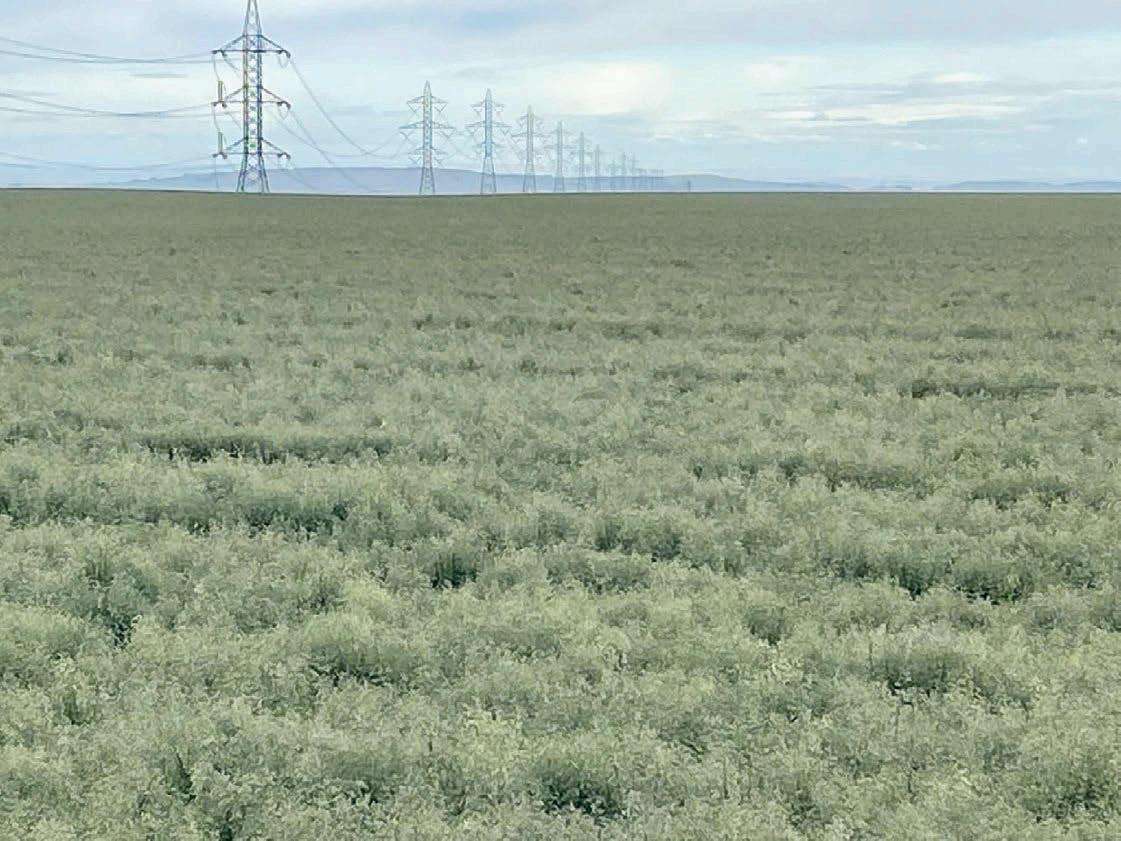
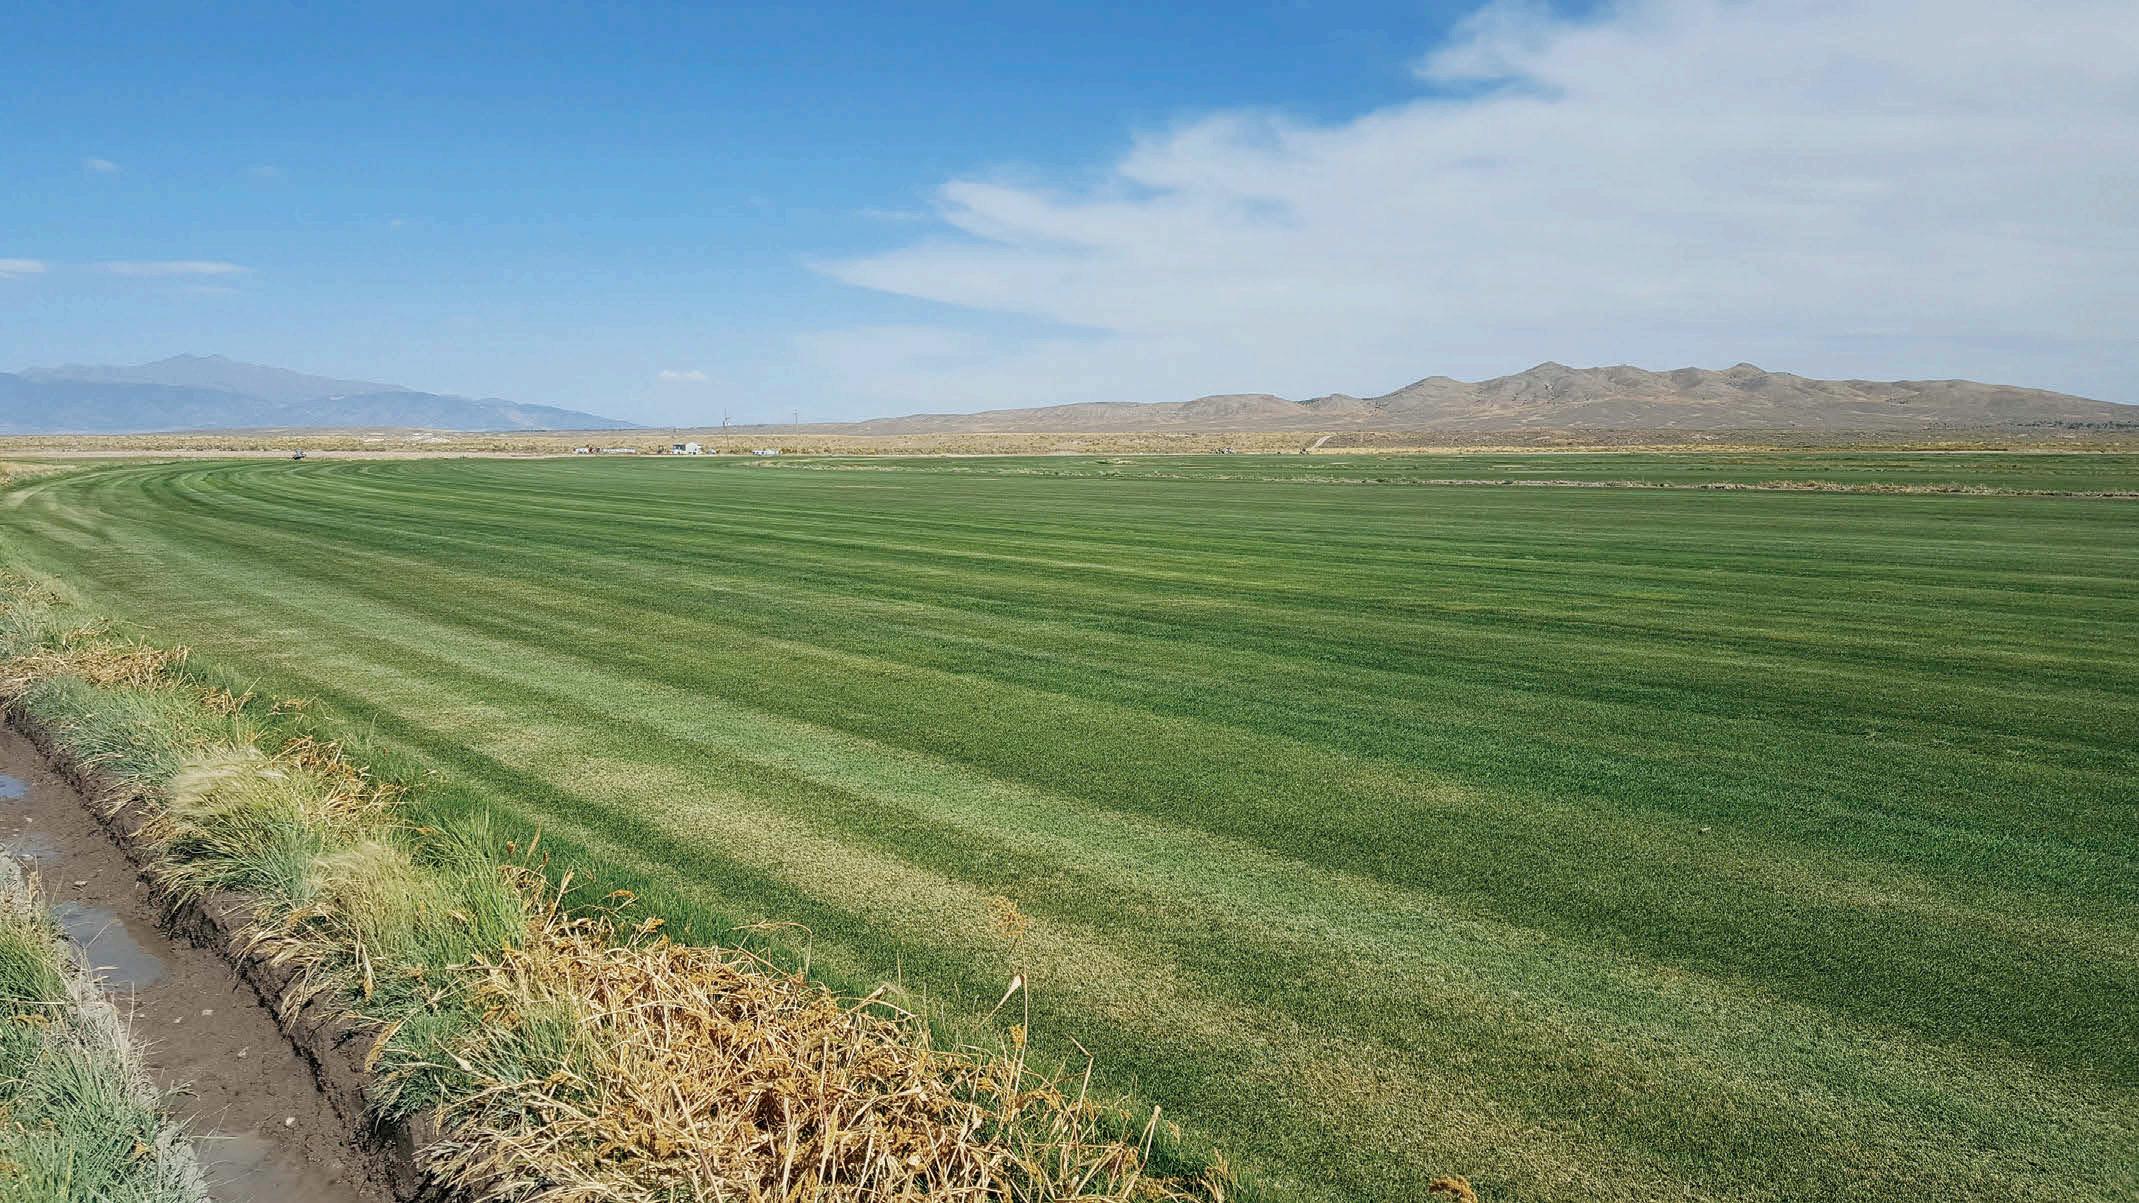
Blue Coat Kentucky Bluegrass, a cultivar developed by Columbia River Seed, is shown here growing in one of the company’s production fields. Photo courtesy of Columbia River Seed
Data analyzed by Location Performance Index Groups resulted in greater statistical differences than past years. Bombay, Starr, Cloud, Barserati, and PPG-KB 1131 performed well overall in each LPI group. Bombay, Starr, and Cloud also performed at the top of turf quality under Schedule “A” (1.5-2.5 inches mowing height, 3-4 lbs./N/1000 sq. ft., irrigation to prevent stress or dormancy) and Schedule “B” (2.5–3.5 inches mowing height, 1 lb./N/1000 sq. ft., no irrigation after establishment) managed locations. These same entries also performed consistently well in data analyzed by region in 2020 (Northeast, Transition, North Central, and Upper Mountain/West). As with past trials, the 2017 Kentucky bluegrass trial consists of several ancillary locations testing for tolerance to various stresses. Shade tolerance was evaluated at Ames, IA, in 2018, 2019, and 2020, where no statistical differences were noted among entries. Traffic tolerance was evaluated at four locations in 2020. Finish Line was statistically the top overall entry in quality ratings collected at Amherst, MA, with also the highest wear tolerance ratings. North Brunswick, NJ, simulated traffic for four weeks in summer and four weeks in fall. At the end of the fall traffic season, the top statistical group entries were BAR PP 7K426, Barvette HGT®, and DLFPS-340/3552. Only small statistical differences were noted among the entries in traffic data collected at Blacksburg, VA, and Fayetteville, AR. Data on various diseases such as summer patch (Magnaporthe poae), dollar spot (Clarireedia spp.) and stem rust (Puccinia graminis) were reported again in 2020. Data on summer patch, one of the most devastating diseases on Kentucky bluegrass, was collected at three locations with Barserati, Bombay, A15-6, DLFPS-340/3550, and DLFPS-340/3551 finishing with the highest tolerance ratings. Dollar spot ratings collected at North Brunswick, NJ, identified AKB3241, Blue Gem, DLFPS-340/3551, DLFPS-340/3552, NAI-15-80, and NK-1 with the best resistance. Stem rust ratings from two locations again demonstrated some entry differences, with A11-26, Barserati, A16-17, and DLFPS-340/3552 showing the least disease damage.
Tall Fescue
Second year data from our latest tall fescue trial, established in fall 2018, is now available. This new trial contains 132 entries, of which almost all are experimental. Year one data typically reflects establishment rate, with year two data being a better reflection of future performance. Turfgrass quality ratings from 2020 are organized and analyzed within five LPI groups and seven geographical regions. Statistical differences were small within the LPI groups, with more statistical separation noted within the regional analyses. The entries TD2, K18-RS6, Spyder 2LS, and AH2 were among a group of excellent performers finishing in the top statistical group in each of the seven regions. Tolerance to stresses such as traffic, shade, drought, and brown patch are being evaluated throughout the trial period. Shade data collected at Ames, IA, yielded no statistical separation again in 2020. Similarly, data collected in 2020 from a low mowing height trial (1.5 inches) at Blacksburg, VA, and drought data collected at Logan, UT, did not result in statistical significance. With three more years of trial data, we expect these trials will show interesting results and useful data. Some of these studies initiate after full establishment, therefore the first significant data was initiated in 2020. Traffic applied at Amherst, MA, yielded good statistical separation with TMT1 and AH1 finishing with some of the highest traffic tolerance ratings, as well as the top turfgrass quality ratings. Intensive traffic was applied on the tall fescue trials at North Brunswick, NJ, during summer 2020. Although statistical differences among entries were small, large differences in ground cover and canopy fullness were noted with some of the best entries maintaining more than 65 percent ground cover after four weeks of traffic damage, versus the poorest performing entries with less than 25 percent ground cover. Entries with the highest ground cover under traffic include Degas, GLX Aced, and RH3. Brown patch (Rhizoctonia solani) is typically the most prevalent disease on tall fescue, and as is typical, several locations noted and rated the disease in 2020. Year two data yielded more statistical significance for brown patch than year one, with about one-third of the entries performing similar to the top entries. Some of the highestranking entries for brown patch in 2020 include Dynamite G-LS, PPG-TF 323, RH3, DLFPS-321/3705, and PPGTF 316.
Perennial Ryegrass
Perennial ryegrasses are occasionally used in sod mixtures because of positive attributes such as fast germination, better establishment under low and high temperatures, and traffic tolerance. A new trial of perennial ryegrass, established in 2016, consists of 114 entries, most being new experimentals. Fourth year data from this trial (2020) is now available on our website. Data from 2020 showed significant performance variation among the fifteen locations submitting data. Some entries that finished the year in the top statistical group at several locations include Stellar 4GL, Pharaoh, and 02BS2. Drought tolerance was tested at Logan, UT, again in 2020, alongside a standard irrigation trial regime. As in previous years, statistical differences were not large among entries, but PPG-PR 370, PPG-PR 423, Furlong, NP-2, and Slugger 3GL were the five highest rated entries in the drought tolerance evaluation. Entries performing in the top statistical group under both normal irrigation and drought include NP-2, PPG-PR 370, and PR-6-15. Traffic tolerance was tested at two locations, Amherst, MA, and Corvallis, OR, in 2020, with each site using different methodology. Even though several entries performed well in only one of the two sites, there are several that performed well at these two diverse sites, 3,000 miles apart. Entries 02BS2, SR4700, Furlong, Apple 3GL, and Stellar 4GL, among several others, finished at the top of quality rating averages at Amherst, while also finishing in the top group at Corvallis. A few diseases were noted on these trials in 2020. Unfortunately, only data from pink snow mold (Microdochium nivale) collected in St. Paul, MN, showed significant entry separation. Some of the best pink snow mold entries in 2020 were PPG-PR 372, Slugger 3GL, and DLFPS-236/3547.
Fineleaf Fescues
The term “fineleaf fescue” includes several species. Strong creeping red fescue (Festuca rubra spp. rubra) and slender creeping red fescue (Festuca rubra var. littoralis) possess rhizomes and therefore add knitting ability to a sod mixture. Chewings fescue (Festuca rubra ssp. fallax) has a bunch-type growth habit and traditionally better disease resistance than the creeping red-types. Hard fescues (Festuca brevipila) are also bunch-type grasses but have generally better drought tolerance than Chewings or creeping types. Sheep fescue (Festuca ovina L. ssp. hirtula) is best suited for low maintenance sites because of its unique, swirly, growth habit from within the crown of the plant. A new fineleaf fescue trial was established in 2020, but the most recent data available is a five-year summary from our 2014 trial. The 2014 trial consisted of 42 total entries, broken down into hard fescue (10), strong creeping red fescue (16), slender creeping red fescue (3), chewings fescue (12), and sheep fescue (1). The trial was planted at ten standard trial locations and eleven ancillary trial locations. Data summarized for each year, while also summarized over all years and locations, show variation in performance. The LPI groups often were sorted based on groups of species that performed well at selected locations. For instance, 2018 data was sorted into three LPI groups, the first with hard fescues as top performers, the second dominated by chewings fescues, and the third with top turf quality from the strong creeping red fescues. This trend continued throughout the trial; therefore, a purchaser must look closely to trials in their area to gauge the best species and cultivars for their market. For hard fescue, some of the best quality was noted with Gladiator, Jetty, Minimus, Resolute, and DLFPS-FL/3066. Chewings fescue entries Bolster, Compass II, DLF-FRC/3057, Leeward, Momentum, and Radar were the top overall performers. And 7C34, Cardinal II, DLF-FRR 6162, and PST-BEN posted some of the best turf quality scores of the creeping red fescue entries. Traffic tolerance of entries in this trial is conducted under both fairway mowing height and lawn mowing height at sites such as St. Paul, MN, (fairway), East Lansing, MI, (fairway), Storrs, CT, (fairway), Amherst, MA, (lawn), Corvallis, OR, (lawn), and North Brunswick, NJ, (lawn). The fairway sites utilize an apparatus that simulates golf cart traffic and damage. The locations used a similar protocol: two passes per day with the traffic simulator, three times per week from May through September. At the Storrs, CT, site, chewings fescues such as Radar, Bolster, and BAR VV-VP3-CT were the top performers over the trial period. At nearby Amherst, MA, but with home lawn management, a mixture of chewings, hard, and slender creeping red fescues were the best for quality under traffic. The Corvallis, OR, site, also managed as a home lawn, finished in similar fashion as the Amherst site with a mixture of species performing well. In Corvallis, the strong creeping red entry 7C34 and slender creeping red entry Beudin were the best overall performers. Consistency in performance was evident in the fairway traffic sites at East Lansing, MI, and St. Paul, MN. SeaMist (slender creeping red), Bolster, Leeward, and BAR-VV-VP3-CT (all chewings fescues) and Resolute (hard fescue) were top performers at both sites. And the best entries at the North Brunswick, NJ, lawn traffic trial were hard fescues Sword, Jetty, Gladiator, Resolute, and MNHD-14, and chewings fescues Bolster, Leeward, and Castle.
Other ancillary trial sites evaluated performance under unique environmental or management conditions. Shade tolerance was evaluated at Carbondale, IL, where entries from different species were included in the top group. Chewings fescues such as DLF-FRC 3338, Leeward, Compass II, Bolster, ‘BAR-VV-VP3-CT, Castle, and Radar led the way under shade, but strong creeper DLF-FRR 6162 and slender creeping red entry SeaMist also matched the performance of the top
chewings entries. Riverside, CA, collected data from a trial that is mowed only once or twice a year. Hard fescues Minimus, PST-4BND, Jetty, Sword, and Gladiator, along with creeping red entry DLF-FRR 6162 were the best entries under the infrequently mowed management at Riverside. And the California Golf Club of San Francisco site on a golf course fairway, found SeaMist, Momentum, Beudin, Navigator II, and PST-BEN as the best performing entries. Several diseases were noted and rated at various locations over the trial period. Leaf spot (various species) was rated at three locations, with the hard fescues Minimus, Resolute, DLFPS-FL/3066, Jetty, and MNHD-14 showing the best resistance. Data on dollar spot was collected at eight locations with a mixture of hard fescues (i.e., Gladiator, Compass II, and Jetty) and chewings fescues (i.e., Bolster, Leeward, and RAD-FC44) showing the best tolerance. Several hard fescues, including Gladiator, Beacon, DLFPS-FL/3066, MNHD-14, and Jetty finished with the highest ratings for red thread tolerance. And Jetty, Minimus, and DLFPS-FL/3066, all hard fescues, were the top summer patch performers.
Bentgrass
New trials of bentgrass were established in fall 2020, but the first data will not be released until spring 2022. Therefore, the most recent data available is from the 2014 bentgrass trials, which finished in fall 2019. Two species are included in those trials: creeping (Agrostis stolonifera) and colonial (Agrostis tenius). The five-year summary compiled from the 2014 trials is available on our website and is the basis for the bentgrass discussion that follows.
Putting Green Trial
This trial, containing twenty creeping bentgrasses, was established at nineteen locations. Turfgrass quality ratings collected throughout the five-year trial have revealed several new cultivars that can exceed the quality delivered by previous top performers Declaration, V-8, Penn A-1, and Luminary. MacDonald was the only entry that finished in the top statistical group within each LPI designation for each year, which is quite an accomplishment. Also performing very well overall during the five-year period were Piranha, L-93 XD, 777, and DLFPS-AP/3058. Ancillary trials of reduced irrigation, traffic, and golf course use were conducted at a limited number of sites. Traffic evaluations conducted at Amherst, MA, from 20152018 showed Pure Eclipse, MacDonald, Tour Pro, and Piranha with the top overall turf quality scores. The Logan, UT, site managed their trial by reducing irrigation based on ET o (potential evapotransporation), which resulted in Piranha, Kingdom, MacDonald, Pure Select, and DLFPS-AP/3058 landing in the top statistical turf quality group. This trial was also evaluated ‘on-site’ at three golf courses, Los Angeles Country Club, the California Golf Club of San Francisco, and North Shore Country Club in Glenview, IL. Many NTEP bentgrass trials have been evaluated at North Shore over the years, with excellent results. However, this trial demonstrated very few statistical differences over the trial period. This result contrasts with the results seen at other ‘on-site’ locations. The California Golf Club of San Francisco location ended with Pure Select as the top overall entry, statistically better than all other entries. The Los Angeles County Club trial also included Pure Select in their top overall group, along with L-93 XD, MacDonald, Piranha, and Shark. Disease ratings were collected at several locations during the five-year trial. Dollar spot tolerance was rated at eleven locations with L-93XD, Declaration, Tour Pro, and DLFPS-AP/3058 with the highest average ratings. Brown patch and anthracnose (Colletotrichum cereale) were rated at several sites during the trial, but very little statistical differences were noted among entries.
Fairway/Tee Trial
With the new 2020 trial just starting, the 2014 trial is the latest five-year summary of data on fairway and tee bentgrass. The 2014 trial consisted of fourteen creeping and three colonial bentgrass entries and was planted at nineteen locations. Several entries delivered excellent performance across LPI groups and in different years of this trial. Creeping bentgrasses were overall the best performing entries, although colonial bentgrass entries DLFPSAT/3026 and Musket performed well in particular locations. Barracuda, a creeping bentgrass, was the most consistent turf quality performer over the trial length and across locations with top statistical performance in each LPI group, and each of the five years. In addition, creeping bent entries Piranha, Chinook, 007, V-8, and Crystal Blue Links finished in the top statistical grouping in most LPI groups and most years. Both the Logan, UT, and Riverside, CA, locations managed as ancillary sites utilized reduced irrigation. At Logan, the five-year data summary showed very good entry separation with Armor, Kingdom, and Nightlife in the top statistical turfgrass quality group. At Riverside, less statistical separation was noted with 007, Penncross, PST0RBS, and Shark tied at the top for overall quality at 6.2. Traffic tolerance, evaluated at three sites, yielded important data over the trial period. The most statistically significant data from our traffic sites was collected at Amherst, MA, with Piranha, DLFPS-AT/3026, Nightlife, and Kingdom. The Blacksburg, VA, traffic site evaluated turf quality based on divot damage and recovery in 2017, with Greentime, Crystal Blue Links, DLFPSAT/3026, Penncross, Musket, and V-8 posting the best quality ratings.
Since fairways and tees occupy the majority of managed turf on any golf course, disease resistance that will allow for fungicide reduction on fairway and tees is a major need for golf course superintendents. Brown patch and dollar spot were major diseases noted over the trial period. Brown patch data collected on a few dates at four locations showed the creeping bentgrass entries with the best tolerance overall, as entries such as Chinook, L-93 XD, and Piranha exhibited very little disease. Dollar spot data was rated at six locations and Chinook, DLFPS-AT/3026, Piranha, L-93XD, Musket, 007, Barracuda, and V-8 were the highest rated entries over the five years.
Low Input Cool-Season
In 2015, NTEP established its first managementbased trial, with seventeen locations that manage under ‘low input.’ The first trial of this type includes cool-season grass cultivars, experimentals, blends and mixtures of grasses and other species. Thirty-two entries were submitted by sponsors, including single cultivars and blends of Kentucky bluegrass, fine fescue, tall fescue, and perennial ryegrass; mixtures of several grass species, with some including strawberry, white, or Microclover® (Trifolium spp.); and even a western yarrow entry (Achillea millefolium L.). Management is minimal for the five-year trial, with no fertilizer applications or irrigation after establishment, no pest control at any time during the trial, and mowing at 3 – 3.5 inches on the thirteen standard trial sites. Three ancillary trial sites evaluate the effect of one annual grass pre-emergence application (spring 2016) only, then following standard trial protocols for the remaining four years of the trial. One additional trial location (West Lafayette, IN) made an additional fertilizer application on one half of each plot for 2016 and 2017 only, to evaluate the effect of the small increase of fertilizer on performance and survival. Overall, these locations are maintained very minimally, which is of interest to an increasing number of our customers. The entries in this low input trial, with no annual grass or broadleaf weed control, need excellent establishment, and then good ground cover to resist weed invasion and deliver good quality. With many different species, mixtures with clovers and even non-grasses (western yarrow), turfgrass quality ratings are more difficult to assess, sometimes leading to less significance among entries. And considering the trial length, entry performance in a low input trial is expected to decline over time. The final trial year finished with turfgrass quality ratings from many entries lower overall than a typical NTEP trial, with some locations again finishing with a turfgrass quality average score below 5.0, the NTEP threshold for minimum acceptable quality under low maintenance. In particular, overall ratings from Logan, UT, Kennett Square, PA, and Corvallis, OR, were below 5.0 for every entry. In contrast, sites at Blacksburg, VA, East Lansing, MI, and Storrs, CT, finished the trial with many entries of the 5.0 turf quality threshold. Fourteen locations submitted data in 2020. Overall, the mixtures containing the three percent of less aggressive clovers (Microclover® or strawberry clover) were some of the most consistent performers in 2020, either mixed with improved tall fescue cultivars (DLFPS TFAM or DLFPS TFAStC), or chewings and strong creeping red fescue (DLFPS ChCrM). Possibly, the clovers’ nitrogen-fixing ability added density and survivability to the turf stands. The tall fescue blend DLFPS TF-A and hard fescue MNHD-15 were also consistently good in 2020, along with Vitality Double, a 90 percent tall fescue/10 percent Kentucky bluegrass mixture, and Vitality Low Maintenance Mixture. Yaak, the western yarrow entry, that is interesting as it is not a grass, nor a legume, was initially a good performer, but has declined the last three years. Yaak was still a top entry at Logan, UT, and performed reasonably well at Mead, NE, W. Lafayette, IN, St. Paul, MN, and Raleigh, NC. Yaak’s performance at Blacksburg, VA, and Corvallis, OR, has declined however since 2019. Yaak performance may have suffered from the fact that it is a ‘non-traditional’ lawn species and therefore its appearance is quite different from grasses, which may hurt its quality ratings. Therefore, Yaak may still have a place as a lawn species or ground cover where low maintenance and native plants are requested.
Cool-Season Water Use
With the need to reduce turfgrass water use, the United States Golf Association (USGA) is partnering with NTEP to evaluate both cool- and warm-season grasses for water efficiency and performance under lower water use. The USGA has paid to install rain exclusion shelters at ten sites, five in the northern or transition zones (to evaluate cool-season grasses) and five shelters in the southern U.S. to evaluate warm-season grass water use and drought tolerance. Within these shelters, cooperators restrict irrigation for a period of 100 days on cool-season grasses,
or 120-150 days for warm-season grasses. These ‘drought seasons’ under the shelters are part of Approach 1, which is a measurement of the amount of water needed to maintain a prescribed level of green during that period. Ten trial locations in the drier western U.S. states (five each for cool-season and warm-season grasses) manage under Approach 2, which utilizes three evapotranspiration replacement rates (ETo). In Approach 2 locations, researchers replace either 40, 60 or 80 percent of ET o (as determined by local weather station data) for cool-season grasses, or 30, 45, or 60 percent ETo for warmseason grasses. This scenario is more typical of irrigation patterns in the western U.S. with 25 inches or less of annual rainfall. Approach 2 data indicates the reduced irrigation level each entry will survive, and at what level each entry will deliver acceptable turfgrass quality. Therefore, the two approaches address the needs across the U.S., from the humid, eastern U.S. with 30 plus inches of annual rainfall but with occasional prolonged drought periods, to the arid western U.S. where annual summer drought periods are expected. The warm-season version of this trial was established at ten locations in summer 2018. The coolseason version of this trial was established in fall 2016 or spring 2017 at ten total sites, five under rain exclusion shelters in the eastern U.S. (Approach 1) and five in western U.S. field sites (Approach 2). The cool-season version includes fifteen Kentucky bluegrasses, nineteen tall fescues and one perennial ryegrass (as a control entry). The first data from the cool-season trial was collected in 2017 at six of the ten locations. Four Approach 1 (shelter) locations collected data during a 100-day induced drought period, and in some cases, large differences were noted in the amount of water used by entries, however very small statistical differences were noted among entries. For 2018, we changed the rewatering procedure threshold to 65 percent green cover, as well as expanded our statistical analysis for all sites to include separate Kentucky bluegrass and tall fescue tables. In 2018, all Approach 1 locations noted large differences in water needed to maintain 65 percent green cover. Four locations that were unable to collect three years of data by 2019, concluded their data collection in 2020. The Fayetteville, AR site’s (Approach 1) seasonal water needed ranged from 34.0 mm to 80.7 mm in 2020. No statistical differences were noted among water needed when comparing all Kentucky bluegrass and tall fescue entries. However, there was some statistical significance among tall fescues when compared only to other tall fescue entries. Nonet (38 mm), MRSL TF15 (47 mm), BarRobusto (51 mm), Stetson II (51 mm), and Titanium 2 LS (51 mm) used the least water of the tall fescue group. Various factors resulted in limited data collection in 2019 at the Amherst, MA, site (Approach 1), therefore they collected 2020 data using two distinct dry-down ‘seasons.’ The first dry-down season of 2020 showed excellent entry differences under the rainout shelter with NAI-13-14 and PST-K11-118 Kentucky bluegrass requiring the least water to maintain green cover (8.7 mm). Other bluegrasses such as Everest, Babe, Midnight, and NAI-13-132 also finished in the top statistical group, surprisingly ahead of every tall fescue entry. The second dry-down season delivered very similar water use numbers, but with much less statistical significance. NAI-13-14, PST-K11-118, Babe, and Everest needed the least water again in ‘Season 2’ but with several tall fescues performing equally well. Two sites, Logan, UT, and Fort Collins, CO, collected 2020 data under the Approach 2 regime. In 2018 and 2019, no Kentucky bluegrass season average reached the acceptable lawn quality level at any ETo level in Logan, with many falling below even the minimally acceptable quality score for low maintenance (5.0). This trend continued in 2020, except a few bluegrass entries did finish with turf quality averages of at least 5.0. Under the 40 percent ETo regime, Dauntless, NAI-13-14, and PST-K13-137 finished at 5.0 or 5.1 in turf quality. Under the 60 percent ETo level, those same entries were at or above 5.0, also with PST-K13-141 and PST-K11-118 (6.0). At 80 percent ETo, only PST-K13-141, Dauntless, and NAI-13-14 finished above 5.0. Tall fescues again performed better overall than Kentucky bluegrass at Logan as several entries maintained lawn turfgrass acceptable quality (6.0+) under 40 percent ET o . Tall fescue entries Kingdom, Thor, and PST-5SDS finished with the highest turfgrass quality under the 40 percent ETo replacement with season average turfgrass quality scores of 6.6, 6.5, and 6.4, respectively. Also noteworthy is that the turf quality scores of those three tall fescue entries did not fall below acceptable (6.0) for any of the last eight weeks of the drought ‘season.’ The story with the 2020 Fort Collins, CO, data was 1) statistical significance was very small, and 2) no entries delivered acceptable turfgrass quality scores (6.0 or above), even under the optimum 80 percent ETo replacement level. All entries struggled under 40 percent ET o replacement as tall fescues DLFPS 321/3677 and PST-5SDS had the highest average turf quality at 4.3. The 60 percent ETo level did deliver one tall fescue entry (Thunderstruck) with a minimally acceptable average score of 5.0. Several tall fescues, but no Kentucky bluegrasses finished with a minimally acceptable average quality under 80 percent ET0 replacement. The best tall fescues under this level were PST-5SDS (5.5), DLFPS 321/3679 (5.4), Kingdom (5.4), and Thor (5.4).
Other Species
Other cool-season species, such as prairie junegrass (Koeleria spp.), tufted hairgrass (Deschampsia cespitosa), rough bluegrass (Poa trivialis), supina bluegrass (Poa supina), and annual bluegrass (Poa annua) are potential sod products, although limited in their utility and geographical
area of adaptation. Native species, such as junegrass and tufted hairgrass, under low maintenance can form a dense sward with an appearance somewhat like perennial ryegrass or Kentucky bluegrass. One tufted hairgrass cultivar has been tested by NTEP (1998 NTEP Fineleaf Fescue trial). The other bluegrass species, rough, annual, and supina are still very much under development without a lot known about their performance characteristics and production needs. Other native species, such as inland saltgrass (Distichlis spicata) and poverty grass (Danthonia spicata), have special traits such as salt tolerance (inland saltgrass) or tolerance to infertile soils (poverty grass), but are probably several years away from commercialization.
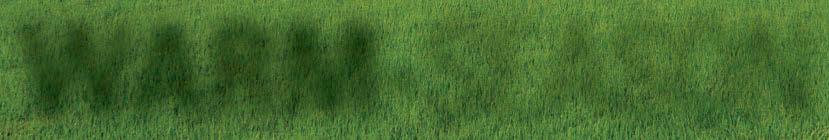
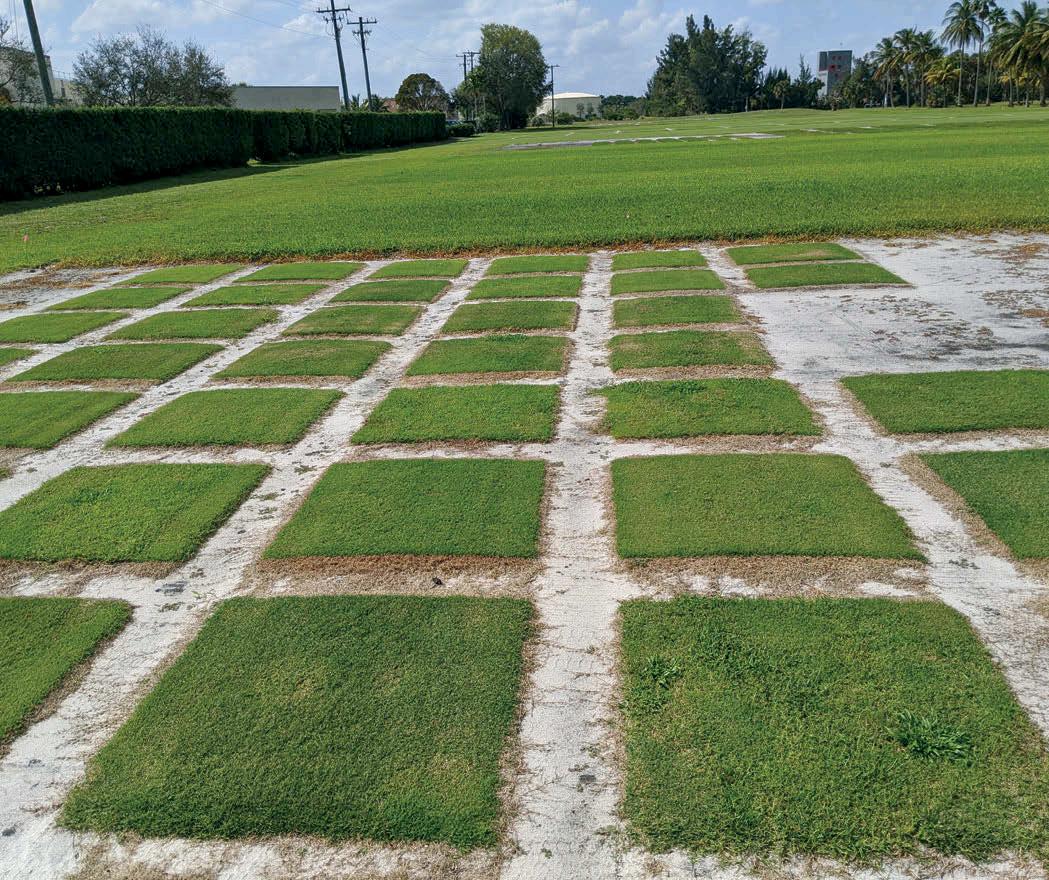
Marked differences are shown in fall growth and color retention in the bermudagrass cultivars in these trial plots at College Park, Maryland. WARM-SEASON groups were compared separately, as well as against each other. Also, as in the past, the best vegetative entries often outperformed the best seeded entries in 2020 turfgrass quality data. Only small statistical differences were noted Last year’s article reported on five-year summary among seeded entries, but greater overall statistical results from three warm-season trials: bermudagrass, differences were seen among vegetative entries. The zoysiagrass, and warm-season putting green, established vegetative entries Tahoma 31, MSB-1017, Latitude 36, in 2013. New versions of each of these three trials were TifTuf TM , OKC1876, and Astro were the only entries to established in summer 2019. Therefore, the first data from finish in the top of each LPI group.these new trials (2020) is published and now available. Ancillary trial testing is underway at several Bermudagrass locations for this trial. The first data on traffic tolerance was collected at Raleigh, NC. A mix of seeded and vegetative The 2019 bermuda NTEP trial contains thirteen entries filled the top statistical group at Raleigh. The (13) seeded entries and twenty-two (22) vegetative highest overall turfgrass quality ratings under year one entries, established at twenty-one (21) locations across traffic were delivered by vegetative entries TifTuf and the southeast, Transition Zone, and southwest U.S. Latitude 36, and seeded entries OKS2015-3, JSC 2013Many of these entries are experimental cultivars or new 10S, and Riviera. commercial cultivars. NTEP evaluates warm-season Other ancillary trials include drought tolerance, grasses by comparing seeded and vegetative entries, also by salinity tolerance, shade tolerance, spring dead spot separately comparing seeded vs. seeded and vegetative vs. (Ophiosphaerella spp.) tolerance, and divot recovery. No vegetative. statistical differences emerged in year one data from the The first year of any new trial is highly influenced Las Cruces, NM, salinity tolerance evaluations. Spring by establishment rate. This is especially true for the warm- dead spot ratings collected at West Lafayette, IN, showed season grasses as many entries are vegetatively propagated statistical differences. And initial shade evaluations showed types. Typically, seeded entries establish quicker than several entries including MSB-1020, MSB-1017, and vegetative types, and this is what we have seen thus far MSB-1042 with better tolerance of shade than twenty-with this trial. Establishment rates are analyzed and four (24) other entries. Additional years of testing and data reported by individual location, and not summarized across are needed for each of these characteristics. locations. However, some trends in the data are apparent. Drought tolerance is being evaluated at both The seeded entries as a group overall established faster College Station, TX, and Riverside, CA. These two sites than the vegetative entries. Entries such as Mississippi utilize different methods to impose drought, with College State University entries MSB-1017, MSB-1042, and Station eliminating irrigation for a block of time (‘acute’ MSB-1050 were often the fastest establishing vegetative entries, rivaling the establishment rate of some of seeded tolerance) and Riverside managing using a reduced ETo replacement (‘chronic’ tolerance). Greater statistical entries. Overall, large statistical differences were noted in differences were noted at Riverside in 2020, with only establishment rate, which is a boon for producers and end- MSB-1017, TifTuf, OKC1873, OKC1876, and MSBusers. 1042 vegetative entries in the top turf quality statistical Turfgrass quality data from thirteen standard trial group. Fewer statistical differences were noted in 2020 sites was divided into four LPI groups when statistically data from College Station but several of those same entries analyzed. As with past analyses, seeded and vegetative finished with the highest quality ratings. In addition,
drought dormancy differences were noted among entries, even though statistical differences were small. Divot recovery was also rated at Stillwater, OK, in 2020. Divots cut in early August were measured regularly throughout the next four weeks to assess speed of fill-in and recovery. Recovery averaged over ten ratings varied from 81.7 percent - 59.8 percent (LSD = 5.0). Several seeded entries including JSC 2013-10S (81.7 percent), JSC 2013-7S (81.3 percent), Riviera (81.1 percent), JSC 77V (80.9 percent), and JSC 2013-8S (80.8 percent) demonstrated the fastest recovery from divot injury.
Zoysiagrass
Meyer zoysiagrass was released in the early 1950s and has been a standard in the industry ever since. Meyer is known for its medium leaf texture (for a zoysia japonica type) and excellent winter hardiness. Zeon is a zoysia matrella type that is finer textured than Meyer. Zeon is a standard for use on golf course fairways and tees because it can develop a dense turfgrass at mowing heights of 0.5 inch or lower. Both grasses are included in this trial as standard entries. Our latest zoysiagrass trial, established at nineteen locations in 2019, consists of thirty-nine (39) vegetative entries, almost all experimental. These new entries are demonstrating how far zoysiagrass breeding and development has advanced in the last few years. At least some of these new experimentals are destined for commercialization within the next few years, which is exciting news for the future of zoysiagrass use and adaptation. As a historically slow establishing species, one of the most important traits in a new zoysiagrass cultivar is spread rate. Several locations rated establishment rates, with many entries establishing much faster than Meyer, and several faster than Zeon. However, establishment rate was dependent on location as some entries were fast establishing at one or more locations, but not all locations. Some entries that were consistently at the top for establishment include FZ 1440, Empire, and FZ 1410. Zoysiagrass is one of the more winter-tolerant warm-season species, but still has limits to its adaptability and survivability in northern locations. Plant breeders strive to incorporate a mixture of traits into each cultivar that suits their intended market. Finer-textured zoysias have been less winter-tolerant than broader-textured types. Breeders, however, work to include more winter tolerance into finer-textured types to broaden their geographical adaptability. It is too early to tell if they have been successful with this group of experimentals, but our northern most locations will most likely help us to sort out those entries with superior winter tolerance. The identification of winter tolerant experimentals and cultivars has started in our northernmost location, West Lafayette, IN. Spring 2020 revealed ground cover ratings ranging from 97.7 – 0 percent, with ten entries falling below 50 percent living ground cover. Turfgrass quality ratings collected in 2020 were divided into four LPI groups by our software. LPI groups 1 and 4, mainly representing southeast U.S. locations, showed only small statistical significance among entries. However, a few entries, such as FZ 1727, FAES 1319, FZ 1440, and FZ 1722 finished in the top ten of entries in both LPI groups. LPI group 2, with data from Ft. Lauderdale, FL, Fayetteville, AR, and Riverside, CA, showed great statistical separation with DALZ 1048 and FX 1436 tied at the top with an average quality score of 7.6. LPI group 3 (West Lafayette, IN, Columbia, MO, and Manhattan, KS) delivered the most statistical separation with several entries shining possibly due to differences in cold tolerance. Fine-texture standards Zeon and Emerald topped the turf quality ratings in group 3, followed by DALZ 1808, FAES 1319, FX 1422, and DALZ 1707. Ancillary trials of traffic, drought, and shade tolerance were initiated in 2020. The first-year traffic tolerance data from Raleigh, NC, ended with good entry separation, and DALZ 1601, FX 1407, DALZ 1311, and FX 1410 with the highest turf quality scores. Shade tolerance was tested at College Station, TX, with excellent separation among entries. DALZ 1807, DALZ 1802, and UGA-GZ-17-4 were the highest scoring entries under shade, followed by four other entries in the top statistical group. And drought tolerance was evaluated at Dallas, TX, with DALZ 1311, FZ 1410, Empire, FZ 1407, and DALZ 1603 demonstrating the best recovery from drought.
Warm-Season Putting Green
In 2013, the U.S. Golf Association (USGA) co-funded a trial with NTEP to identify warm-season grasses that can provide acceptable putting surfaces where course owners want to save water, pesticide, and fertilizer inputs. That trial included not only bermudagrass, but also zoysiagrass and seashore paspalum. Seashore paspalum has been utilized on putting greens for the last decade or so, but zoysiagrass has almost no history as a putting green surface in the U.S. (zoysia has been a mainstay of ‘summer’ putting greens in Japan for decades). Including three different species in one trial offered challenges, particularly in management specifics that may differ from one species to another. The 2013 trial is now complete and data from 2013-2017 has been summarized into a final report that is available on NTEP’s website. A new trial containing nineteen entries (nine bermuda, six zoysia, and four seashore paspalum) was established at ten locations in 2019. The first data on this new trial is now available, with data being reported by location and not summarized over all locations. As with the 2019 bermuda and zoysia NTEP trials, establishment rate is a contributing factor to the first year’s performance of this trial. At most locations, several bermuda entries including MSB-1050, Tahoma 31,
OKC0805, Tifeagle, and OKC3920 were the fastest to full cover. At a few locations (Griffin, GA, Columbia, MO, and Las Cruces, NM) seashore paspalum entries such as SeaStar and UGA 16-1105 established at a rate equivalent to the top bermudas. The zoysias are typically slow to establish but at Griffin, GA, and Mississippi State, MS, entries Diamond and FZ 1710 showed greatly improved establishment. Data from 2020 showed significant differences in genetic color, leaf texture, and density. Differences were also noted in spring greenup, fall color retention, and seedhead production. These traits will be interesting to track over time, along with reaction to diseases and other stresses. For now, turfgrass quality ratings are the best gauge of the first-year performance. Eight locations submitted 2020 turfgrass quality data and entry performance was relatively consistent across locations. Two seashore paspalum entries, SeaStar and UGA 16-1105 finished in the top statistical group at seven of the eight sites. Bermudagrasses Tifeagle, MSB-1050, Tahoma 31, and seashore paspalum UGA 17-653 also performed well in 2020 landing in the top turf quality statistical group at six locations. The most consistent zoysia to date has been FZ 1710, as it finished in five location’s top statistical group. In 2021 and beyond, more data on long-term performance, diseases, and other stresses will be collected and available from this trial. St. Augustinegrass and seashore paspalum cultivar development has been fairly limited in the U.S. for a long while. The situation changed in the early to mid2000s when new plant breeders were hired at southern universities like Texas A&M, University of Florida, and North Carolina State University. With those folks in place, along with established programs at the University of Georgia and Mississippi State University, and with a major federal (USDA) grant from the Specialty Crop Research Initiative (SCRI), an increase in breeding of warm-season species is occurring across the southern U.S. Growers and consumers are now seeing new cultivars of St. Augustinegrass and seashore paspalum in the marketplace. These new cultivars will have improved drought and salt tolerance, as well as other improvements. To evaluate some of those new experimental grasses, NTEP initiated new trials of St. Augustinegrass and seashore paspalum in summer 2016. Fourth year data from those trials (2020) is now available and is discussed below.
St. Augustinegrass
St. Augustinegrass is a species where several older cultivars are still competitive in the marketplace. Floratam, developed by the University of Florida and Texas A&M and released in 1973, Raleigh, a cold tolerant cultivar, and newer releases Mercedes and Palmetto still compete in the U.S. market. In some areas, sod producers grow and market their own local selections while there are still common-type cultivars, like Texas Common sold extensively in some markets. New releases such as TamStar and CitraBlue are making their way into the marketplace, which means more, and better, cultivar choices will soon be available for sod growers and homeowners alike.

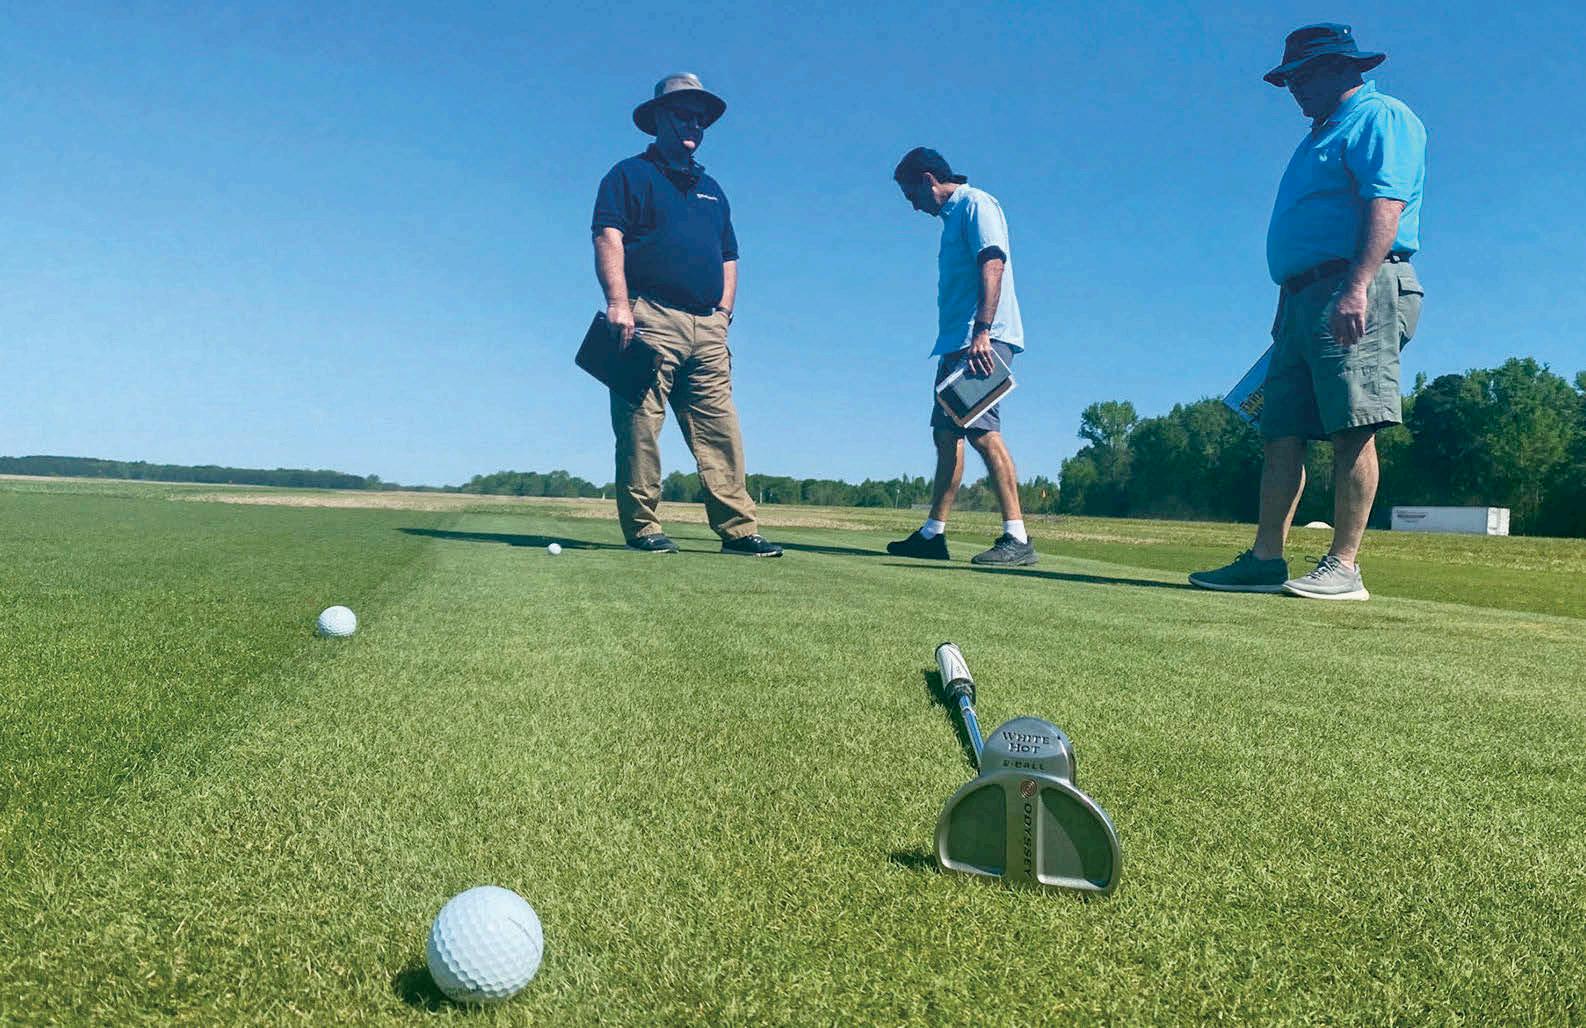
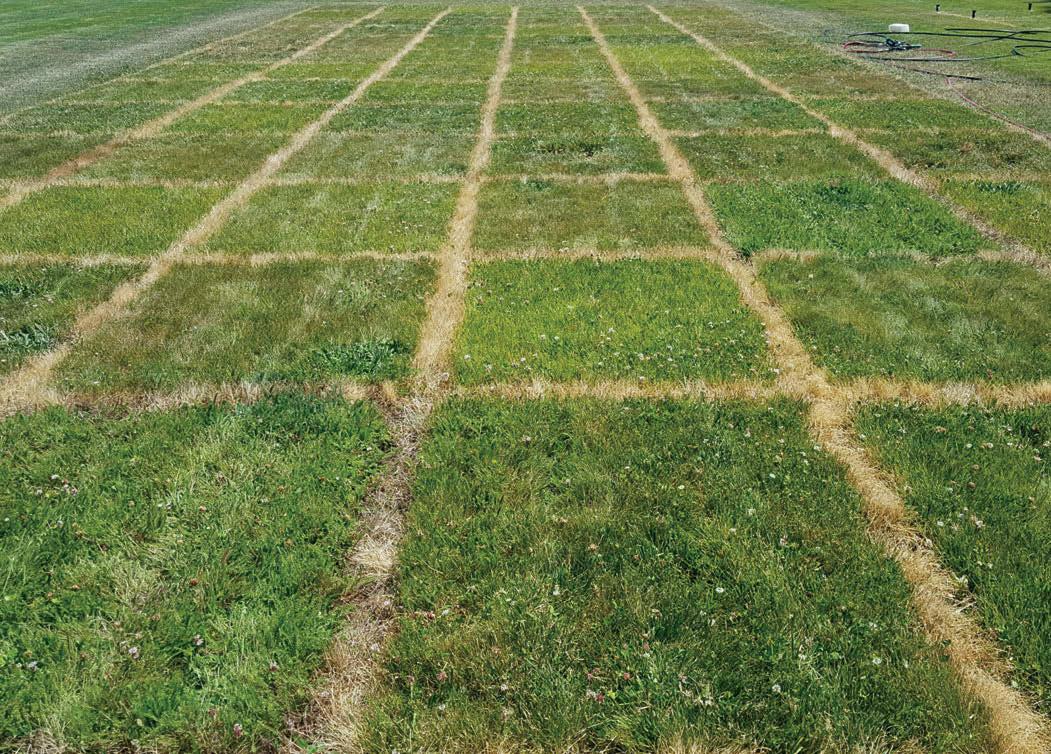
Turfgrass producers, such as Biograss Sod Farm in Vernon, Utah, (shown in this photo) use the data from NTEP trials to select the cultivars they will grow to meet the needs of customers in their marketing area.
Our newest St. Augustinegrass trial includes three standard entries (Floratam, Raleigh, and Palmetto) and twenty-four experimental entries, planted at ten locations. Turfgrass quality data from year one and two (2017 and 2018) showed several entries often outperforming the standard entries. In 2020, entry performance varied significantly by region. Similar to 2019, CitraBlue was the highest scoring entry at the two Florida locations, Fort Lauderdale and the western panhandle site at Jay, Florida. FSA 1610 and FSA 1606 were also good performers at both Florida sites. CitraBlue, FSA 1606, FSA 1605, FSA 1610, and Palmetto were particularly good in the Ft. Lauderdale, FL, ancillary trial location where plots are maintained with about one-half of the nitrogen level of the standard trial site. The Dallas, TX, location had three Texas-bred entries, DALSA 1502, DALSA 1618, and DALSA 1501 in the top statistical group, along with Palmetto. Results from our drought tolerance ancillary trial in College Station, TX, showed only small statistical differences in 2020, but DALSA 1618, DALSA 1623, DALSA 1502, and FSA 1613 finished with the highest overall turf quality. Other entries, including Palmetto, Floratam, and UGA TX SA26 also performed well under drought in 2020. Three southeastern U.S. locations collected data that resulted in some consistent performances. FSA 1613, CitraBlue, and FSA 1608 were the only entries to finish in the top statistical group at Raleigh, NC, Mississippi State, MS, and Auburn, AL. Entries that performed well by landing in the top turf quality statistical group at two of the three sites include FSA 1614, Palmetto, USGA TX SA26, Raleigh, DALSA 1618, and DALSA 1501. Fall color retention is an important characteristic, particularly in southern regions where turfgrasses are expected to provide green turf for eight months or more. Locations from Auburn, AL, to the Panhandle of Florida (Jay), to south Florida (Ft. Lauderdale) collected fall color retention in different months of the year in 2020. Overall, Florida-bred entries outperformed many other entries with superior fall color retention demonstrated by entries such as CitraBlue, FSA 1606, FSA 1605, FSA 1601, FSA 1610, and FSA 1604.
Seashore Paspalum
Seashore paspalum is known for its salt tolerance, however turfgrass managers are now considering paspalum for its unique turfgrass quality as well. NTEP initiated testing of seashore paspalum in 2007. Eight new entries plus two standards are included in the new seashore paspalum trial, planted at eight locations in 2016. Summarized turfgrass quality data from 2020 at six locations again showed that good progress has been made by breeders as several new experimental entries are performing well. At most locations, small or little statistical significance of overall turf quality ratings was noted among entries. SeaStar did, however, finish at or near the top of turf quality average scores at four of the six locations. UGP 73 was consistently good at four locations as well. The greatest performance difference was observed at Auburn, AL, with UGP 94, SeaStar, and UGA HYB2 alone in the top statistical group. No diseases were noted on this trial in 2020. Fall color retention was rated by several locations but the results were somewhat inconsistent. At Stillwater, OK,
UGA SR15-15 and UGA SR15-14 held color the longest throughout the fall. At Riverside, CA, Salam had the best fall color, followed by UGA SR15-14 and UGA 1743. The Jay, FL, location recorded UGP 94 and UGP 73 with the best October fall color retention. October fall color ratings from both Griffin, GA, and Auburn, AL, showed UGA SR15-14 at the top.
Low Input Warm-Season
In 2018, a new warm-season grass trial, including multiple species managed under low inputs was established at eleven locations. Year two data from that trial, (collected 2020) is now available on the NTEP website. The trial, partly supported by the U.S. Golf Association, intends to determine adequate to high performing warm-season grasses under golf course rough or similar-type maintenance. Maintenance parameters include mowing at two inches or higher, no more than weekly mowing, two lbs. of nitrogen or less per 1000 sq. ft. per year, irrigation only to relieve severe drought stress, and minimal pest control. The trial consists of ten total entries, of which four are bermudagrass, four are zoysiagrass, one is buffalograss, and one is a mixture of buffalograss, curly mesquite (Hilaria belangeri), and blue grama (Bouteloua gracilis). Data from 2018 focused primarily on establishment, due to late spring or early summer planting dates. At some locations, full establishment was not achieved until sometime in 2019, therefore, more establishment data was collected. Data collection in 2020 therefore, concentrated more on turfgrass quality along with percent living ground cover, weed invasion, and canopy height measurements between mowings. Turfgrass quality ratings collected in 2020 had Tifway and Midirion bermuda, both old standards, along with XZ 14069 zoysia, as the most consistent performers, finishing in the top statistical group at seven of eight sites. Entries also performing well overall include Meyer and 16TZ-14114 zoysia, along with FB 1628 bermuda. Canopy height measurements are required for this trial, and subsequently are collected at several locations. Data collected in 2020 was consistent with 2019 data as zoysia entries, XZ 14069 and FAES 1322 frequently had the lowest canopy height between mowings.
Warm-Season Water Use
As described in the cool-season water section, this trial features ten sites evaluating water-use, five under rain exclusion shelters and five managed using reduced levels of ET o replacement. The seventeen total entries (11 bermudagrass, four zoysiagrass, and two buffalograss) were planted in 2018, but due to slow establishment of some entries, water use evaluations were first initiated in 2020. As stated above, management procedures were slightly different for the warm-season version of this trial with irrigation restriction in the shelters (Approach 1) conducted for 120-150 days (compared to 100 days for the coolseason trial). Plots were rewatered when percent green cover reached 65 percent.
The reduced irrigation sites (Approach 2) utilized 30, 45, or 60 percent ETo as their replacement levels (as compared to 40, 60 and 80 percent ETo for the cool-season trial). Approach 2 sites were also designed to conduct their evaluations for 120-150 days (sixteen to twenty weeks); however, one location (Ft. Lauderdale, FL) ran their trial for thirty-three weeks. Another difference with the warm-season version is that the mowing height was ½ - 1 inch, where the cool-season trial was managed at a more typical lawn mowing height (2 – 3 inches). This change did affect some species, particularly the buffalograsses, which struggled at some locations due to the low mowing height. Data from 2020 was submitted by eight of the ten locations. In year one, compared to the cool-season trial entries, much greater statistical significance was noted between these entries. For instance, at the Approach 1 site in Stillwater, OK, the amount of water needed to maintain at least 65 percent green cover over the drought period varied from 0 – 160.7 mm (0 – 6.3 inches). Rio bermuda (0 mm), Prestige buffalograss (8 mm), Meyer zoysia (25 mm), and Dog Tuff bermuda (33.7 mm) finished in the top statistical grouping. Large variations in water needed to maintain 65 percent green cover were also noted at the Approach 1 site in Mississippi State, MS. The lowest water users were all bermudagrasses, ASC 118 (25.3 mm), FB 1628 (33.7 mm), ASC 119 (42.3 mm), Rio (84.3 mm), Monaco (84.7 mm), and TifTuf (84.7 mm), where the entry with the greatest water use needed 262.7 mm. At the Approach 1 sites in Lexington, KY, and Jay, FL, TifTuf required the least water of all entries (59 mm and 4.3 mm, respectively). At Lexington, the only other entry that performed statistically equal to TifTuf for water used was ASC 118 bermuda. Even though water applied
All Warm-Season Water Use trial entries are holding up well while under only 30 percent ET0 replacement irrigation at Fort Lauderdale, FL.
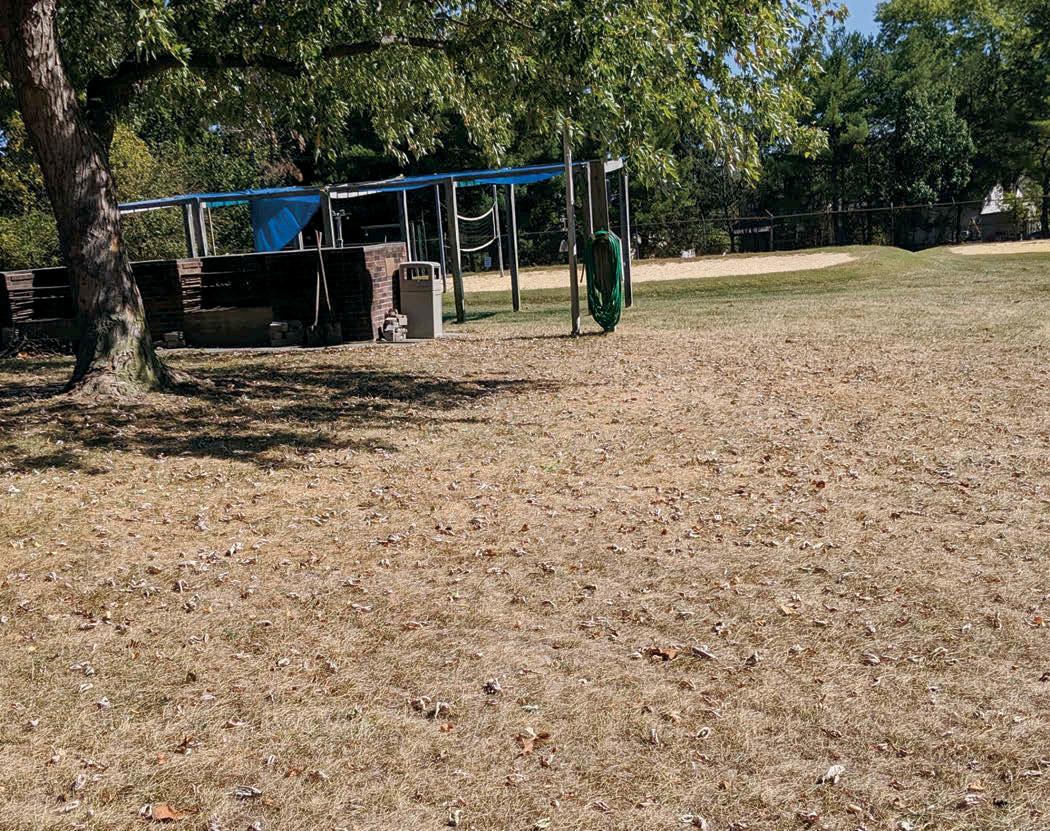
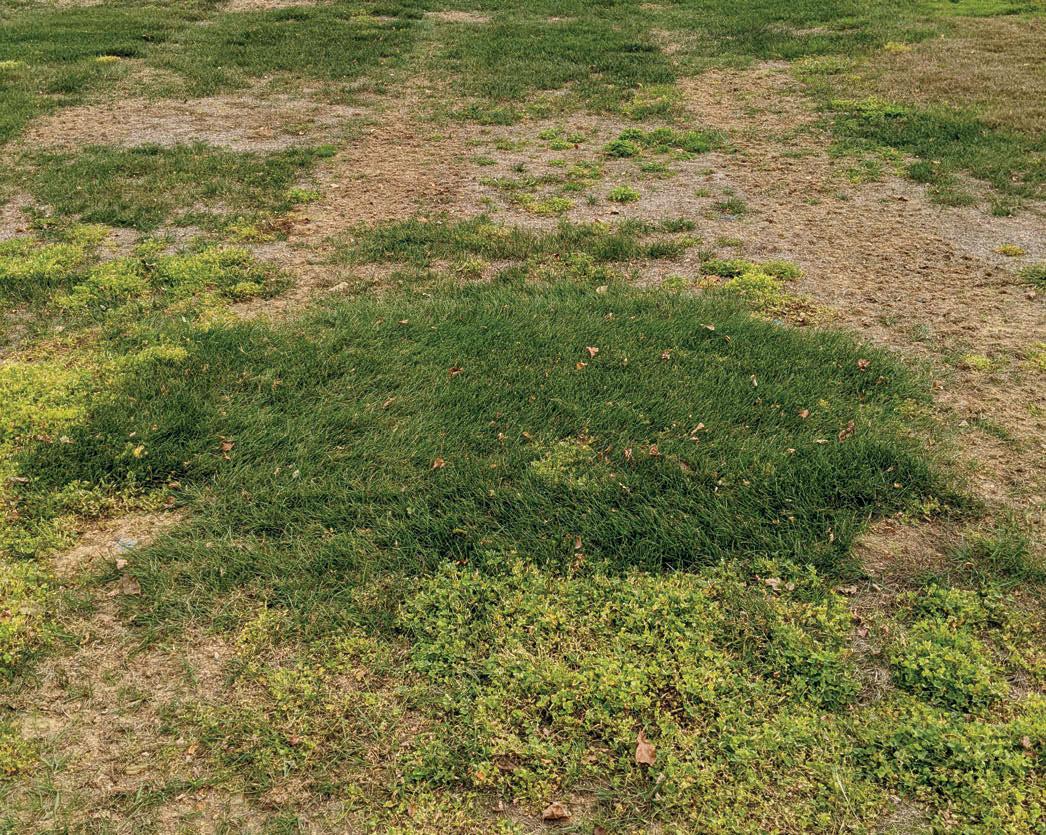
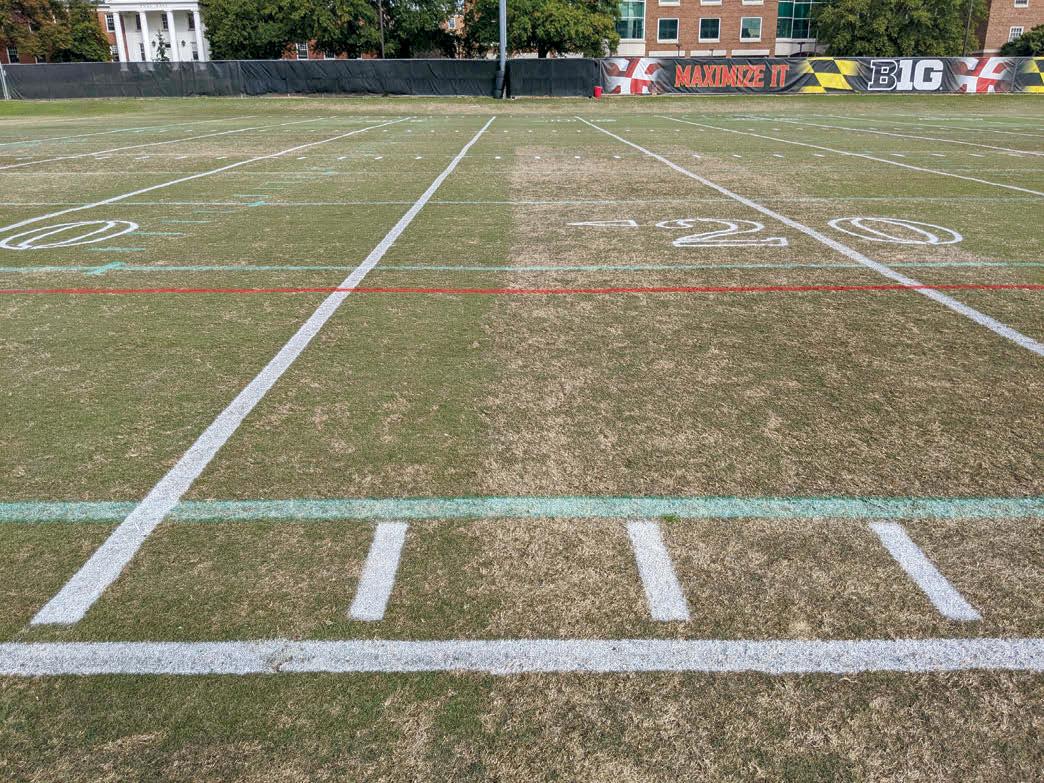
Drought conditions impact all turfgrasses. This photo shows drought stress on a tall fescue lawn in the fall at a park recreation area in Silver Spring, Maryland. at Lexington ranged as high as 423.3 mm (16.6 inches), the highest turf quality ratings did not always correlate with the lowest water use. Dog Tuff had the highest overall turfgrass quality score (6.1), but used 160.7 mm of water, which was significantly more than the best entries, and in the middle of all entries. At Jay, FL, besides TifTuf, zoysias Stellar (8.3 mm) and FAES 1307 (29.7 mm), bermuda entries FB 1628 (29.7 mm), Tahoma 31 (34 mm), and Tifway (46.3 mm), and Prestige buffalograss (55.3 mm) finished in the top statistical group. Curiously, Stellar was one of the least water using entries at Jay, FL, but one of the greatest water users at Lexington, KY, (339 mm). As mentioned above, the Ft. Lauderdale site ran their Approach 2 trial from mid-December 2019 to the end of July 2020 (about 33 weeks). The buffalograss entries did not acclimate to the south Florida climate and died before irrigation treatments could be initiated. Besides the demise of the buffalograss, the surprising result from 2020 was how well the entries performed even at the 30 percent ETo replacement. On most turf quality rating dates, all entries had scores at or above the minimum acceptable quality level of 6 under the 30 percent ETo . This is the only Approach 2 site that saw this result, and while being totally unexpected, may require a rethinking of irrigation requirements for south Florida. Since severely reducing irrigation did not significantly affect these entries, most entries finished in the top statistical group, with Tifway (TQ=7.0), FB 1628 (6.9), Tahoma 31 (6.8), and TifTuf (6.8) as the top four. The Riverside, CA, Approach 2 location, 2,600 miles away and a Mediterranean climate, posted much different results from the subtropical Ft. Lauderdale site. No entry finished with the minimum overall turf quality average of 6.0 under 30 percent ETo replacement. Several entries, however, did maintain acceptable quality for up to nine weeks into the stress period, with only TifTuf posting an acceptable quality rating in week 10. Over the twentyweek drought stress period, FB 1628, TifTuf, Tifway, Tahoma 31, and Dog Tuff had statistically equal overall turf quality averages. At College Station, TX, the entries also performed surprisingly well under the 30 percent ETo level with several finishing at turf quality 6.0+. TifTuf, Tahoma 31, and Tifway bermudagrasses, along with Meyer zoysia, were the only entries in the top statistical group to maintain at least a 6.0 quality score on each rating date across the twenty-week trial period. Similarly, Las Cruces, NM, Approach 2 data showed four entries, TifTuf, FB 1628, Tifway, and Tahoma 31, with a 6.2 or higher average turf quality rating. TifTuf was the only entry to maintain a minimum quality score over seventeen weeks, falling just below 6.0 on the final rating date.
Buffalograss
There has not been sufficient interest to start a new buffalograss trial, therefore, the data that we compiled from 2002-2006 is the most recent we have available. Considering the four years of data from the 2002 trial, cultivar performance depended mainly on geographical location. The vegetative cultivar Density had high quality ratings in the southern locations of Tucson, AZ, Riverside, CA, and Dallas, TX, with lower turfgrass quality ratings, relative to other entries, at more northern locations. Legacy, another vegetative entry, had the highest quality rating at Logan, UT, Manhattan, KS, and Lincoln, NE. Several seeded entries again performed well during the trial period, with Tech Turfgrass 1 and Bowie each performing well at more than one location. In addition, Tech Turfgrass 1, Density, and SWI 2000 were consistently the fastest to establish. A few buffalograss cultivars have been released since our last NTEP trial was initiated, two of those cultivars are from the University of Nebraska. Prestige is a commercially available vegetative cultivar released in 2003. And most recently, the University of Nebraska released the seeded cultivar Sundancer.
Centipedegrass
Centipedegrass performs well in the more acidic, dense soils of the southeast U.S. and does so with probably the least maintenance required of any warmseason species. Curiously though, improved centipedegrass cultivars have been slow to become commercialized. In fact, NTEP has never tested centipedegrass due to the lack of a significant number of cultivars available. Seeded centipedegrass cultivars are dwarfed in the marketplace by common centipede, the major centipedegrass seed sold. One of the few improved cultivars, TifBlair, reportedly more cold-tolerant than other cultivars, has been commercialized within the last several years.
Kevin Morris is executive director of the National Turfgrass Evaluation Program (NTEP). All photos by Kevin Morris unless otherwise noted.


