2026-2030


2026-2030
The Town of Westlock respectfully acknowledges that we live, work, and play on the traditional and ancestral territories of many Indigenous, First Nations, Métis, and Inuit peoples� We acknowledge that what we call Alberta is the traditional and ancestral territory of many peoples, presently subject to Treaties 4, 6, 7, 8 and 10 and Six Regions of the Métis Nation of Alberta� We acknowledge the courageous and resilient community leadership of Indigenous leaders, of all ages� Knowledge Keepers, and Elders who are still with us today and those who have gone before us� We make this acknowledgement as an act of reconciliation, gratitude, and commitment to pursuing an inclusive, collaborative, and respectful path towards building strong communities�
This Comprehensive Economic Development Strategy (CEDS) (Figure 1) has been developed to support the Town of Westlock’s Strategic Priorities (Figure 2) established by Council, with a clear focus on Community Development as the primary priority guiding economic decision-making� Community Development is foundational to Westlock’s long-term success� A strong, resilient community—one that supports local businesses, attracts and retains residents, provides employment opportunities, and offers a high quality of life—is essential to sustaining economic growth and fiscal stability. This Strategy recognizes that economic development and community development are deeply interconnected and must be advanced together�
The CEDS provides a structured, evidence-based framework to:
• Strengthen the local business environment
• Support workforce attraction, development, and retention
• Encourage investment and diversification
• Improve livability and accessibility
• Enhance Westlock’s role as a regional service and employment centre
By aligning economic initiatives with Council’s strategic focus on Community Development, this Strategy ensures that economic growth contributes directly to the well-being of residents, the vitality of neighbourhoods and the downtown, and the long-term sustainability of municipal services and infrastructure�
This document is intended to serve as a practical guide for Council, Administration, and partners to prioritize actions, allocate resources, and collaborate regionally� It is not a static plan, but a living framework that will evolve as conditions change, new opportunities emerge, and progress is measured over time�
FIGURE 1: CEDS Strategic Planning Process and Implementation Roadmap
This figure illustrates the phased approach used to develop and implement the Comprehensive Economic Development Strategy, from initial perception analysis and future scenario exploration to strategy development, roadmap creation, and public launch� The process ensures that the CEDS is evidence-based, community-informed, and action-oriented�
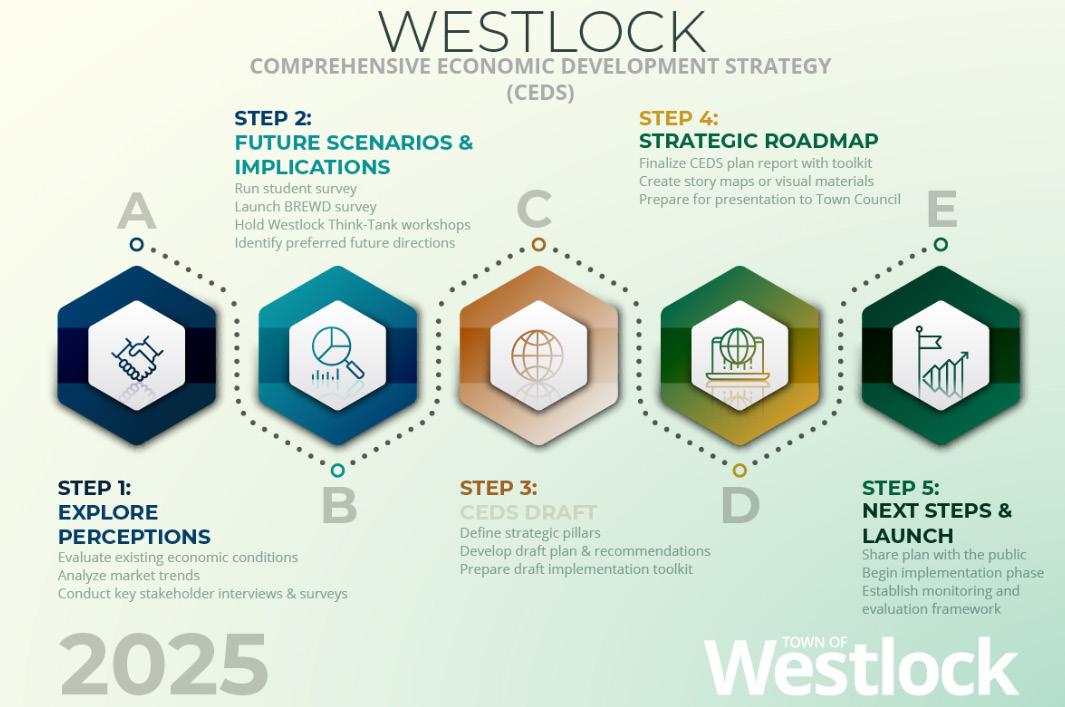
FIGURE 2: Municipal Strategic Priorities (2020–2030)
This figure presents the Town’s strategic priorities and goals, demonstrating how the Comprehensive Economic Development Strategy is aligned with existing municipal direction and long-term community objectives�
GOAL: Westlock is a municipal leader in community resiliency and prosperity.
GOAL: Our reputation for excellence in providing great governance and a commitment to community is widely recognized.
GOAL: The Town of Westlock asset management plan is the foundation of infrastructure investment decision making.
GOAL: Westlock is a Health Service Centre of Excellence.
GOAL: We are a regional destination of choice for recreational amenities and cultural activities.

Westlock is positioned to strengthen its role as a regional service centre by improving business competitiveness, growing and retaining talent, revitalizing its downtown and commerce corridors, and accelerating industry-ready land development� Across the engagement and analysis for the strategy, a consistent message emerged: Westlock maintains strong community assets and our strategic location must move from “good intentions” to a disciplined pipeline of investable projects, measurable outcomes, and coordinated regional partnerships.
The CEDS focuses on mutually reinforcing Strategic Pillars (Figure 3):
1. BUSINESS VITALITY & ECOSYSTEM COMPETITIVENESS: Fostering a vibrant local business environment and reducing barriers for entrepreneurs�
2. WORKFORCE & TALENT PIPELINE DEVELOPMENT: Attracting, developing, and retaining the skilled workforce needed for long-term growth�
3. DOWNTOWN ACCESSIBILITY & COMMERCE CORRIDORS: Revitalizing the downtown core and key commercial corridors to stimulate investment and community pride�
4. ECONOMIC IDENTITY & STORYTELLING: Defining Westlock’s economic brand and promoting its strengths to investors, visitors, and residents�
5. INDUSTRY & INFRASTRUCTURE READINESS: Ensuring land, infrastructure, and policies are in place for industrial and commercial expansion�
6. REGIONAL FUNDING & INVESTMENT POSITIONING: Collaborating regionally to secure funding, align priorities, and present a unified investment case�
7. HOUSING ACCESSIBILITY & ATTAINABILITY: Expanding housing options to support population growth, workforce needs, and quality of life�
The Action Plan is the operational backbone of the strategy. It defines initiatives, sequencing, leads, partners, and performance measures� Action Plan tables are placed directly under each Pillar to make the document a usable implementation tool� By design, the strategy is both a direction-setting document and a practical workplan: it outlines Westlock’s strategic economic priorities for 2026–2030 and connects each priority with concrete actions and accountability� Together, these pillars and actions aim to position Westlock for sustainable economic growth – balancing support for existing businesses with proactive measures to attract new investment, all while enhancing the community’s livability and regional competitiveness�
FIGURE 3: Strategic Pillars of the Comprehensive Economic Development Strategy This figure illustrates the seven interconnected strategic pillars that form the foundation of the Comprehensive Economic Development Strategy�
1
BUSINESS VITALITY & ECOSYSTEM COMPETITIVENESS
3
DOWNTOWN ACCESSIBILITY & COMMERCE CORRIDORS
WORKFORCE & TALENT PIPELINE DEVELOPMENT
2
ECONOMIC IDENTITY & STORY TELLING
4
6REGIONAL FUNDING & INVESTMENT POSITIONING
5 INDUSTRY & INFRASTRUCTURE READINESS
7 HOUSING ACCESSIBILITY & ATTAINABILITY
This page is intentionally left blank.

The development of the Comprehensive Economic Development Strategy (CEDS) was grounded in research, analysis, and broad-based community engagement� Multiple inputs were integrated to ensure the strategy is data-driven, inclusive, and aligned with local and regional priorities�
• SOCIO-ECONOMIC
A detailed socio-economic benchmark was completed to establish a factual baseline for the strategy� This analysis examined demographic trends, population change, labour force characteristics, industry composition, and comparative performance relative to peer communities� The benchmark provided a clear understanding of Westlock’s current economic conditions, emerging trends, and competitive position within the region�
• WESTLOCK
To incorporate youth and future workforce perspectives, a student survey was conducted among high school students in Westlock� The Student Survey provided insight into young residents’ career aspirations, intentions to return to Westlock following education, and perceptions of local employment and lifestyle opportunities. The findings reinforced the importance of strengthening career pathways, housing options, and community amenities to support long-term talent retention�
• ECONOMIC
The Town of Westlock held a facilitated Economic Development Think-Tank involving local business owners, residents, elected officials, and regional partners. Through workshop exercises and roundtable discussions, participants identified key economic challenges, untapped opportunities, and long-term aspirations for the community� The resulting Think-Tank Report captured themes such as downtown revitalization, workforce availability, infrastructure readiness, and regional collaboration, and directly informed the strategy’s strategic priorities�
• STAKEHOLDER
In addition to group-based engagement, targeted stakeholder interviews were conducted with key individuals representing local businesses, major employers, service organizations, and regional partners� These one-on-one discussions provided an opportunity to explore issues in greater depth, validate emerging themes, and capture perspectives that may not surface in larger group settings�
The methodology combined quantitative analysis with qualitative engagement� Statistical data—such as census indicators, assessment trends, and employment by sector—provided evidence to support the SWOT analysis and strategic direction� At the same time, stakeholder knowledge—from business leaders participating in the Think-Tank to youth voices captured through the student survey—ensured the Strategy reflects on-the-ground realities and community aspirations.
In addition, best practices and comparative strategies from other municipalities were reviewed to benchmark Westlock’s approach against current economic development trends� Guidance from organizations such as Economic Developers of Alberta, along with rural economic development toolkits and peer community success stories, informed the selection of practical and proven approaches�
Overall, this strategy was developed through a rigorous, collaborative, and transparent process� It is grounded in local data, informed by community and stakeholder insight, and framed within a regional context. The methodology reflects a commitment to evidence-based planning and shared ownership of the strategy’s direction and outcomes�
This page is intentionally left blank.

The development of Westlock’s Comprehensive Economic Development Strategy (CEDS) followed a structured and phased planning process (Figure 4)� This process combined data analysis, community engagements, and internal validation to ensure the strategy is grounded in evidence, aligned with Council priorities, and reflective of community and regional perspectives.
The project was initiated following Council’s approval of the CEDS framework and objectives� An internal Steering Team was established to guide the process, coordinate inputs, and ensure alignment across departments�
During this phase, key background documents—including Westlock’s 2021–2024 Corporate Business Plan, Municipal Development Plan, Public Art Master Plan, Stormwater Master Plan, Transportation Master Plan, Sanitary Sewer Master Plan, Water Master Plan, and Westlock Region Vital Signs 2024 Report—were reviewed to ensure consistency with existing municipal & regional goals and policy direction�
Initial economic indicators, such as population trends, tax assessment composition, and employment patterns were compiled to establish context and frame subsequent discussions�
A comprehensive engagement program was undertaken to capture a wide range of perspectives from across the community and region�
In Fall 2025, the Town hosted an Economic Development Think-Tank, bringing together approximately 30 participants� Through facilitated workshop, SWOT exercises, and visioning discussions, participants identified economic challenges, opportunities, and long-term aspirations for Westlock�
To complement group engagement, targeted stakeholder interviews (35) were conducted with key business owners, employers, service organizations, and regional partners� These one-on-one discussions allowed for deeper exploration of issues such as business competitiveness, workforce availability, infrastructure readiness, investment barriers, and opportunities for regional collaboration� Insights from the interviews helped validate and refine themes emerging from the Think-Tank and ensured specific perspectives were captured�
In parallel, a Student Survey was distributed in local high schools, generating responses from over 100 students� The survey provided insight into youth intentions to remain in or return to Westlock, as well as the economic and community factors influencing those decisions, including job availability, education pathways, housing, and amenities�
Town Council and Administration were also engaged through interviews and working sessions, ensuring that both political priorities and operational realities informed the Strategy�
Information collected through data analysis, stakeholder engagements, interviews, and surveys was synthesized into a comprehensive SWOT Analysis (Strengths, Weaknesses, Opportunities, Threats)�
Socio-economic data and engagement feedback were reviewed together to identify recurring themes� For example, strong agricultural roots, regional service functions, and strategic location emerged as key strengths, while youth out-migration, housing gaps, and aging infrastructure were identified as challenges� Opportunities such as value-added agri-processing, regional collaboration, and downtown revitalization were assessed alongside external threats, including competition from larger centres and broader economic uncertainty.
The Socio-Economic Benchmark Report played a key role in this phase, highlighting trends such as modest population growth, changes in sectoral employment, and shifting workforce demographics� Findings from the Think-Tank, stakeholder interviews, and student survey—such as the desire for a more vibrant downtown and improved housing options—were intentionally reflected in the SWOT assessment�
Building on the SWOT analysis and engagement findings, the planning team identified seven (7) Strategic Pillars to anchor the strategy� These pillars represent the primary focus areas where coordinated action can have the greatest impact on Westlock’s economic resilience and growth� Draft pillars were reviewed internally by Town Administration� Each pillar was intentionally defined at a strategic level—broad enough to encompass multiple initiatives, yet specific to Westlock’s unique context. Prioritization criteria, including potential economic impact, urgency, and feasibility within municipal capacity, were applied to confirm focus areas�
This step ensured that the strategy balances ambition with realism and reflects best practices in municipal strategic planning.
For each Strategic Pillar, goals, objectives, and actions were developed to translate strategy into implementation. Town staff collaborated across departments to identify initiatives that align with municipal capacity and available resources�
Actions were structured to be clear and measurable, with identified leads, partners, timelines, and key performance indicators� External examples and best practices were considered during this phase� The draft Action Plan was reviewed internally to ensure alignment with budgets, staffing capacity, and Council priorities.
A draft CEDS document was prepared, integrating all major components, including the Executive Summary, SWOT Analysis, Strategic Pillars, and Action Plan. The draft underwent internal review, with feedback from Senior Management�
Attention was given to maintaining a clear, professional tone suitable for both Council and public audiences� Visual placeholders were included to support future design elements such as summary infographics, maps, and performance dashboards�g ounding municipalities and regional partners�
FIGURE 4: Strategic Planning Process Overview
This figure illustrates the structured process used to develop the Comprehensive Economic Development Strategy, showing how data analysis, stakeholder engagement, and strategic prioritization were integrated to inform decision-making and pillar development�
2 STAKEHOLDER ENGAGEMENT
1 LAUNCH & CONTEXT SETTING
3 ANALYSIS & SWOT DEVELOPMENT
4 STRATEGIC PILLAR IDENTIFICATION
6 DOCUMENTATION AND REVIEW
5 ACTION PLAN FORMULATION
Regional collaboration was a guiding principle throughout the Strategic Planning Process� Westlock recognizes that its economic future is closely linked to surrounding municipalities and regional partners�


The following SWOT Analysis summarizes Westlock’s internal strengths and weaknesses, as well as external opportunities and threats facing the community’s economic development�
• Strategic Location and Transportation: Westlock is situated at the crossroads of major transport routes (Highways 18 and 44) and a CN Rail line, making it a natural hub between Edmonton (85 km to the south) and northern Alberta communities� This location provides access to broader markets and supply chains�
• Regional Service Centre Role: The Town functions as a service and trade centre for a rural catchment of over 15,000 people. It offers retail, healthcare (an active hospital and medical services), education (K-12 schools), and recreational amenities that draw people from surrounding areas� This critical mass of services anchors local employment and consumer spending�
• Agriculture and Agri-business Base: Westlock’s economy benefits from a rich agricultural hinterland. There is significant grain and oilseed production, livestock operations, and agri-services in the region, which support related businesses (farm equipment sales, crop services, seed processing)� This agri-base provides raw inputs and partnership opportunities for value-added ventures�
• Energy and Industrial Expertise: The area has a presence of energy and industrial services companies supporting Alberta’s oil and gas sector. A skilled trades workforce (welders, mechanics, technicians) and fabrication shops are part of the local economy, reflecting an industrial services competency� These skills can potentially pivot into emerging industries as opportunities arise�
• Affordable Lifestyle and Community Amenities: Westlock offers a high quality of life with a small-town feel. Housing costs are generally lower than urban centres, and the community is known for being safe and friendly� Residents enjoy recreational facilities like the Westlock Rotary Spirit Centre and Aquatic Centre, well-maintained parks, and active community groups� Such amenities, along with excellent healthcare and schools, make the town attractive for families and retirees�
• Local Government Support for Development: The Town’s leadership is pro-development and fiscally prudent. Council has demonstrated willingness to invest in infrastructure and to streamline processes�
FIGURE 5: Community Strengths and Competitive Advantages
This figure highlights the community’s core strengths that underpin the Comprehensive Economic Development Strategy, including its strategic location, role as a regional centre, strong agricultural base, and overall affordability� These strengths form the foundation for economic growth, investment attraction, and long-term competitiveness�
AGRICULTURE HUB
AFFORDABILITY
• Stagnant Population Growth and Demographics: Westlock’s population has grown slowly (approximately 1% annually in recent years, reaching ~5,240 in 2024). The town faces an aging demographic profile – a significant portion of residents are seniors, while many youth leave for education or jobs and do not return immediately. A limited inflow of young families and newcomers can constrain labour force growth and entrepreneurial activity�
• Limited Housing Diversity: Westlock has a short supply of certain housing types (e�g� rental apartments, townhomes, senior-friendly units). This lack of diverse and affordable housing options makes it difficult for newcomers, young professionals, and lower-income families to settle in town. It also poses a workforce challenge when prospective employees cannot find suitable housing.
• Commerce Vacancy and Aesthetic Decline: The downtown core and commerce corridors, while historically vibrant, have seen some commercial vacancies and some buildings in need of facade or accessibility upgrades� Stakeholders in the think-tank noted that the downtown doesn’t fully project the community’s confidence and potential. A few empty storefronts and limited nightlife or shopping hours reduce foot traffic, creating a cycle that further challenges downtown businesses.
• Gaps in Business Retention & Expansion (BRE) Efforts: Prior to this strategy, Westlock did not have a formal BRE program� Business visits and issue tracking were ad-hoc� This meant emerging problems (e�g� a major employer considering relocation, or a local shop struggling with red tape) might not be systematically identified or addressed. The lack of structured business engagement is a weakness in sustaining and growing the existing business base�
• Labour Force Constraints: Employers report difficulties filling certain skilled positions (tradespeople, healthcare professionals, technicians)� The local labour pool is relatively small, and there is competition for talent with larger centres like Edmonton� Youth outmigration exacerbates this, as many young people do not see local career opportunities and leave, resulting in a brain drain�
• Perception and Identity Challenges: Westlock has not clearly defined or marketed its unique economic identity. For external investors or visitors, the town’s strengths (beyond agriculture) may not be obvious� The lack of a strong brand or signature event means Westlock can be overlooked in a competitive regional landscape where other communities actively promote themselves� This weakness in storytelling results in missed opportunities to attract business and tourism�
FIGURE 6: Community Weaknesses and Structural Challenges
This figure highlights the key weaknesses and structural challenges identified through data analysis, stakeholder engagement, and community input� These include population stagnation, housing constraints, commercial vacancy, and workforce limitations, which collectively impact economic growth, business vitality, and long-term competitiveness�
• Agri-Value and Agri-Tech Development: Building on the strong farming community, there is opportunity to attract or grow agriprocessing facilities – for example, grain milling, food manufacturing, or ag-tech companies� Consumer and export demand for food products (e�g� plant proteins, organics) is rising, and Westlock’s proximity to primary producers is a selling point� The region’s agrivalue chain can be strengthened by adding processing and packaging enterprises, creating local jobs and reducing the need to ship raw commodities out�
• Forestry and Biomass Utilization: The broader area includes forested zones and wood product residuals that are not yet fully utilized� There is potential for forestry-related ventures, such as a small-scale lumber mill, wood pellet production, or biomass energy generation, if supply chain conditions permit� Exploring these could diversify the economy� Similarly, bio-industrial projects (using agricultural and forestry biomass for products like biofuels or biodegradable materials) present an innovative opportunity aligned with green economy trends�
• Energy Transition and Clean Tech: Alberta’s energy sector is evolving with investments in renewable energy (solar, wind) and technologies like hydrogen and carbon capture� Westlock can leverage its energy services expertise to attract clean energy projects or related manufacturing� For instance, the area’s ample land and grid access make it feasible to host a solar farm or battery storage project� Local companies servicing oil and gas could pivot to new opportunities in the clean tech supply chain (fabricating components for solar/wind or providing environmental services)� Government funding for energy transition projects could be tapped by a wellpositioned community project�
• Transportation and Logistics Hub: Westlock’s location as a logistics node between larger markets (Edmonton to the south, the Peace Country to the northwest) remains underdeveloped� With CN Rail and highway access, the Town could attract distribution centres, trucking firms, or warehousing operations that need a midpoint hub. Additionally, the Westlock Airport and proximity to Edmonton International Airport’s cargo network create opportunities for niche logistics or training services� Growing e-commerce and supply chain reorganization trends (post-pandemic) may favour secondary hubs like Westlock for last-mile distribution in northern Alberta�
• Regional Tourism and Niche Events: While not a traditional tourism hotspot, Westlock can capitalize on niche tourism opportunities� The region’s agricultural heritage and open landscapes lend themselves to agri-tourism experiences (farmers’ markets, farm stays, corn mazes) and outdoor recreation (camping, hunting, snowmobiling trails, skiing, snowboarding)� The Town’s annual fairs, nearby cultural attractions (such as the Canadian Tractor Museum), and sports facilities could be packaged to draw visitors from the region and Edmonton. Developing a dedicated tourism marketing effort – potentially in partnership with Westlock County – is an opportunity to increase visitor spending�
• Collaboration and Regional Initiatives: There is a strong opportunity to pursue regional economic development initiatives through Westlock Economic Region� By collaborating with Westlock County, the Village of Clyde, and Indigenous partners (e�g� Alexander First Nation), Westlock can access larger-scale funding and create a unified voice for advocacy. Joint projects (such as regional business parks, shared marketing campaigns, or workforce programs) can achieve economies of scale� For example, a regional approach to lobbying for highway upgrades or broadband improvements has a greater chance of success than if Westlock acts alone�
• Provincial and Federal Funding Streams: Significant external funding programs are available that align with Westlock’s needs –and represent a major opportunity� The Town’s successful application to the federal Housing Accelerator Fund (HAF) is one example, bringing in resources for housing initiatives. Looking ahead, Alberta’s economic diversification grants, Canada’s infrastructure funds, and rural development programs can be leveraged to support many actions in the CEDS (downtown revitalization, workforce training, green projects, etc�)� By maintaining readiness (business cases, “shovel-ready” plans) and a proactive grant strategy, Westlock can secure outside investment to fuel local priorities�
FIGURE 7: Community Opportunities and Growth Potential This figure highlights the key opportunities identified through data analysis, stakeholder engagement, and regional context assessment. These opportunities span agriculture and agri-tech, emerging industries, commercial growth, and workforce development, informing strategic initiatives that support diversification, innovation, and long-term economic growth.
• Competition from Urban Centres: Westlock faces ongoing competition from larger urban centres (especially Edmonton and St� Albert) and even nearby mid-sized towns for both businesses and residents� Retail leakage is a concern – many residents drive to Edmonton or St� Albert for major shopping, which threatens local merchants� Similarly, industrial prospects often gravitate to bigger centres with larger industrial parks or to the Edmonton Metro Region which actively markets itself. If Westlock cannot differentiate its value proposition, this competitive pressure could slow local growth�
• Youth Out-Migration and Aging Population: As noted, a steady outflow of young adults seeking education and careers elsewhere is a structural threat� If not addressed, Westlock’s workforce will age and shrink, resulting in labour shortages for employers and less entrepreneurial dynamism� An older population also shifts service needs and could strain healthcare or seniors’ services while reducing the local consumer spending on certain businesses� Without new families moving in, school enrollments may decline, which in turn could impact local school resources – creating a vicious cycle that makes the town less attractive for young families considering relocation�
• Commodity Dependence and Market Fluctuations: Westlock’s economy, given its agricultural and energy ties, is exposed to global commodity cycles� Droughts or low crop prices directly hit farm incomes and related agri-businesses; similarly, downturns in oil and gas can reduce activity for local service companies. These market fluctuations are beyond local control but pose a threat to economic stability� Prolonged low prices or adverse trade conditions (e�g� export bans on certain crops) could lead to business closures or reduced spending in the community�
• Infrastructure Gaps and Deferred Investments: If critical infrastructure projects are delayed or not realized, it threatens Westlock’s readiness for growth. For example, insufficient servicing of industrial land or delays in upgrading transportation links could cause potential investors to choose other locations� Aging municipal infrastructure (roads, water/sewer lines) without timely rehabilitation can also deter investment and increase long-term costs for the Town� Maintaining and expanding infrastructure in pace with development is an ongoing challenge, especially under tight municipal budgets�
• Policy and Regulatory Changes: Changes in government policies at the provincial or federal level can introduce threats� For instance, shifts in taxation (like carbon taxes or assessment model changes for industries), new environmental regulations, or alterations to grants can all impact Westlock’s economic prospects� If the Province centralizes certain services or if healthcare/ education funding to rural areas diminishes, that could affect Westlock’s appeal as a regional hub.
• Global Pandemics or Economic Crises: As witnessed with the COVID-19 pandemic, global events can have severe local economic impacts. Small businesses in Westlock are vulnerable to shocks such as pandemics (which reduce foot traffic and disrupt supply chains) or recessions (which lower commodity prices and consumer spending). A lack of diversification can amplify these threats. While such events are unpredictable, the threat exists and underlines the need for building local economic resilience (through diversification, digital infrastructure, and emergency planning).
FIGURE 8: Community Threats and External Risks
This figure highlights the key external threats and risk factors that could impact the community’s economic development trajectory, including competition from larger centres, population shifts, infrastructure constraints, and policy uncertainty� These threats inform risk-aware planning and mitigation strategies within the Comprehensive Economic Development Strategy�
Westlock’s SWOT analysis reveals a community with strong foundations – location, community spirit, and sector strengths –facing internal challenges of growth and identity yet presented with promising opportunities in value-added sectors and regional cooperation� The threats highlight why a proactive strategy is needed: to counter demographic and competitive pressures and to ensure Westlock is adaptable in a changing economic landscape� This SWOT insight directly shaped the strategic priorities and actions in the next sections�

1
2
BUSINESS VITALITY & ECOSYSTEM COMPETITIVENESS WORKFORCE & TALENT PIPELINE DEVELOPMENT
3
DOWNTOWN ACCESSIBILITY & COMMERCE CORRIDORS
ECONOMIC IDENTITY & STORY TELLING
4
6REGIONAL FUNDING & INVESTMENT POSITIONING
5 INDUSTRY & INFRASTRUCTURE READINESS
7 HOUSING ACCESSIBILITY & ATTAINABILITY
Westlock’s fastest path to growing the tax base is by helping existing businesses expand and by lowering the barriers for new ventures (Table 1). Pillar 1: Business Vitality & Ecosystem Competitiveness centres on creating a thriving local business environment� This means shifting the Town toward a continuous “business intelligence and response” model – one where we listen to business needs systematically, solve problems quickly, and make it easy to start and grow enterprises� A strong local business ecosystem (Figure 9) also serves as the foundation for future investment attraction, as investors are more likely to locate in communities with responsive processes, predictable approvals, and visible business success stories� Currently, many businesses appreciate Westlock’s small-town advantages but encounter friction in processes or lack information on available supports� By adopting a proactive BRE (Business Retention and Expansion) approach, encapsulated in a new, formal BREWD program (Business Retention, Expansion & Workforce Development), the Town will regularly engage with businesses to identify issues and respond in a coordinated way�
Retaining an existing business or enabling its expansion is often more efficient than recruiting a new one from scratch. A single saved business or an expansion that adds jobs has multiplier effects throughout the community (more local spending, sustained services, etc�)� Moreover, a reputation for being “business-friendly” can become Westlock’s competitive edge in the region. This pillar addresses several internal gaps identified earlier – such as the lack of formal business outreach and the need to streamline municipal processes – and turns them into strengths�
By 2030, the intended impact is that Westlock will have a robust cycle of business engagement (annual visits, surveys, and forums), improved approval processes, and more local businesses choosing to reinvest or expand because they feel supported�
• Establish a continuous BREWD program as the Town’s primary business intelligence engine, yielding real-time data on business needs and regular trend reports�
• Increase the number of local firms planning expansions and boost measurable local B2B procurement (more businesses buying goods/services from each other, keeping dollars local)�
• Improve business satisfaction with Town processes – evidenced by more positive feedback on permitting, customer service, and municipal communication�
• Achieve better business succession results (see more local enterprises smoothly transition to new owners instead of closing down when owners retire)�
• BREWD as a core operating system: Integrate Business Retention & Expansion (including workforce development queries) into routine operations – meaning Town staff regularly visit businesses, log issues, and follow up with solutions, culminating in a BREWD findings report.
• Entrepreneurship and innovation supports: Offer tools and connections that match Westlock’s scale – from home-based businesses to small and mid-size firms – such as business incubator resources, workshops, or partnerships with Community Futures for mentoring micro-enterprises�
• Business-friendly policies and one-stop service: Continuously review and streamline bylaws, permitting processes, and create a “single window” concierge for investors so navigating regulations is straightforward� A clear customer service charter with set timelines will be implemented�
• Succession planning and mentorship: Work with organizations (Chamber of Commerce, etc�) to help aging business owners connect with potential buyers or mentees, aiming to retain businesses through ownership changes rather than see them wind down�
• Sector-based collaboration: Encourage businesses in key sectors (retail, trades, agriculture services, etc�) to form informal networks or roundtables to share challenges and jointly develop solutions (for instance, coordinating store hours or joint marketing among downtown retailers)�
• Investment readiness through local business success: Position Westlock’s business-friendly environment, streamlined processes, and local success stories as part of the Town’s investment narrative� Use insights from BREWD, development activity, and business expansions to support investor conversations and demonstrate market confidence.
Westlock’s business community will be more engaged and confident. The Town will be seen as a reliable partner that “has the back” of local entrepreneurs� Quantitatively, we will see increases in business license renewals (fewer closures), higher local investment (more building permits for commercial/industrial improvements), and positive survey results – for example, by 2030, a strong majority of businesses would recommend Westlock as a place to do business� Qualitatively, success is a culture shift: issues are identified early and solved collaboratively, and a buzz develops that Westlock is a great place to start and grow a business because “things get done” efficiently here.
FIGURE 9: The Six-Step Journey of Business Ecosystem Design
This figure illustrates the structured framework guiding Pillar 1, outlining how the Town identifies key challenges, engages stakeholders, establishes governance, and designs a business ecosystem that is responsive, scalable, and supportive of long-term business vitality�
6.How can you ensure the evolvability of your ecosystem?
• How can you scale the ecosystem?
• How can you defend the ecosystem?
• How can you expand the ecosystem?
• How can you protect against backlash?
5.How can you solve the chicken-or-egg problem?
• What does it take to achieve critical mass?
• What is the minimum viable ecosystem?
• Which side of the market should you focus on?


1.What is the problem that you want to solve?
• Is the problem big enough?
• Is an ecosystem the right choice?
• What kind of ecosystem do you need?
4.How can you capture the value of your ecosystem?
• What should you charge?
• Whom should you charge?

2.Who needs to be part of your ecosystem?
• What are the players and roles?
• Who should be the orchestrator?
• How can the orchestrator motivate the other players?


3.What should be the initial governance model of your ecosystem?
• How open should the ecosystem be?
• What should the orchestrator control?
This table outlines Pillar 1 and its overarching objective: to foster a thriving local business ecosystem through responsive municipal support, streamlined processes, and the reduction of regulatory and operational barriers for businesses at all stages of growth�
Objective Action (Initiative)
1.1: Proactively engage and retain local businesses (BRE program)
Launch BREWD program – Implement a structured Business Retention, Expansion & Workforce Development program. Conduct regular business visitations and surveys to gather intelligence on issues (workforce gaps, expansion plans, challenges) and produce trend reports.
Create a Business Response Team (rapid issue resolution) – Establish a cross-departmental task force (e.g. CAO and Directors) that meets regularly to triage and resolve high-impact business issues. This “SWAT team” ensures that when a business raises a red flag, the Town responds quickly and in a coordinated way.
Economic Development
Economic Development, CAO & Directors
Planning & Development; Community Services; Corporate Services Short
Coverage: # of business visits per year, covering top employers and a cross-section of sectors.
Issues Logged & Resolved: % of identified issues addressed or escalated.
BREWD Report: BREWD trends report published and shared with Council/business community.
Resolution Speed: Average time to resolve or provide plan for business-raised issues.
Economic Development; Planning; Operations Short
1.2: Streamline processes and provide onestop service for new and expanding businesses.
Single-window investor concierge & service standards – Designate an “investment concierge” to guide investors and entrepreneurs through approvals. Publish clear development timelines, checklists, and points of contact for common business processes. Offer pre-application meetings for complex projects to clarify requirements early.
Formalize a “Business Friendly” policy review – Conduct periodic reviews of bylaws and policies affecting business (e.g. signage rules, parking requirements, home-business regulations) in cooperation with the Chamber of Commerce. Identify and amend rules that create unnecessary burdens (“red tape reduction”).
Planning & Development
Economic Development
Short
Escalation Count: # of major issues escalated to Response Team and resolved (track qualitatively to ensure responsiveness).
Business Feedback: Positive feedback from businesses on the Town’s responsiveness (via survey or testimonials).
Service Standards: Publication of permit/process timelines.
Pre-application Uptake: # of pre-application meetings held.
Timeline Metrics: Track actual permitting timelines vs. standards.
Planning & Development
Economic Development; Chamber of Commerce; Council
Medium
Red Tape Reductions: # of bylaw/policy amendments made to simplify business processes.
Business Perception: Improvement in survey rating of “municipal regulations are business-friendly” (baseline to future survey).
This table outlines Pillar 1 and its overarching objective: to foster a thriving local business ecosystem through responsive municipal support, streamlined processes, and the reduction of regulatory and operational barriers for businesses at all stages of growth�
1.3: Support small business growth and entrepreneurship.
Small Business Growth Toolkit – Develop a toolkit of resources for entrepreneurs and small businesses. Include a local procurement directory (to encourage B2B purchases within Westlock), a calendar of training/networking events, template documents (e.g. lease agreement, cash flow spreadsheet) and a referral list to service providers (Community Futures, accountants, lenders). Launch the toolkit online and through the Chamber of Commerce.
Entrepreneur Mentorship & Succession Program – Partner with Community Futures or a similar agency to facilitate a mentorship program matching new entrepreneurs with experienced business owners/retirees. Additionally, set up a “succession forum” to connect owners looking to sell with potential buyers (could be an annual event or an online listing service).
Economic Development
1.4:
Leverage BREWD insights, local business expansions, and development approvals to support proactive investment conversations.
Develop a small set of “investment-ready” materials (e.g., business success snapshots, approval timelines, available sites summary) that demonstrate Westlock’s ease of doing business and readiness for new investment.
Economic Development
Community Futures; Chamber of Commerce; Westlock Economic Region
Community Futures; Local business mentors; Chamber of Commerce
Short
Toolkit Utilization: # of toolkit downloads or physical distributions.
Workshop Attendance: Attendance at local business workshops or info sessions.
Business Survival Rate: Track 5-year survival rate of new businesses.
Medium
Economic Development Planning & Development; Westlock Economic Region Short
Mentorship Matches: # of mentor-mentee matches made.
Succession Outcomes: # of businesses retained via ownership transition instead of closure.
Participant Satisfaction: Feedback from participants indicating the program’s value (survey mentors/ mentees).
Investment Inquiries: # of investor or site selector inquiries supported annually.
Readiness Materials: Completion of core investmentreadiness materials (success stories, timelines, site summaries).
Lead Conversion: # of investment leads advanced to active discussions or site visits.
Process Confidence: Investor feedback indicating clarity and predictability of development processes.
A strong business ecosystem cannot outgrow its labour force (Figure 10)� Pillar 2: Workforce & Talent Pipeline Development addresses the critical need to attract and develop people� Westlock’s long-term competitiveness hinges on retaining youth, bringing in working-age families, and aligning education/training with employer needs� At present, many local employers struggle to fill skilled positions, and the community exports a significant number of its young people who leave for post-secondary education or urban opportunities� This pillar integrates workforce development directly into economic development – recognizing that without the right people, investments and businesses cannot flourish.
The regional context reinforces this priority: like many rural Alberta communities, Westlock faces a shrinking labour pool as baby boomers retire and fewer young workers replace them� Meanwhile, emerging industries (agri-value, tech, healthcare) require new skills that local labour may not yet have� By focusing on talent, Westlock can turn a potential crisis (labour shortage) into an opportunity (attracting new residents and enabling growth)� Initiatives under this pillar aim to build a “talent pipeline” from early education to employment� This involves collaborating with schools, training providers, and employers to ensure local youth see viable career paths in Westlock’s economy, and that those paths exist�
The intended economic impact by 2030 is significant: Westlock becomes known as a community where skilled workers are available and where young people can build a future� Success will mean employers reporting improved ability to hire locally, an uptick in the town’s population of 20–40-year-olds (indicating better retention/attraction), and a stronger culture of continuous learning and skills development� It also means tapping into newcomer attraction – making Westlock a welcoming option for immigrants or families relocating from more crowded or expensive regions, drawn by jobs and quality of life�
• Integrate workforce intelligence into the BREWD program, so the Town continuously tracks skills shortages, training needs, and wage trends in real time, feeding this data into planning�
• Increase youth retention and “return rate” – e�g� more graduates either staying for local jobs or returning after post-secondary education�
• Attract and integrate newcomers (from other regions or countries) to fill key roles. Measure this by growth in new residents of prime working age and successful settlement (housing, community involvement)�
• Expand local participation in work-integrated learning: more students in co-ops, internships, and apprenticeships with Westlock employers, creating a pipeline from school to work�
• Education–Industry Alignment: Strengthen partnerships between schools (and any nearby colleges) and local employers� Ensure curriculum enhancements or programs (like dual credit courses, vocational training in high school) match industries present in Westlock – trades, healthcare, agriculture, etc�
• Youth Career Awareness and “Stay/Return” Strategies: Implement initiatives to expose local youth to career opportunities in the region� This could involve career fairs, showcasing local entrepreneurs, or “reverse job-shadow” where professionals speak in schools� Create a narrative that students don’t have to move away to have a fulfilling career.
• Targeted Talent Attraction: Focus external recruitment on roles Westlock needs most – e�g� tradespeople in construction or mechanics, healthcare workers, teachers, or specific technical roles in any new industries. Develop marketing that highlights Westlock’s benefits (good jobs plus affordable, family-friendly living) to entice candidates from urban areas or abroad.
• Newcomer Integration Supports (Regional Approach): Work with regional agencies to support immigrants and new residents – language training, community orientation, and credential recognition� A welcoming community network can greatly increase newcomer retention�
• Quality-of-Life as a Talent Tool: Leverage quality-of-life improvements to attract and keep talent� For example, ensure there are amenities and social spaces that young people and families desire (such as upgraded parks, broadband connectivity for remote work, arts/cultural events)� Essentially, make Westlock a place where people want to live, not just work�
By 2030, Westlock will experience a rejuvenation of its workforce� You’ll see more young professionals around town – perhaps a growth in the number of new young families buying homes, and an increase in school enrollments as an indirect indicator� Employers will be partners in training; for instance, a local manufacturing shop might regularly host an apprentice from the high school’s trades program� A successful outcome would be hearing local businesses say, “We found the skilled people we needed, right here,” which would be a marked change from the present� Additionally, Westlock’s reputation will extend beyond its borders as a community that invests in people – which can itself attract businesses who know that moving here means a supportive environment for workforce development� Quantitatively, success can be tracked via stats like the labour force participation rate (increase), net migration figures (positive in the 20–39 age cohort), and employer surveys showing improved ratings for workforce availability� Importantly, the community mindset will shift to celebrating education and skills – with events like trade fairs or student showcases becoming annual highlights, reinforcing that Westlock is cultivating talent for the future�
FIGURE 10: Workforce and Talent Ecosystem Framework
This figure illustrates the integrated approach under Pillar 2, highlighting how continuous data collection, attraction, retention, and skills development function together as a connected workforce ecosystem� The framework supports evidence based decision-making, strengthens employer–talent connections, and ensures workforce initiatives are responsive to local labour market needs�

1. CONTINUOUS DATA COLLECTION
• Continuous employer outreach and consultations
• Open call employer survey results
• Digital data collected from online surveys
• Survey data collected via partner organizations
3. RETENTION
• Connections facilitated between job seekers and employers
• Connections facilitated between education partners, newcomers, and employers
• Clients connected through FCSS
• Students placed in co-op opportunities with employers
1
2
3
4
2. ATTRACTION
• Community outreach events
• Partnership connections made with community organizations
• Supporting initiatives for under-represented populations
• Participants involved in community dialogues
• Inclusion and diversity training sessions
• Cultural events supported
This table outlines the key actions under Pillar 2, organized around continuous data collection, talent attraction, retention, and skills development� The actions focus on aligning workforce initiatives with employer needs, strengthening partnerships, and supporting a resilient and inclusive labour market�
2.1: Integrate workforce monitoring into business outreach.
Embed workforce questions in BREWD
– Expand the BREWD business visitation surveys to include standardized questions on workforce (e.g. what positions are hard to fill, skills gaps, upcoming retirements, wage expectations, housing needs for employees). Track this data to inform training and attraction efforts.
Westlock Talent Table (employer roundtable) – Establish a roundtable sessions where major employers and small business reps convene to discuss workforce challenges and coordinate solutions. Use it to connect employers with training providers (e.g. Northern Lakes College or NAIT outreach) and to plan joint hiring or job fair events.
Economic Development Community Services; Local employers Short
Business Coverage: % of BRE visits that include workforce data.
Workforce Data Updates: Update reports on top 5 in-demand occupations or skill gaps.
Policy Use: Evidence that this data influences initiatives (e.g. new training program launched in response).
Economic Development
Major employers; School Division; Regional training providers; Westlock County Short
Engagement: # of employers participating.
Actions Arising: Joint initiatives launched from Talent Table
Participant Feedback: Employers report the roundtable is useful (via feedback survey).
This table outlines the key actions under Pillar 2, organized around continuous data collection, talent attraction, retention, and skills development� The actions focus on aligning workforce initiatives with employer needs, strengthening partnerships, and supporting a resilient and inclusive labour market�
2.2: Increase youth awareness of local careers and improve retention.
Implement ongoing activities to expose youth to local careers. For example, organize annual Career Days where local businesses and industries showcase jobs at the high school. Develop “Day in the Life” video profiles of young professionals in Westlock and share on social media. Facilitate workplace tours or summer student placements with local employers. The program’s goal is to show students the viable futures they can have in Westlock
Work with regional educational institutions (school division, trade schools, colleges) to formalize co-op, internship, and apprenticeship pipelines. For example, secure agreements with a nearby college or trades institute to place their students in Westlock businesses for internships. Encourage local employers to register as apprenticeship sponsors. Possibly create a local incentive or recognition for businesses that take on interns/apprentices
Community Services
Westlock Schools; Economic Development; Local businesses; Chamber of Commerce
Economic Development School Division; Alberta Apprenticeship Board; Local employers
Short
Medium
Student Reach: % of high school students participating in at least one career event annually.
Awareness Shift: Improvement in student survey results regarding knowledge of local opportunities (baseline vs. follow-up survey in 2-3 years).
Placement Count: # of students getting summer jobs or coops locally (target: increase year-over-year).
Apprenticeships: Increase in # of active apprentices in Westlock.
Internships/Co-ops: # of internship placements facilitated per year.
Retention Post-Placement: Track how many of these interns/apprentices are hired on full-time in the community.
Table 2: Pillar 2 – Workforce & Talent Pipeline Development (III)
This table outlines the key actions under Pillar 2, organized around continuous data collection, talent attraction, retention, and skills development� The actions focus on aligning workforce initiatives with employer needs, strengthening partnerships, and supporting a resilient and inclusive labour market�
2.3: Attract new workers and families to fill skill gaps.
Targeted Talent Attraction Campaign
– Develop a marketing campaign focusing on priority occupations (e.g. journeyman mechanics, nurses, teachers, or other highneed roles). Use success stories (“Why I chose Westlock”) featuring individuals who moved to Westlock for work. Partner with Realtors and the local housing initiative to package information on jobs and housing availability. Advertise on platforms and job fairs likely to reach those target professionals (including immigrants with needed skills).
Newcomer Attraction & Integration Program – Coordinate a regional approach to attract and retain newcomers (including immigrants). Work with agencies to provide settlement support: e.g. welcome packages, English language training referrals, and community “hosts” to introduce newcomers to local networks. Ensure employers are aware of immigration hiring pathways (Temporary Foreign Worker, etc.) to fill persistent vacancies.
Economic Development Communications; Major Employers; Alberta Labour agencies
Medium
Leads Generated: # of inquiries or job applications from outside region attributable to campaign (track via unique website visits or referral codes; target: measurable uptick within 1 year of campaign launch).
Positions Filled: Monitor key vacancy rates in targeted occupations (goal: fill critical vacancies such as all nursing positions at hospital, etc.).
New Residents: Net migration of working-age adults (25-44) turns positive.
Community Services (FCSS) Alberta Immigrant Nominee Program; Local employers; County/Regional alliance
Medium
Participants: # of newcomer families engaged by the program
Retention: % of newcomers who stay in the community after 2 years.
Employer Uptake: # of employers utilizing immigration programs to hire.
This table outlines the key actions under Pillar 2, organized around continuous data collection, talent attraction, retention, and skills development� The actions focus on aligning workforce initiatives with employer needs, strengthening partnerships, and supporting a resilient and inclusive labour market�
2.4: Leverage quality of life to support workforce goals.
Amenities and Belonging Initiatives –
Invest in or promote community amenities that attract and retain talent, especially young adults and families. Examples: support the development of affordable childcare options (critical for working parents), continue improving broadband for remote workers, enhance recreational programming for youth, and create more community events that cater to diverse groups. Essentially, use quality-of-life improvements as a tool in workforce development (e.g. highlight these in recruitment materials).
Note: Many of these efforts tie into other Town plans, but this action ensures they are viewed through a “talent attraction/retention” lens.
Council & Community Services Economic Development; Recreation groups; Chamber Ongoing
Amenity Improvements: Completion of key projects.
Resident Satisfaction: Maintain or improve satisfaction ratings in resident surveys regarding quality of life aspects.
Population Growth: Overall town population growth rate returns to a positive trend.
Downtown is both an economic engine and a signal of community confidence (Figure 11). Pillar 3: Downtown Accessibility & Commerce Corridors is about breathing new life into Westlock’s downtown and ensuring that key commercial corridors (like our highway approaches and main streets) are attractive, connected, and bustling with activity� A thriving downtown not only directly generates business activity (through retail, dining, services, and upperfloor residential) but also creates a positive impression that helps draw investment to the entire town. Conversely, a struggling or uninviting downtown can dampen investor and resident enthusiasm� Stakeholders in the Think-Tank emphasized that Westlock’s downtown has good “bones” – a traditional main street grid and some historic buildings – but needs revitalization and modernization to reach its potential�
This pillar acknowledges that meaningful downtown and commerce corridors revival requires a combination of physical improvements, supportive policies, and programming to boost foot traffic. These, combined with Westlock’s other commerce corridors, such as the highway commercial areas, form visitors’ first impressions. By improving wayfinding, aesthetics, and coherence along these corridors, the goal is to encourage travelers to stop and explore, and to channel visitor spending into local businesses� Regionally, as competitors (other towns) invest in their downtowns or develop highway malls, Westlock must keep pace to remain a preferred service centre�
Intended impacts by 2030 include a notable decrease in commercial vacancy rates (empty storefronts filled), visible upgrades to building facades and public spaces, and increased pedestrian activity� We also expect sales and business counts in the core to rise. The community will benefit from a rejuvenated “heart of the town” – a downtown that residents are proud of and that can host events, markets, and daily commerce in a pleasant environment� Improvements in traffic flow, parking, and accessibility will make it easier for people of all ages and abilities to patronize downtown and move between key commercial nodes� Ultimately, a revived downtown and appealing corridors will reinforce Westlock’s role as a vibrant regional hub�
• Complete a comprehensive Downtown Area Redevelopment Plan (DARP) that outlines specific improvement projects, complete with phasing and funding strategies, and begin implementing its top priorities�
• Reduce the commercial vacancy rate – for instance, cut it by half compared to 2025 levels (i�e� if 10 storefronts were vacant, aim for only 5 or fewer vacant through encouraging pop-ups or new businesses)�
• Increase private property reinvestment in the downtown: more facades refreshed, building code improvements (like accessibility ramps, fire upgrades) undertaken. This can be measured by the uptake of a facade improvement program and building permit values in the downtown area�
• Improve walkability and accessibility: safer pedestrian crossings, better sidewalks and lighting, clearly marked parking and pathways connecting downtown with adjacent areas�
• Boost downtown foot traffic and activity: more community events hosted downtown (e.g. street festivals, farmers’ markets), and higher attendance at those events� Year-round vibrancy should increase, with fewer “dead” periods� Success might be a measurable increase in downtown businesses’ sales during event times or an increase in pedestrian counts if we institute measures�
• Main Street Revitalization & Façade Improvement: Concentrate on improvements to main streets (100 Avenue, 106 Street and 107 Street) and adjacent core streets� Encourage a mix of public realm improvements (streetlights, benches, planters, public art) and private building improvements� Establish a Storefront Improvement Program to provide matching grants for facade renovations, signage upgrades, and adding features like wheelchair ramps� This combination can dramatically uplift downtown aesthetics�
• Connectivity, Streetscape & Parking Management: Make it easier and more pleasant to move around downtown� This includes clearly marked crosswalks, possibly bump-outs or curb extensions to calm traffic, and signage directing people to parking lots and key destinations� Ensure sidewalks are well-maintained year-round (quick snow clearing) and consider adding bike racks or street furniture� Manage parking with common-sense rules (e�g� designated loading or handicap zones) and communicate them clearly so parking is seen as convenient, not a deterrent�
• Downtown Programming and Place-making: Animate downtown beyond just business hours� Work with community groups to program events: e�g� summer street festivals, outdoor farmers’ markets on weekends, evening concerts or movie nights in the park, holiday light-ups, etc. Use pop-up initiatives to temporarily fill vacant spaces (for instance, art displays or seasonal pop-up stores). Place-making could involve creating small plazas or parklets where people can linger� The goal is to make downtown a social and cultural destination, not just a place to run errands�
• Commerce Corridor Enhancement: Expand focus to the highway commercial strips (e�g� along Hwy 18 and 44)� Implement cohesive wayfinding signage so travelers know how to find downtown, parks, and facilities. Increase the visual appeal of these corridors with things like consistent “Welcome” signage or landscaping at key entry points, perhaps themed to Westlock’s identity� This also involves encouraging highway businesses to upkeep appearances because they form impressions� A “gateway” improvement plan might be part of this theme�
• Business Mix & Gap Filling: Work on attracting a more diverse mix of businesses to downtown and corridors, especially those that reduce retail/service “leakage” (money spent out of town)� A Commercial & Industrial Gap Analysis will inform what types of stores or services are missing� Recruitment can then target those (for instance, if analysis shows a need for a certain type of restaurant or clothing store)� Filling key gaps will draw more shoppers to stay in Westlock� Also, consider incentivizing certain uses downtown (like perhaps a brewpub or tech co-working space) that can act as anchors to attract different customer segments.
Imagine a Saturday in 2030: The downtown has a steady stream of people strolling between shops and cafes� A new bakery and a boutique that opened in formerly vacant buildings are buzzing with customers� The façades up and down the street are fresh – with heritage buildings repainted and adorned, and modern signage that still fits the small-town charm. Planters with seasonal flowers hang from lamp posts installed a few years ago. A family easily finds parking in a marked public lot and follows a pedestrian walkway, guided by signs, to an indoor farmers’ market happening in a revitalized hall� In the evening, locals gather for a street concert under new festive lighting crisscrossing 106 Street�
Intangible but important: pride in downtown will be restored� When residents boast about Westlock, they’ll mention the charming, lively downtown� That civic pride is a hallmark of success, as it means the revitalization didn’t just change physical space – it uplifted the community’s spirit and attractiveness�
FIGURE 11: Downtown Core and Commercial Corridors Framework
This figure illustrates the spatial focus of Pillar 3, identifying the Downtown Core and major commercial corridors that guide revitalization efforts, land-use planning, and targeted economic development initiatives�


This table outlines the priority initiatives under Pillar 3 aimed at improving downtown accessibility and strengthening key commercial corridors� The initiatives focus on enhancing connectivity, supporting business visibility, improving public realm and infrastructure, and creating conditions that encourage investment, redevelopment, and increased commercial activity�
3.1: Plan and launch downtown revitalization projects.
Downtown Area Redevelopment Plan (DARP) – Complete a detailed Downtown Area Redevelopment Plan that identifies specific public realm improvements, private development opportunities, parking and traffic changes, and a phased capital plan. Once completed, formally adopt it and begin implementing early-win projects (e.g. streetscape improvements or catalyst site development).
Façade & Accessibility Improvement Program – Design and roll out a grant or incentive program encouraging downtown building owners to upgrade facades, signage, and accessibility (e.g. wheelchair ramps, doorway improvements). Provide matching grants or tax rebates for eligible improvements aligned with design guidelines. Promote the program actively to landlords and track uptake.
Planning & Development
Economic Development
Economic Development; Operations; Downtown property owners
Short–Medium
Corporate Services; Chamber of Commerce Medium
Plan Completion: Downtown Revitalization Plan adopted by Council.
Project Pipeline: # of projects from the plan initiated or completed by 2030.
Capital Funding: Funding secured for plan projects.
Participation: # of buildings improved via program.
Private Investment: Dollars of private investment leveraged.
Visual Impact: Before/after assessments.
This table outlines the priority initiatives under Pillar 3 aimed at improving downtown accessibility and strengthening key commercial corridors� The initiatives focus on enhancing connectivity, supporting business visibility, improving public realm and infrastructure, and creating conditions that encourage investment, redevelopment, and increased commercial activity�
3.2: Improve downtown infrastructure and streetscape for walkability and accessibility.
Downtown Wayfinding and Gateway
Signage – Install a cohesive set of directional signs and gateway features. This includes signage at town entrances and highways directing to “Downtown” and key attractions, and within downtown, signs pointing out parking lots, public washrooms, and points of interest. Also consider thematic banners or art on light poles to create a sense of place.
Parking Clarity and Curb Management –
Conduct a parking usage audit downtown and then implement changes: clear signage for public parking areas, designated loading zones for businesses, and improved winter maintenance of parking areas. Educate businesses and public on parking options .
Planning & Development; Operations Economic Development; Communications; Alberta Transportation Short
Signage Installation: # of wayfinding signs installed.
Visitor Feedback: Feedback from visitors via Chamber or tourism channels indicates easier navigation (qualitative, e.g. fewer inquiries about directions).
Downtown Traffic: Indirect measure – increased visitation noted by downtown businesses (survey businesses if signage helped bring new customers).
Planning & Development; Operations Planning & Development; Municipal Enforcement; Downtown Businesses
Short
Parking Utilization: Achieve more even usage of parking.
Reduced Complaints: # of parking complaints or infractions drops (target: measurable reduction year over year after changes).
Customer Perception: Downtown visitors report finding parking reasonably easy.
This table outlines the priority initiatives under Pillar 3 aimed at improving downtown accessibility and strengthening key commercial corridors� The initiatives focus on enhancing connectivity, supporting business visibility, improving public realm and infrastructure, and creating conditions that encourage investment, redevelopment, and increased commercial activity�
3.3: Activate downtown through events and diverse uses.
Streetscape & Accessibility Upgrades –
Invest in pedestrian-friendly features: e.g. install new street lighting (LED, pedestrian-scale) downtown, additional benches, trash bins, and planters. Enhance crosswalks with better markings or bump-outs for safety. Ensure curb cuts and ramps at intersections meet accessibility standards. Possibly introduce public Wi-Fi in the downtown core as a modern amenity. Coordinate with any underground infrastructure renewal to time these upgrades efficiently.
Downtown Events & Programming
Calendar – Coordinate an annual calendar of events that utilize downtown spaces (streets, parks, or plaza). Examples: summer street festival, weekly farmers’ market in season, classic car show, holiday parade and market, etc.
Support these with necessary road closures, marketing, and small grants to organizers. The aim is regular, year-round events that draw locals and visitors downtown.
Operations (Public Works)
Community Services (Events)
Planning & Development; Community Services
Medium
Chamber of Commerce; Downtown businesses; Local clubs and arts groups
Short
Infrastructure Added: # of new streetlights, benches, etc.
Accessibility Compliance: All key crossings have ADAcompliant ramps.
Pedestrian Satisfaction: Survey or focus group of downtown users indicating improved comfort/safety (target: positive feedback increases).
Event Count: # of downtown events held per year.
Attendance: Estimated attendance or foot traffic at events.
Economic Boost: Downtown business sales on event days vs non-event days (qualitative reports, aim for noticeable uptick).
This table outlines the priority initiatives under Pillar 3 aimed at improving downtown accessibility and strengthening key commercial corridors� The initiatives focus on enhancing connectivity, supporting business visibility, improving public realm and infrastructure, and creating conditions that encourage investment, redevelopment, and increased commercial activity�
3.3: Activate downtown through events and diverse uses.
Pop-up Shop Initiative – Work with property owners of vacant commerce spaces to host rotating pop-up shops or galleries. Provide assistance in matching short-term tenants (artisans, seasonal retailers, startups testing market) with space and possibly offer small grants to offset utilities or insurance for popups. This keeps storefronts active and can lead to permanent leases if pop-ups succeed.
Business Mix Improvement (Gap Targeting) – Using findings from the Commercial Gap Analysis (planned), actively recruit or incubate businesses that fill downtown/service gaps. This could include offering incentives like a reduced rent period (in partnership with landlords) or marketing support to attract those businesses. Also consider zoning flexibility or live-work allowances to encourage a mix of uses (like tech offices or apartments over storefronts) to increase downtown daytime and evening population.
Economic Development
Downtown property owners; Arts & Culture groups; Chamber of Commerce
Short
Economic Development Landlords; Realtors; Council Medium
Pop-ups Conducted: # of pop-up shops/events hosted in vacant spaces.
Vacancy Reduction: Vacancy rate in commercial zones.
Conversion Rate: # of pop-up participants who become long-term tenants.
New Businesses: # of new businesses opened in targeted categories.
Occupancy: Downtown and commercial zones occupancy rate.
Diversity of Offerings: Track addition of any “missing” categories.
Economic development is not just about hard infrastructure and programs – it’s also about narrative (Figure 12). Pillar 4: Economic Identity & Storytelling focuses on defining what Westlock stands for economically and communicating that effectively to the world. Currently, Westlock’s image might be seen as a “typical small Alberta town�” This pillar aims to sharpen that image into a compelling identity that highlights our unique strengths – whether it’s our agricultural heritage and innovation, our strategic location, or our community values – and then consistently tell that story to attract investors, visitors, and even residents�
This pillar arises from the recognized gap that Westlock lacks a strong, differentiated brand for investment attraction� In today’s competitive landscape, towns that succeed often have a clear narrative (“who we are” and “why invest here”)� Westlock needs to carve out its niche branding – likely as a regional service and agri-value hub with a great quality of life or similar, with a nod to innovation in traditional sectors� Alongside branding, the storytelling component means we actively share success stories and information that reinforces that brand�
Intended outcomes by 2030 include having a recognizable “Westlock brand” in economic development materials� This includes a suite of professional, updated marketing collateral/databases that an investor can easily find (or a resident can proudly share) – such as an economic profile, land inventory, sector brochures – all with cohesive messaging and design� Our online presence (website, social media) will be modern and engaging, showcasing available opportunities and lifestyle strengths� We also expect an increase in inquiries from prospective investors or businesses, which can be partially attributed to better marketing� Furthermore, within the community, a stronger identity and storytelling culture means people know what the town is aiming for and can articulate Westlock’s advantages (essentially turning locals into ambassadors)�
• Build on existing branding to adopt a clear economic development messaging for Westlock (e�g� a tagline, visual identity, and key messaging points) that is used in all investment attraction and marketing materials�
• Assemble an up-to-date suite of marketing collateral/databases: a professional investment website or microsite, printable/downloadable profiles for key sectors, an available lands directory, success story case studies, etc� These should be readily accessible to anyone looking into Westlock�
• Increase Westlock’s online reach and engagement: more website visits on economic development pages, growing social media followers for Town channels, and positive media coverage� For instance, track a target percentage increase in website traffic year-over-year.
• Regularly publish and circulate success stories and news about Westlock’s economic developments – whether it’s a new business opening, an infrastructure project completed, or a local entrepreneur’s achievement� Aim for at least one feature story a month that highlights something positive about Westlock’s economy or community�
• Achieve higher awareness and favourability of Westlock among target audiences� This could be measured via surveys of external stakeholders (like Edmonton region site selectors or business associations) before and after our branding efforts – expecting an improvement in recognition of what Westlock offers (for example, more respondents able to recall Westlock and its value proposition unprompted)�
• Messaging and Branding: Conduct an internal branding exercise to define Westlock’s unique value proposition. Develop core messages and proof points (e�g� “Westlock: your connection to commerce and community” – supported by proof points like our highway/rail links, our collaborative business culture, etc.). Create an economic development-specific style guide so all communications use consistent logos, colors, fonts, and tone�
• Investor-Focused Collateral: Create the investment attraction toolkit� This includes one-page fact sheets on the town (with stats like population ~5k, trade area 15k, major industries, key infrastructure), sector-specific sheets (agri-business, manufacturing, retail opportunities), profiles of available industrial/commercial lands (with lot sizes, prices, servicing), and a “How we help investors” brochure explaining any incentives or streamlined processes� Ensuring these are attractive and easily available (downloadable PDFs and print copies) is key�
• Digital Presence Upgrade: Enhance the Town’s economic development web presence� Possibly create a dedicated investment microsite linked to Westlock’s main site, featuring dynamic content like interactive land maps, business testimonials, data dashboards (showing metrics like local labor force, taxes, etc.). Improve navigation and content on the website so prospective investors find what they need quickly (and contact info easily)� Leverage social media (LinkedIn, etc�) for professional outreach, and Facebook/Instagram for community and visitor-facing storytelling�
• Storytelling Campaign (“Westlock Works”): Launch a campaign to regularly tell stories of economic success or interesting entrepreneurs in Westlock (e�g� a new trades business that is booming, a farmer innovating with ag-tech, a young family that relocated here and started a home-based business, etc)� These stories can be shared on the website, local newspaper, social media, and regional newsletters� They humanize the economy and reinforce our brand themes (for instance, innovation in agriculture or collaborative community)�
• Internal Ambassadors and Consistency: Train and engage local ambassadors – real estate agents, business owners, councillors – in the key messaging so they too become consistent storytellers for Westlock� When everyone from the Mayor to a local restaurateur can articulate “why Westlock is great for business/life,” the message spreads organically� Also, ensure consistency: for example, if a regional magazine features an article on Westlock, use our branding; when attending trade shows or events, have a polished booth display that mirrors our brand�

Westlock will shed any previous image of being “off the beaten path” and instead be recognized as a community on the rise� By 2030, when someone mentions Westlock in economic circles or at an Edmontonarea meeting, people will respond with familiarity� Essentially, our proactive storytelling will mean we no longer fly under the radar. Success is also tangible in that inquiries about Westlock from potential investors or developers increase – for example, more calls/emails to the Economic Development Officer referencing materials they saw or referrals from seeing Westlock in the news� We might even secure an investment or two directly due to our outreach (someone comes to us who otherwise wouldn’t have considered Westlock)� Internally, pride increases – locals see their town’s name in positive lights more often and that boosts morale and buy-in for other initiatives� By consistently telling our story, we also keep momentum: each small win gets celebrated and propels the next� The narrative we build will make Westlock not just a location on a map, but a brand that stands for opportunity and community�
This figure illustrates the Strategic Storytelling Timeline that guides Pillar 4, outlining how planning, content production, distribution, and evaluation work together to strengthen the community’s economic identity� The cycle ensures that economic narratives are intentional, consistent, and measurable, supporting investment attraction, community pride, and external awareness�
• Growing the culture
• Closing the loop
• Choosing appropriate benchmarks, KPIs
• Measuring call-to-action

• Collecting assets
• Revising story formats
• Creating stories


• Considering resources, capacity, limitation
• Defining desired audiences, actions
• Mapping content needs
• Making channel choices
• Integrating across platforms
• Considering presentation
This table outlines the initiatives under Pillar 4 focused on strengthening the community’s economic identity through intentional, coordinated, and measurable storytelling� The initiatives support consistent messaging, increased external awareness, and alignment between branding, investment attraction, and community engagement efforts.
4.1: Develop Westlock’s economic development brand and toolkit.
Economic narrative and messaging toolkit – Facilitate a small branding workshop with Communications Department to define Westlock’s unique value proposition and key messages. From this, create a concise messaging toolkit: tagline, elevator pitch, and proof points about Westlock’s economy. Distribute this toolkit to all who represent the town (staff, Council, ambassadors) to ensure unified messaging.
Investor-ready collateral package –
Produce a set of modern, visually appealing collateral materials. This includes an updated Economic Profile (data-rich overview), sector opportunity profiles (e.g. one-pager each for Agriculture Value-Add, Manufacturing, Logistics, Retail/Services opportunities), a “Why Westlock” brochure highlighting quality of life and municipal supports, and detailed sheets for available commercial/industrial lands (each listing size, price, utilities, etc.). Ensure design consistency (using the new brand style). Make them available in print and digitally.
Investment opportunity microsite –
4.2: Enhance digital presence for promotion and information.
Overhaul or create a dedicated section of the Town’s website (or a standalone microsite). Feature interactive content: e.g. map of available land/sites with filter options, dynamic charts on demographics, testimonials video section (“Hear from local business owners”), and clear calls to action (contact forms). Ensure the site is mobile-friendly and optimized for search (so site selectors find it easily). Regularly update content (like a news/blog section for economic development updates).
Economic Development Council; Chamber of Commerce; Communications Short
Economic Development Communications; Planning Short
Toolkit Usage: # of stakeholders trained or given the messaging toolkit.
Recognition: External recognition of brand (e.g. media picking up tagline, or region refers to Westlock’s new identity in their materials).
Economic Development Westlock Economic Region; Communications Short
Collateral Completed: # of materials produced.
Distribution: # of downloads or requests for these materials.
Inquiry Conversion: Track if inquiries reference seeing our materials.
Website Launch: New microsite live.
Traffic: Increase in web traffic to new pages.
Engagement: Track user engagement: time on page, downloads from site, inquiry form submissions.
Table 4: Pillar 4 – Economic Identity and Strategic Storytelling (II)
This table outlines the initiatives under Pillar 4 focused on strengthening the community’s economic identity through intentional, coordinated, and measurable storytelling� The initiatives support consistent messaging, increased external awareness, and alignment between branding, investment attraction, and community engagement efforts.
4.3: Implement a sustained storytelling program to promote successes.
Active social media and online campaigns – Establish a consistent social media presence for economic development. For professional audience, maintain an up-to-date LinkedIn page or group with Westlock economic news. For general audience, coordinate through Town’s Facebook/X/Instagram but ensure regular economic highlights (like new business openings, event announcements). Also utilize regional channels (Edmonton Global, Invest Alberta newsletters) to amplify our content periodically. Possibly run targeted digital ads (Google or social media) focusing on key messages or available land opportunities to audiences in Alberta.
Storytelling campaign: “Westlock Works” –
Launch a campaign (as described in narrative) that profiles a success story or interesting economic narrative each month. Use a consistent format and brand for these stories (e.g. a blog post or article series, possibly accompanied by short video clips or good photography). Highlight local entrepreneurs, business expansions, community economic initiatives, or workforce achievements. Partner with local media (newspaper, radio) to spread these stories, and share them with regional media to get broader coverage.
Communications
Economic Development; Regional EDO networks
Ongoing
Social Media Reach: Follower count or post reach on relevant channels.
Content Frequency: At least one economic development related post per week on Town channels.
Lead Generation: Click-through or direct inquiries coming from social campaigns (target: measurable, e.g. X clicks per ad, Y inquiries referencing seeing it online).
Economic Development
Communications; Chamber of Commerce; Local media outlets
Short
Frequency Achieved: New story published each month.
Media Pick-up: # of stories that get re-published or reported by external media.
Audience Reach: Combined readership/views of the stories.
Table 4: Pillar 4 – Economic Identity and Strategic Storytelling (III)
This table outlines the initiatives under Pillar 4 focused on strengthening the community’s economic identity through intentional, coordinated, and measurable storytelling� The initiatives support consistent messaging, increased external awareness, and alignment between branding, investment attraction, and community engagement efforts.
& community outreach events
4.3: Implement a sustained storytelling program to promote successes.
– Complement storytelling by in-person or virtual outreach. For instance, host an annual “Westlock Investor Tour” inviting Realtors, investors, and regional influencers to visit key sites and hear our story firsthand. Participate in regional economic development summits or trade shows with a Westlock booth. Locally, hold an annual economic development update event for businesses and community leaders to celebrate wins and reinforce the vision (telling the story internally keeps everyone aligned).
Development Council; Edmonton Global; Invest Alberta Medium
Event Attendance: # of attendees at investor tours or ED events.
Outcomes: Post-event follow-ups.
Network Growth: Increase in network contacts.
For economic growth to happen, a town must be ready to receive it (Figure 13)� Pillar 5: Industry & Infrastructure Readiness is about laying the groundwork so that Westlock can confidently say to any prospective investor or expanding local business: “We have the land, the infrastructure, and the clear plans for you to succeed here�” This pillar tackles the behind-the-scenes factors such as land use planning, utility servicing, transportation links, and the regulatory framework that collectively determine how “investment-ready” we are�
In our current state, Westlock has some available industrial lands and a supportive attitude, but there are challenges like servicing costs, fragmented ownership, or lack of shovel-ready status� If current and future planning initiatives are incomplete or misaligned, Westlock could face conflicts or missed opportunities for expansion. Pillar 5 is very much about coordination – making sure our growth plans mesh with regional partners, and that we allocate resources to key infrastructure improvements in a timely way�
The regional natural resource and industrial context underscores this pillar’s importance: We see opportunities in agri-processing, light manufacturing, and logistics (as noted in SWOT opportunities), but investors in those sectors will only commit if they see suitable land with necessary services (power, water, broadband, road access) available� Moreover, as Edmonton and other centres face industrial land shortages or higher costs, Westlock can position itself as a cost-effective alternative – but only if we can demonstrate readiness. Being proactive on infrastructure also ties to jobs – construction projects themselves create work, and then facilitate permanent jobs once businesses operate�
By 2030, intended impacts are that Westlock will have increased its inventory of shovel-ready employment lands (industrial/commercial) significantly, likely through both public and private development. Critical infrastructure projects are completed (like extending water/sewer lines to priority areas, improving the highway intersection, etc�) so that key growth areas are fully equipped� Streamlined development processes are in place, possibly including a formal “fast-track” policy for high-impact projects, which will expedite approvals for those projects that meet certain criteria�
• Ensure an adequate supply of market-ready industrial and commercial land� For instance, target having at least X acres of fully serviced industrial land available (and actively marketed) by 2030, up from the current baseline (which might be lower and/or un-serviced)�
• Achieve completion of key infrastructure projects identified as prerequisites for growth. This may include upgrades like a new sanitary trunk line extension, stormwater management for industrial areas, and possibly transport infrastructure (e�g� a highway access improvement or designated truck route)� By 2030, those “unlocking” projects should be done or at least funded and in progress�
• Review and update the Intermunicipal Development Plan (IDP) with Westlock County, and adopt new Area Structure Plans (ASPs) for growth areas. These plans should delineate land uses and infrastructure for the next 20+ years, effectively minimizing uncertainty for investors. Success is measured by having these plans approved by Council and being used to guide development decisions�
• Introduce a formal expedited permitting process for strategic investments (like large employers or key sector projects)� Intended outcome: such projects get decisions significantly quicker than normal (e.g. 50% reduction in approval time for qualifying projects). By 2030, a handful of developments should have benefited from this, proving the model.
• By working on comparative analysis and addressing any cost disadvantages (e.g. if off-site levies or taxes were higher than neighbours), we aim to position Westlock’s development costs and approval timelines to be competitive or better than similar Alberta communities� A potential measure: produce a biennial comparative report (with other towns) showing Westlock in a favorable position on metrics like permit fees, tax rates, servicing costs, etc�, and see improvements over time�
• Land Inventory & Data: Maintain a detailed inventory of all potential commercial/industrial lands – their ownership, zoning, servicing status, constraints� Proactively work on those that are promising: e�g� subdivide or rezone Town-owned land for industrial use; liaise with private owners of large parcels to encourage or assist in development (maybe through joint ventures or marketing partnerships)� Essentially, no investor query about land should catch us off guard – we should have info at our fingertips.
• Infrastructure Planning & Phasing: Develop an integrated infrastructure plan that ties with our land use plans� For example, if an Area Structure Plan calls for developing a new industrial area south of town, then an infrastructure phasing plan is needed to bring water, sewer, roads there cost-effectively. Identify which infrastructure investments give the best bang for buck in unlocking land (maybe the initial servicing of a new 50-acre industrial park, or upgrading an existing road to handle heavy trucks, etc�)�
• Fast-Track and Business-Friendly Regulation: Create a “fast-track” or priority stream in the development approval process for projects that meet strategic criteria (e.g. significant job creation or tax base increase). This might involve dedicating a file lead, committing to shorter timeline targets, and concurrently processing steps that normally are sequential� Also, continue streamlining the Land Use Bylaw or processes to development is not unintentionally hampered�
• Intermunicipal & Regional Coordination: With Westlock County and the Village of Clyde, consider future industrial and commercial growth nodes just outside or adjacent to town boundaries, ensuring servicing can be extended logically� Keep regional partners aligned to avoid duplication (for example, coordinate so that we’re not all building competing industrial parks and diluting the market)�
• Targeted Sector Readiness: Consider if specific industries have unique infrastructure needs (e.g. agri-food processing might need heavy water use or waste pre-treatment, transportation/logistics might need good highway connectivity or rail spurs, manufacturing might value 3-phase power capacity, etc.). Make sure our readiness plan accounts for those specifics. Work with utilities (electrical, gas, broadband providers) to ensure capacity – like verifying that the electrical grid can handle a new manufacturing plant’s load, or that fiber optic connectivity is present in all industrial areas (if not, plan to get it there).
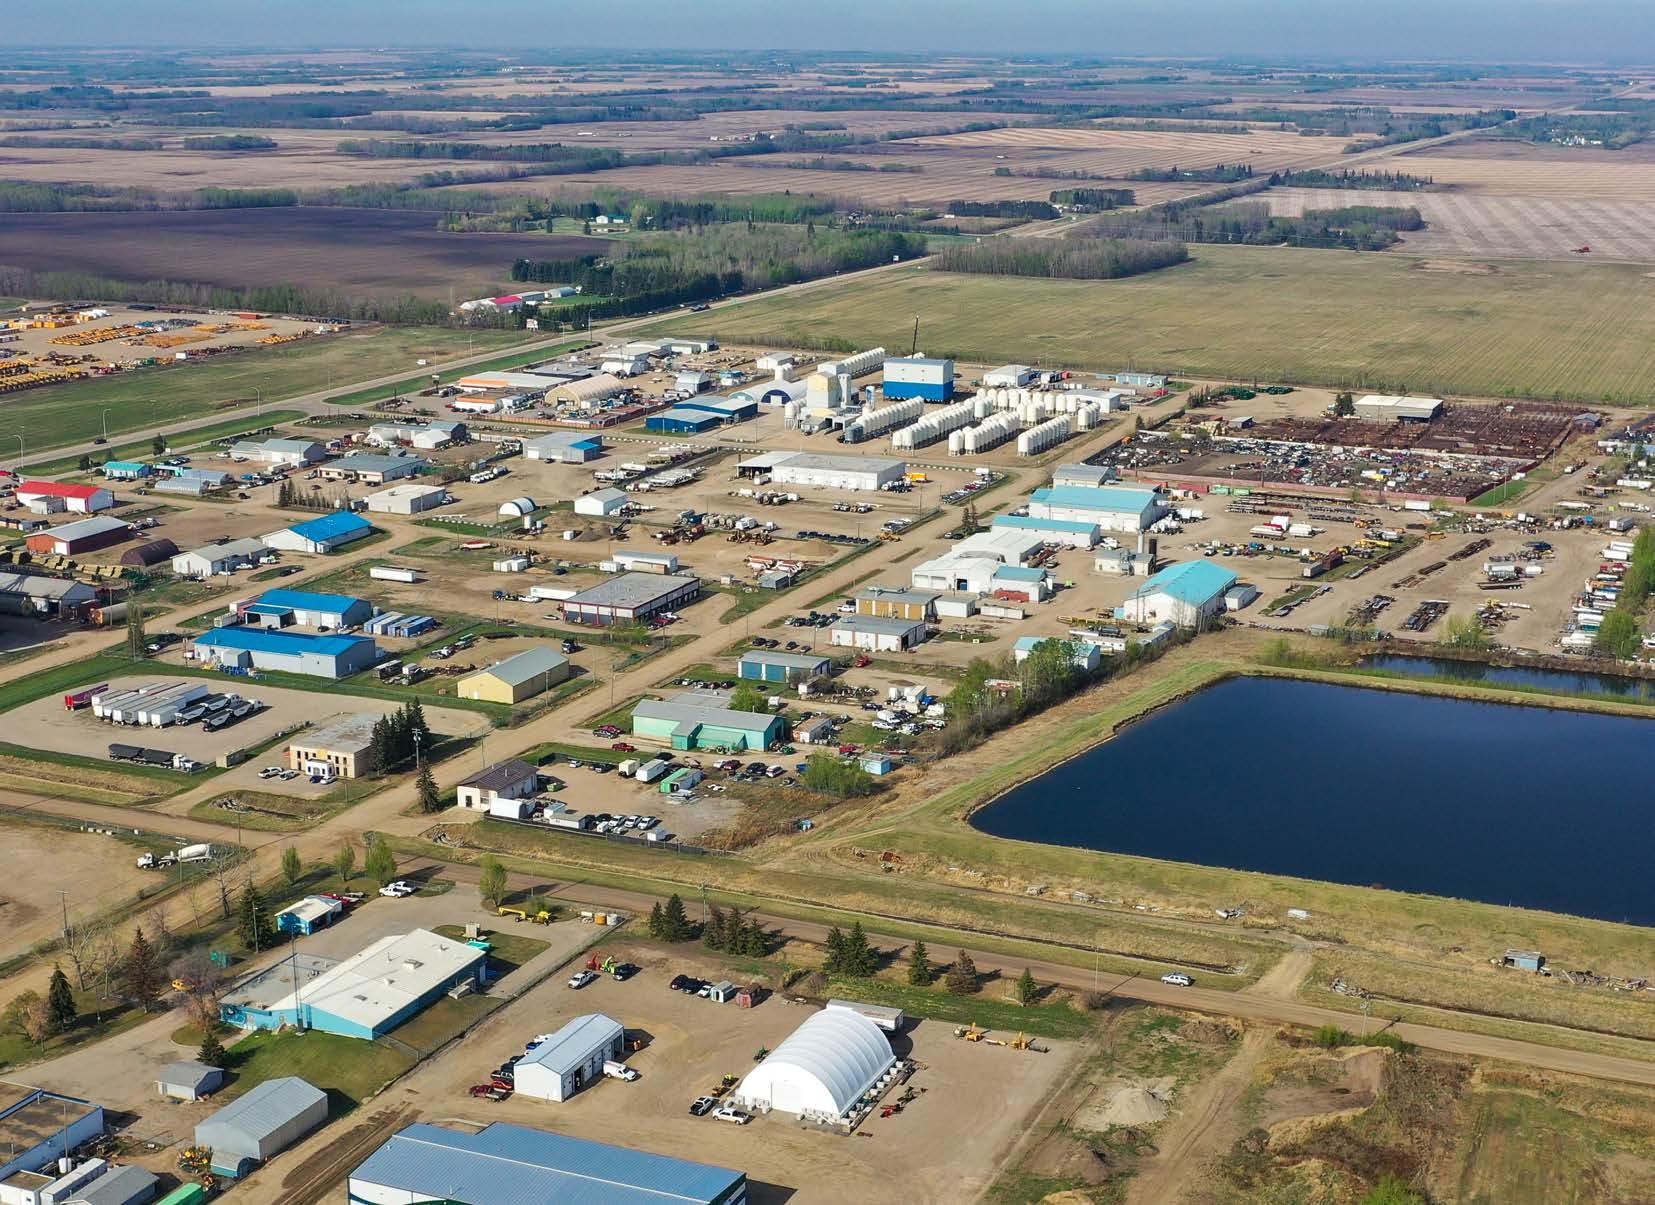
By 2030, when a prospective company comes knocking, Westlock can quickly say, “Here are three site options for you: this fully serviced lot in our new business park, that larger parcel we can service by next spring, or a partnership option on the town’s edge with the County� Permitting is straightforward and you could be operational within X months�” In other words, Westlock will have become agile in capturing opportunities, rather than losing them to delays or lack of preparedness� We would likely see real outcomes such as new businesses establishing on those lands we prepared – maybe an agri-processing facility built on a lot that was serviced in 2027, or a logistics warehouse taking advantage of improved road links by 2028�
The town’s infrastructure will be keeping pace with growth: no major outages or capacity crises, and new developments plug into systems without huge hurdles. Council and Administration will have confidence in a long-term growth framework so each new development fits into the bigger picture. Quantitatively, success could be a measurable increase in our non-residential tax assessment (showing industrial/ commercial growth), reaching a more balanced tax split� Also, fewer deals “fall through” – track how many serious prospects engaged and how many locate here; aim to improve that conversion rate by being ready� Overall, Westlock will be known not just as a place with potential, but as a place that is truly openfor-business in practical terms – with land, infrastructure, and a collaborative approach all in place�
FIGURE 13: Impact of Infrastructure Development
This figure illustrates how strategic infrastructure investment under Pillar 5 supports economic growth, productivity, quality of life, and longterm community resilience� It highlights the interconnected outcomes of infrastructure development, including job creation, sustainability, digital transformation, and improved competitiveness�
Resilient Infrastructure against Disasters
Digital Transformation
Spur Economic Growth
Improve Quality of Life
Sustainable Development with renewable energy, urban planning, etc.
Job Creation and access to Employment Opportunities
Facilitating Trade and Competition
Increased Productivity
This table outlines the priority infrastructure initiatives under Pillar 5 that support economic growth, productivity, resilience, and quality of life� The initiatives focus on strategic investments that enable business competitiveness, workforce attraction, sustainability, and long-term community development�
5.1: Build and maintain an inventory of shovel-ready employment lands.
Investment-ready land inventory & profiles – Create standardized profiles for all key commercial/industrial land parcels (both Town-owned and private) that could be developed. Include data on size, zoning, ownership, services available, and any constraints. Use this to actively market sites (tie-in with Pillar 4 collateral) and identify gaps in readiness (e.g. if a parcel lacks water service). Update this inventory annually.
Industrial lands servicing and phasing plan – Develop a plan (possibly as part of an ASP or separate engineering study) to service current and future industrial lands. Outline required extensions of water, sewer, road, and other utilities, with cost estimates and proposed timing/phasing. Use this to guide capital budgeting and to pursue grants.
Planning & Development
Operations
Economic Development; Communications; Local realtors; Landowners
Planning; Corporate Services; Utility companies; Westlock County
Short
Medium
Inventory Completed: 100% of major potential sites have a profile.
Marketing Use: # of site inquiries or downloads of site profiles (track via website or inquiries; target: increase annually).
Site Readiness: % of inventoried sites that are fully serviced.
Plan Adoption: Servicing/phasing plan completed and approved.
Capital Budgeting: Funding allocated in Town capital plan for first phase infrastructure.
Acres Serviced: New industrial acres fully serviced as per plan.
This table outlines the priority infrastructure initiatives under Pillar 5 that support economic growth, productivity, resilience, and quality of life� The initiatives focus on strategic investments that enable business competitiveness, workforce attraction, sustainability, and long-term community development�
5.2: Streamline approvals and prioritize high-impact development.
Develop “fast-track” policy – Establish criteria for projects eligible for expedited processing. Develop an internal protocol: e.g. assign a dedicated file manager, commit to faster review timelines, concurrent processing by departments, and possibly waive some fees. Document this policy and communicate it to prospective investors (promote that Westlock offers fast-track for qualifying investments).
Update Intermunicipal Development Plan (IDP) – Review and update the IDP with Westlock County (and engage other neighbours as needed). Ensure it aligns growth nodes, land use designations, and infrastructure corridors (like future roads or utility alignments) between Town and County. Also negotiate any framework for joint economic areas or revenue sharing if applicable. Once adopted, publicize it as a sign of regional unity (investors see less risk of inter-municipal conflicts).
Planning & Development CAO; Council Short
Policy in Place: Fast-track policy approved and implemented.
Usage: # of projects processed via fast-track.
Time Savings: Measure average approval time for fast-tracked projects vs. standard.
Planning
Development
Plan Adoption: Updated IDP adopted by both councils.
Coordination Meetings: Regular coordination meetings per year.
Harmonized Decisions: No major development is blocked due to Town-County disagreement.
This table outlines the priority infrastructure initiatives under Pillar 5 that support economic growth, productivity, resilience, and quality of life� The initiatives focus on strategic investments that enable business competitiveness, workforce attraction, sustainability, and long-term community development�
5.3: Upgrade and expand infrastructure critical to economic growth.
Boundary Road and Pioneer sewer trunk extensions – (Example infrastructure project)
Extend sanitary sewer trunks such as along Boundary Road or Pioneer (as identified in past studies) to open up west and south industrial lands. Work with engineering to design, and include in capital plan. Advocate for and secure external funding if possible.
Heavy haul route and road improvements – Work with province to advocate for upgrades to Highway 44 or 18 as needed (e.g. turn lanes, intersection improvements) to handle increased industrial traffic. Specifically, push for construction of any planned bypasses or access improvements identified (like Hwy 44/18 intersection upgrade or a secondary access to industrial area). Concurrently, assess municipal road improvements needed in older industrial areas (strengthening roads for heavy trucks, improving drainage). Incorporate recommendations into the Town’s transportation plan and budgeting.
Operations (Engineering)
Operations
Corporate Services; Alberta Transportation; Developers
Alberta Transportation; Westlock County; Planning
Medium
Medium /Long
Project Completion: Sewer trunk extended to serve X new hectares.
Capacity Created: Added capacity (e.g. can support Y more people or Z hectares of industrial load – track technical metrics from engineering).
New Connections: # of new parcels connected to sewer due to extension.
Advocacy Success: Provincial commitment or funding for key highway improvement.
Municipal Roads Upgraded: # of km of industrial roads improved to heavy haul standard.
Traffic Flow: Monitor heavy traffic counts or incident rates; aim for smooth flow (fewer complaints from truckers/businesses).
This table outlines the priority infrastructure initiatives under Pillar 5 that support economic growth, productivity, resilience, and quality of life� The initiatives focus on strategic investments that enable business competitiveness, workforce attraction, sustainability, and long-term community development�
Develop ASPs for any major growth areas identified: for example, a Commercial/Future Industrial ASP for lands on the edge of town to layout roads, parcels, and servicing concept; and support the Aspendale ASP (already completed for residential) to completion. Having ASPs ready means when development interest arises, zoning and servicing follow a master plan rather than ad hoc. Planning & Development
External planning consultants; Landowners; Westlock County
Development Following Plan: Instances where new subdivisions or developments align with ASP layouts (target: all significant developments in those areas conform, showing plan is guiding growth).
Land Supply Projection: ASPs demonstrate 20+ year land supply for each use (qualitative, ensure they cover long term).
5.4: Align land use plans to enable future growth (residential and industrial).
– Undertake a periodic review comparing Westlock’s development costs (levies, fees, taxes) and incentives with similar communities. If weaknesses are found (e.g. significantly higher costs or lack of incentives where others have them), present options to Council (like introducing a development incentive toolkit or adjusting fees). This could lead to an Incentives Gap Analysis (as planned) and subsequent policy changes to ensure Westlock remains cost-competitive for investors. (Planned study; implement recommendations afterward).
Economic Development Corporate Services; Council
Study Done: Incentives/Cost Competitiveness report completed.
Policy Changes: # of new incentives or policy adjustments made.
Competitive Standing: Westlock’s rank or standing in key cost measures relative to peers improves (qualitative, track over time e.g. move to median or better on off-site levy comparisons, etc.).
Economic opportunities and challenges often transcend municipal boundaries (Figure 14). Pillar 6: Regional Funding & Investment Positioning focuses on Westlock stepping beyond a siloed approach and actively collaborating with neighbouring communities and senior levels of government to attract investment and secure funding for mutual benefit. By working together regionally, Westlock and its partners can pursue larger-scale projects and funding opportunities that would be difficult to achieve independently, while presenting a stronger, more coordinated value proposition to investors considering the area�
Westlock is part of a broader region that includes Westlock County, the Village of Clyde, Alexander First Nation, and the northern periphery of the Edmonton Metropolitan Region� While each jurisdiction has distinct interests and priorities, aligning with neighbouring communities on key initiatives—such as major infrastructure (e.g., highways and broadband), workforce programs, or investment attraction—can significantly amplify impact. In addition, many provincial and federal funding programs increasingly prioritize regional collaboration, recognizing its efficiency and broader impact. By leading or participating in municipal consortiums, Westlock can improve its competitiveness for external funding�
By 2030, the intent is to have regional cooperation in economic development more fully institutionalized� Through this approach, the region could aim to jointly secure funding for several major initiatives, such as a multimunicipality transportation upgrade or regional broadband expansion� Westlock should also remain actively engaged in and benefit from participation in Edmonton Metropolitan Region initiatives, including organizations such as Edmonton Global�
Intended outcomes include the establishment of a regional project pipeline that is actively managed so that priority initiatives do not stall due to jurisdictional boundaries� Cost-sharing agreements may also be pursued where appropriate—for example, where County infrastructure upgrades support Town logistics or industrial development� Another key outcome is raising Westlock’s regional profile, ensuring that when investors engage with organizations such as Edmonton Global or other regional intermediaries, Westlock’s opportunities are clearly visible and well understood� Coordinated marketing and lead-sharing among regional partners will further support this objective, enabling investment opportunities to be directed to the most appropriate community within the region�
Success under this pillar is defined by a shift from competition to “coopetition”—a cooperative approach in which communities work together to attract investment to the region, while ensuring projects ultimately locate where they are the best fit.
• Create and maintain a shared list of priority economic development and infrastructure projects across Westlock and the surrounding region, updated yearly, with clear roles and next steps identified. By 2030, all major projects of mutual interest—such as highway improvements, regional tourism initiatives, or major industry attraction efforts—are tracked through this pipeline to improve accountability and momentum�
• Successfully obtain at least two multi-million-dollar provincial or federal grants for projects that benefit Westlock and its neighbours, such as regional servicing infrastructure, transportation improvements, or workforce and skills training programs�
• Align with regional partners around priority advocacy issues directed to provincial and federal governments� By 2030, achieve tangible outcomes from coordinated advocacy efforts, such as funded infrastructure upgrades, expanded healthcare facilities, or the establishment of new post-secondary or training programs in the region�
• Maintain active participation in formal regional organizations, such as Westlock Economic Region, Edmonton Global or other relevant networks� Measures of success may include increased investor referrals, site selector inquiries, or site visits originating through these organizations�
• Identify opportunities to share costs or resources related to economic development activities� By 2030, establish at least one example of cost-sharing or resource-sharing—such as a jointly funded study, shared program delivery, or collaborative marketing initiative�
By 2030, Westlock is no longer perceived as acting independently, but as a proactive and constructive regional partner� Success will be demonstrated through tangible outcomes, such as jointly funded infrastructure projects, regional workforce initiatives, or coordinated investment attraction efforts. Provincial and federal governments will recognize the region’s unified voice, strengthening advocacy outcomes and funding success.
From a financial perspective, regional collaboration will allow Westlock to extend municipal resources through costsharing and joint initiatives. From an investment standpoint, Westlock will benefit from inclusion in regional investment pipelines, increasing visibility to site selectors and investors� Overall, success means leveraging collective capacity to deliver outcomes that would be difficult to achieve independently, while enhancing Westlock’s reputation as a collaborative and investment-ready community�
• Shared Regional Project Table: Establish a regular forum—such as quarterly meetings involving the Town of Westlock, Westlock County, the Village of Clyde, and potentially Alexander First Nation economic development representatives—to share project updates, identify collaboration opportunities, and maintain a shared regional project pipeline�
• Joint Grant Applications: Monitor funding opportunities from sources such as FCM, Housing, Infrastructure and Communities Canada, and Alberta-based programs, and pursue joint applications wherever feasible� Early alignment and political support among partners will be key to maximizing success�
• Regional Economic Development Initiatives: Explore opportunities to participate in or strengthen formal regional economic development alliances (Westlock Economic Region)� This may include pooling resources for investment attraction, shared marketing materials, or collaborative staffing models, where value can be demonstrated.
• Data and Resource Sharing: Promote the regular exchange of economic data, studies, and analysis among regional partners� For example, sharing the results of Westlock’s Commercial Gap Analysis or County-led infrastructure studies can support coordinated planning and decision-making�
• Regional Brand and Investment Identity: Ensure Westlock’s assets and opportunities are integrated into broader regional and metropolitan investment narratives� Collaboration with Edmonton Global or similar organizations will help position Westlock as part of a larger, coherent market story�
FIGURE 14: Regional Funding and Investment Positioning Framework
This figure illustrates how regional funding, partnerships, and targeted interventions work together to strengthen economic development outcomes under Pillar 6� It highlights the progression from local empowerment and diverse funding sources to innovation, collaboration, and long-term sustainability�
COLLABORATIVE NETWORKS

INNOVATION & ENTREPRENEURSHIP LOCAL EMPOWERMENT

TARGETED INTERVENTIONS
LONG-TERM SUSTAINABILITY
This table outlines the initiatives under Pillar 6 focused on strengthening the community’s ability to secure regional funding, attract investment, and leverage partnerships� The initiatives emphasize coordinated funding strategies, targeted interventions, and collaborative networks that support innovation, local empowerment, and long-term economic sustainability�
6.1: Create and maintain a regional project pipeline for economic development.
Regional project pipeline table (quarterly)
– Establish a standing quarterly meeting with Westlock County (and invite Village of Clyde, Alexander First Nation economic reps, etc.) to discuss and update a shared list of priority projects. Use a simple pipeline document listing each project, lead municipality, current stage, and next steps. Projects could include infrastructure (e.g. regional water line), economic initiatives (e.g. joint tourism circuit), or major investment files (e.g. attracting a value-added ag facility). This table ensures everyone is informed and able to support each other’s efforts where useful.
Grant stacking and compliance playbook
– Develop a shared “playbook” document that outlines how various grants can be combined for funding and listing upcoming grant opportunities relevant to the region. Also cover compliance steps to manage joint grants (like one municipality as administrating body). This playbook can be updated and used by all partners to quickly assemble joint proposals without missing details.
Economic Development (Town)
6.2: Collaborate on investment attraction and economic initiatives.
Business case templates for major initiatives – When pursuing funding or pitching to investors for big projects, create a standard business case template that can be quickly tailored. Work with regional economic partners to include relevant regional data. This ensures every proposal or funding pitch from our area is high-quality and covers the economic rationale, cost-benefit, etc. Also, a shared template means each partner isn’t reinventing the wheel and proposals look professional.
Corporate Services (Town)
Westlock County; Village of Clyde; Alexander First Nation Short
Meetings Held: 4 regional coordination meetings per year (target: achieved consistently).
Pipeline Document: Up-to-date project list produced each quarter.
Cross-Support: # of projects where partners took supportive action.
Economic Development (Town)
Westlock County Short
Westlock County; Edmonton Global Short
Playbook Completion: Document created and distributed.
Joint Grant Apps: # of joint or aligned grant applications submitted.
Grant Success: $ value of external grants won for regional projects.
Template Ready: Business case template available.
Usage: # of major project pitches or grant proposals using the template.
Approval Rate: Success rate of proposals.
This table outlines the initiatives under Pillar 6 focused on strengthening the community’s ability to secure regional funding, attract investment, and leverage partnerships� The initiatives emphasize coordinated funding strategies, targeted interventions, and collaborative networks that support innovation, local empowerment, and long-term economic sustainability�
6.3: Maximize engagement with broader regional bodies and programs.
Regional advocacy agenda – Annually, coordinate with neighbouring councils to set 2-3 common advocacy priorities (e.g. lobbying for Highway 18 upgrades, or a regional hospital expansion, or training funding for a local college program). Develop unified briefing materials and arrange joint delegations to provincial ministries or federal MPs. Monitor results and adjust yearly.
Participate in Edmonton Global/Invest
Alberta – If Westlock opts to join the (metro’s) investment attraction organization: Ensure active participation - attend all shareholder meetings, contribute data for their inventory, host familiarization tours if they bring prospects to region. Then engage via Westlock Economic Region or other regional networks. In either case, make sure Westlock’s offerings (land, sectors) are known by those larger entities. Provide regular updates to them so they can include Westlock in pitches to international investors.
Collaborative Economic Development (CED) projects – Explore participating in any new collaborative funding models (some Alberta regions have tried pooled investment funds or joint projects funded by multiple municipalities). For example, if a regional broadband project or regional transit comes up, be at the table to contribute and benefit. Proactively initiate or join at least one such multi-party project.
Mayor/Town Council (lead convener) Tri-Council Committee
Economic Development
Edmonton Global (or Invest Alberta, etc.); Westlock County
Annual
CAO/Economic Development Neighbouring municipalities; Provincial programs
Ongoing
Shared Priorities Set: Documented top 3 joint priorities each year.
Advocacy Actions: # of joint letters, meetings with ministers, etc. Wins: Achieve tangible movement on priorities
Medium
Engagement: Attendance at regional Economic Development organizations' meetings.
Leads from Org: # of investment leads or referrals received via these bodies.
Regional Marketing Inclusion: Westlock featured in regional marketing materials or missions.
Projects Joined: # of multi-municipality economic projects Westlock is part of.
ROI on Collaboration: Evaluate outcomes from joint project.
Cost Share: Amount of cost offset via cost-sharing.
A sustainable economy requires a range of housing for its workforce and residents (Figure 15). Pillar 7: Housing Accessibility & Attainability focuses on ensuring Westlock can offer diverse and affordable housing options to meet current and future needs. Without sufficient housing – particularly rental units, starter homes, and senior-friendly options – Westlock risks constraining its growth: businesses can’t attract employees if those employees can’t find a place to live, and young families or retirees may choose to locate elsewhere if housing isn’t suitable or available�
Westlock has already recognized this with its recent Housing Action Plan (2023) and participation in the federal Housing Accelerator Fund (HAF), which provides funding for local housing initiatives� Pillar 7 builds on that momentum and expands it, integrating housing considerations into economic development� The pillar’s rationale is not just social (though providing affordable, appropriate housing is intrinsically valuable) but also economic: more housing supports population growth, which in turn enlarges the labour force, consumer base, and municipal tax base� Additionally, development and construction of housing are economic activities in their own right, creating jobs and business for local trades�
By 2030, the intended impact of this pillar is that Westlock will have a significantly improved housing mix and a reputation as a community that proactively addresses housing needs� We expect to see new multi-unit developments (e�g� townhouses, apartments) that were previously missing, an increase in rental availability (with options for different income levels), and innovative housing forms like secondary suites becoming more common due to supportive policies� The ultimate measure would be that housing is not cited by local employers or potential residents as a major barrier – i.e., if someone wants to move here for a job, they can find a place to live without undue difficulty. Existing residents are able to stay in the community through all life stages: young adults find starter homes, seniors find downsizing options, etc., rather than having to relocate.
• Increase in the total number of dwelling units by a certain target� More importantly, an increase in the diversity of dwelling types across the housing spectrum�
• Ideally, keep average rents and home prices at a reasonable ratio to incomes (monitor the housing affordability index; success if Westlock remains or becomes more affordable than the Alberta average while still seeing growth). The presence of more market-rate rentals might stabilize rent costs by increasing supply�
• Key strategies from the Housing Action Plan are continued such as a Residential Incentive Program (with grants and tax breaks for builders of multi-unit housing) – fully executed and resulting in developers taking up those incentives. Similarly, use of pre-approved plans for suites or fast-tracking infill.
• An updated Housing Needs Assessment and renewed Housing Action Plan provide clear signals to the development community on priority housing types, locations, and target markets� By 2030, this results in increased residential investment and visible delivery of priority housing forms (including workforce housing, infill, and redevelopment), demonstrating that housing outcomes are being driven by current market evidence and investor confidence.
• A healthier rental vacancy rate in a balanced range (around 3-5%), implying renters have some choice and new units are entering the market at pace with demand� Also, home vacancy (for sale inventory) in a healthy range, and reduction in any waitlists for seniors’ housing or subsidized units�
• Market-Responsive Housing Planning: Refresh the Town’s Housing Needs Assessment to deliver current, market-ready insights into housing demand, affordability gaps, and development feasibility. This work will directly inform the next iteration of the Housing Action Plan, translating market evidence into clear, implementable actions that support residential investment, workforce housing, and long-term economic competitiveness� The focus will be on reducing uncertainty for builders and investors by clearly identifying priority housing types, target areas, and opportunities for partnership�
• Incentives and Partnerships: Leverage the external funding and Town resources to encourage the private (or non-profit) sector to build needed housing� This could involve extending or adding local incentives – for example, continuing a municipal tax abatement program for rental apartments if needed, or providing land at a discount for affordable housing projects. Partnerships with organizations could also bring specialized projects� Monitor uptake of the current incentives and be prepared with a sustainability plan for incentives�
• Residential Land Development & Infrastructure: Identify and plan new residential growth areas (like the Aspendale ASP area and others)� Ensure that infrastructure (roads, water, sewer) will be extended to those areas in time to not delay development� Possibly use Town-owned land or partnerships to create “shovel-ready” residential lots, similar to the Southview subdvision�
• Downtown and Infill Housing: Promote housing development in or near downtown (which helps Pillar 3 by adding foot traffic and customers)� This can be through encouraging mixed-use or even purely residential projects on vacant or underused downtown parcels� Also encourage infill in established areas.
• Community Education and Support: Accompany housing growth with public education on how more housing benefits the whole community (for example, allowing secondary suites helps families, rental apartments bring in young professionals to work at our hospital or schools, etc.). Also provide resources to help homeowners build secondary suites (guides, perhaps even short-term financial assistance if that’s a barrier)� The easier and more accepted it is, the faster such units will materialize�
Westlock in 2030 is a place where people can find homes for every stage of life. A young single worker can rent a modern apartment in a new 24-unit building near downtown. A family can find a reasonably priced starter home in a new subdivision or perhaps a townhouse in an infill project. Seniors have options: maybe a new seniorsoriented apartment complex was built next to the hospital, plus more secondary suites exist so seniors can live with family if they choose� The housing conversation in town shifts from “we don’t have anywhere for X to live” to “we have some great new developments and more on the horizon�”
We would see physically the results: construction activity with new rooftops visible in aerial photos, a more varied streetscape (not just single-family homes, but some townhouses, small apartment buildings, etc�, tastefully integrated)� Employers note that when they recruit someone, housing is less of a stumbling block than it used to be� And the Town’s proactive housing work could gain recognition – for innovation in small-town housing strategy, or simply the goodwill of residents who see the Town tackling an important issue�
Financially, more housing means a broadened tax base and potentially stabilizes housing prices (preventing sharp spikes that harm affordability). Overall, success is a Westlock that can accommodate growth without displacing people or pricing them out� Housing becomes a foundation for economic expansion – not a bottleneck�
FIGURE 15: Housing Accessibility and Attainability Framework
This figure illustrates how housing functions as a foundational driver of economic, social, and civic development under Pillar 7. It highlights the interconnected role of housing in supporting workforce attraction and retention, community stability, local economic activity, and longterm civic capacity�

ECONOMIC DEVELOPMENT GOALS
SOCIAL DEVELOPMENT GOALS
• Macroeconomic impacts of housing account for a significant portion of annual revenue
• Housing generates expenditures outside the housing sector
• Housing and real estate asset classification leads to greater market efficiency, stability, and liquidity

CIVIC DEVELOPMENT GOALS

• Strong motivator for savings and investment
• Extra income from rental housing
• Housing may bring people to jobs
• Asset base for rural poor with few other resources
• Absorption of rural immigrants
• Housing needs catalyzes civic activism
• Stimulus for community based organizations
• Decentralization and the Democratic Process
• Experience for elected leadership
• Local government capacity building Security
• Community stability
This table outlines the initiatives under Pillar 7 focused on improving access to attainable, diverse, and appropriate housing options� The initiatives support workforce attraction and retention, community stability, and long-term economic and civic development�
Housing needs and market scan (light refresh) – Conduct a mini-update to the 2023 Housing Needs Assessment: current demographics, household sizes, waitlist info from any local housing agencies. Identify specific gaps. Use this scan to set targets and refine actions. Essentially a quick check to guide mid-course adjustments and ensure we address the most pressing needs.
Planning & Development Community Services; Developers; Realtors
Medium
Scan Completed: Yes/no (complete report).
Targets Set: Specific numeric housing targets by type established.
Council Adoption: Council acknowledges and uses findings in policy.
7.1 Update policies to enable diverse and affordable housing forms.
Zoning and bylaw updates for housing diversity – With key Land Use Bylaw amendments already adopted to support a wider range of housing types (including secondary and garden suites, mixed-use downtown zoning, and reduced regulatory barriers for multi-unit housing), the next phase will focus on the development of the next iteration of the Housing Action Plan in 2027, following the updated Housing Needs Assessment (HNA). This updated plan will set new priorities, implementation actions, and policy directions to respond to emerging housing demand and market conditions.
Planning & Development Council; Developers
Medium
Bylaw Passed: Additional housing-friendly LUB provisions enacted.
Diversity Metric: Increase in housing mix.
This table outlines the initiatives under Pillar 7 focused on improving access to attainable, diverse, and appropriate housing options� The initiatives support workforce attraction and retention, community stability, and long-term economic and civic development�
Objective Action (Initiative)
Developer roundtable + pipeline tracking
7.2 Incentivize and support development of priority housing types.
– Similar to business retention but for housing: hold an annual roundtable with developers/builders who operate or could operate in Westlock (local and regional). Discuss what it would take for them to build here (e.g. lot availability, incentives, red tape concerns). Maintain a simple pipeline of potential housing projects (e.g. Builder A interested in a 20-unit rental if land/costs work out). Use this intel to adjust Town actions (like offering a particular incentive or streamlining a process for a ready project).
Residential incentive toolkit – Fully implement and, if feasible, extend beyond HAF timeline the Town’s incentive programs for new housing. This includes continuing grants and tax breaks for multi-unit construction, plus exploring additional incentives like fast-tracking permits for affordable units, or offering Town-owned land at nominal cost to affordable housing providers. Regularly review incentive uptake and adjust values or criteria to ensure they are effective.
Planning & Development
Local builders; Regional developers; Real Estate agents
Short
Economic Development (with Planning)
Corporate Services; CMHC; Builders; Housing non-profits
Medium
Meetings: At least 1 developer roundtable per year (track attendance).
Projects Identified: # of prospective projects in housing pipeline.
Conversions: # of pipeline projects that move forward to actual development.
Incentives Utilized: # of units or projects that used Town incentives.
Program Spend vs. Outcome: Dollars of incentive vs. private investment leveraged.
Extension Plan: Decision made on continuing incentives post-HAF.
This table outlines the initiatives under Pillar 7 focused on improving access to attainable, diverse, and appropriate housing options� The initiatives support workforce attraction and retention, community stability, and long-term economic and civic development�
Infill and downtown residential incentive concepts – Develop and pilot a specific incentive or support for residential development in targeted areas: e.g., a property tax rebate for upper-floor downtown apartments, or a grant for converting vacant commercial space to residential. Encourage mixed-use in the core and gentle density in existing neighborhoods (like splitting a large lot). Monitor if these lead to projects and refine accordingly.
Corporate Services Planning; Downtown property owners
Medium
7.3 Increase supply of attainable and rental housing through development and partnerships.
Collaborate with housing agencies and developers – Work with organizations to address specific needs (special-needs housing, entry-level ownership). For instance, identify a Town lot that could be used for a small build and facilitate that. Also regularly engage larger developers who do multi-family in regional centres; market Westlock’s incentives and low land cost to them. Possibly issue RFPs for development on Town-owned parcels, with additional incentives
Continually track key indicators: vacancy rates, average rent, house price trends, population growth, etc. Include a housing section in the Town’s annual report or scorecard to keep focus. Adjust actions if, say, vacancy becomes too high (meaning oversupply – then maybe ease off incentives) or if still too low (doubledown on efforts). Essentially ensure a balance: enough housing for growth but not so much that existing stock values collapse.
Community Services; Economic Development Non-Profit Organizations; Private developers
Medium
Pilot Uptake: At least 2 projects utilize the downtown/infill residential incentive within first 2 years of pilot.
Units Created: # of new residential units in downtown or via lot splits.
Vacancy Downtown: Related benefit, possibly lower upper-floor vacancy or more people living downtown (qualitative improvement).
Planning & Development
Economic Development; FCSS Ongoing
Partnership Projects: # of units or houses created through partnerships.
Town Land Utilized: # of Town-owned lots released for housing.
External Developer Interest: # of proposals or inquiries from regional developers.
Metrics Tracked: Vacancy rate, housing starts, etc., reported each year.
Target Vacancy: Achieve a residential rental vacancy around 3-5%.
Affordability: Maintain average housing cost-toincome ratio at healthy level (target: Westlock stays in top quartile of affordability among peer towns).
This page is intentionally left blank.

The Town of Westlock’s Comprehensive Economic Development Strategy (CEDS) was developed through collaboration, research, and engagement with a broad range of contributors who generously shared their time, knowledge, and perspectives.
The Town of Westlock would like to acknowledge and thank:
• Town of Westlock Council, for their leadership, direction, and commitment to longterm economic sustainability
• Town of Westlock Administration and Departments, for their technical expertise, operational insight, and cross-departmental collaboration
• Regional partners, including Westlock County and the Village of Clyde and regional organizations, for their cooperation and shared regional perspective
• Local businesses and employers, for their candid input on the opportunities and challenges facing the local economy
• Community organizations and service providers, for their contributions to understanding community needs and quality-of-life priorities
• Students and youth participants, whose perspectives on education, employment, and community life provided valuable insight into Westlock’s future workforce
• Stakeholders and participants who contributed through workshops, surveys, interviews, and background research