2022 Annual Report
For the year ended December 31, 2022.


For the year ended December 31, 2022.
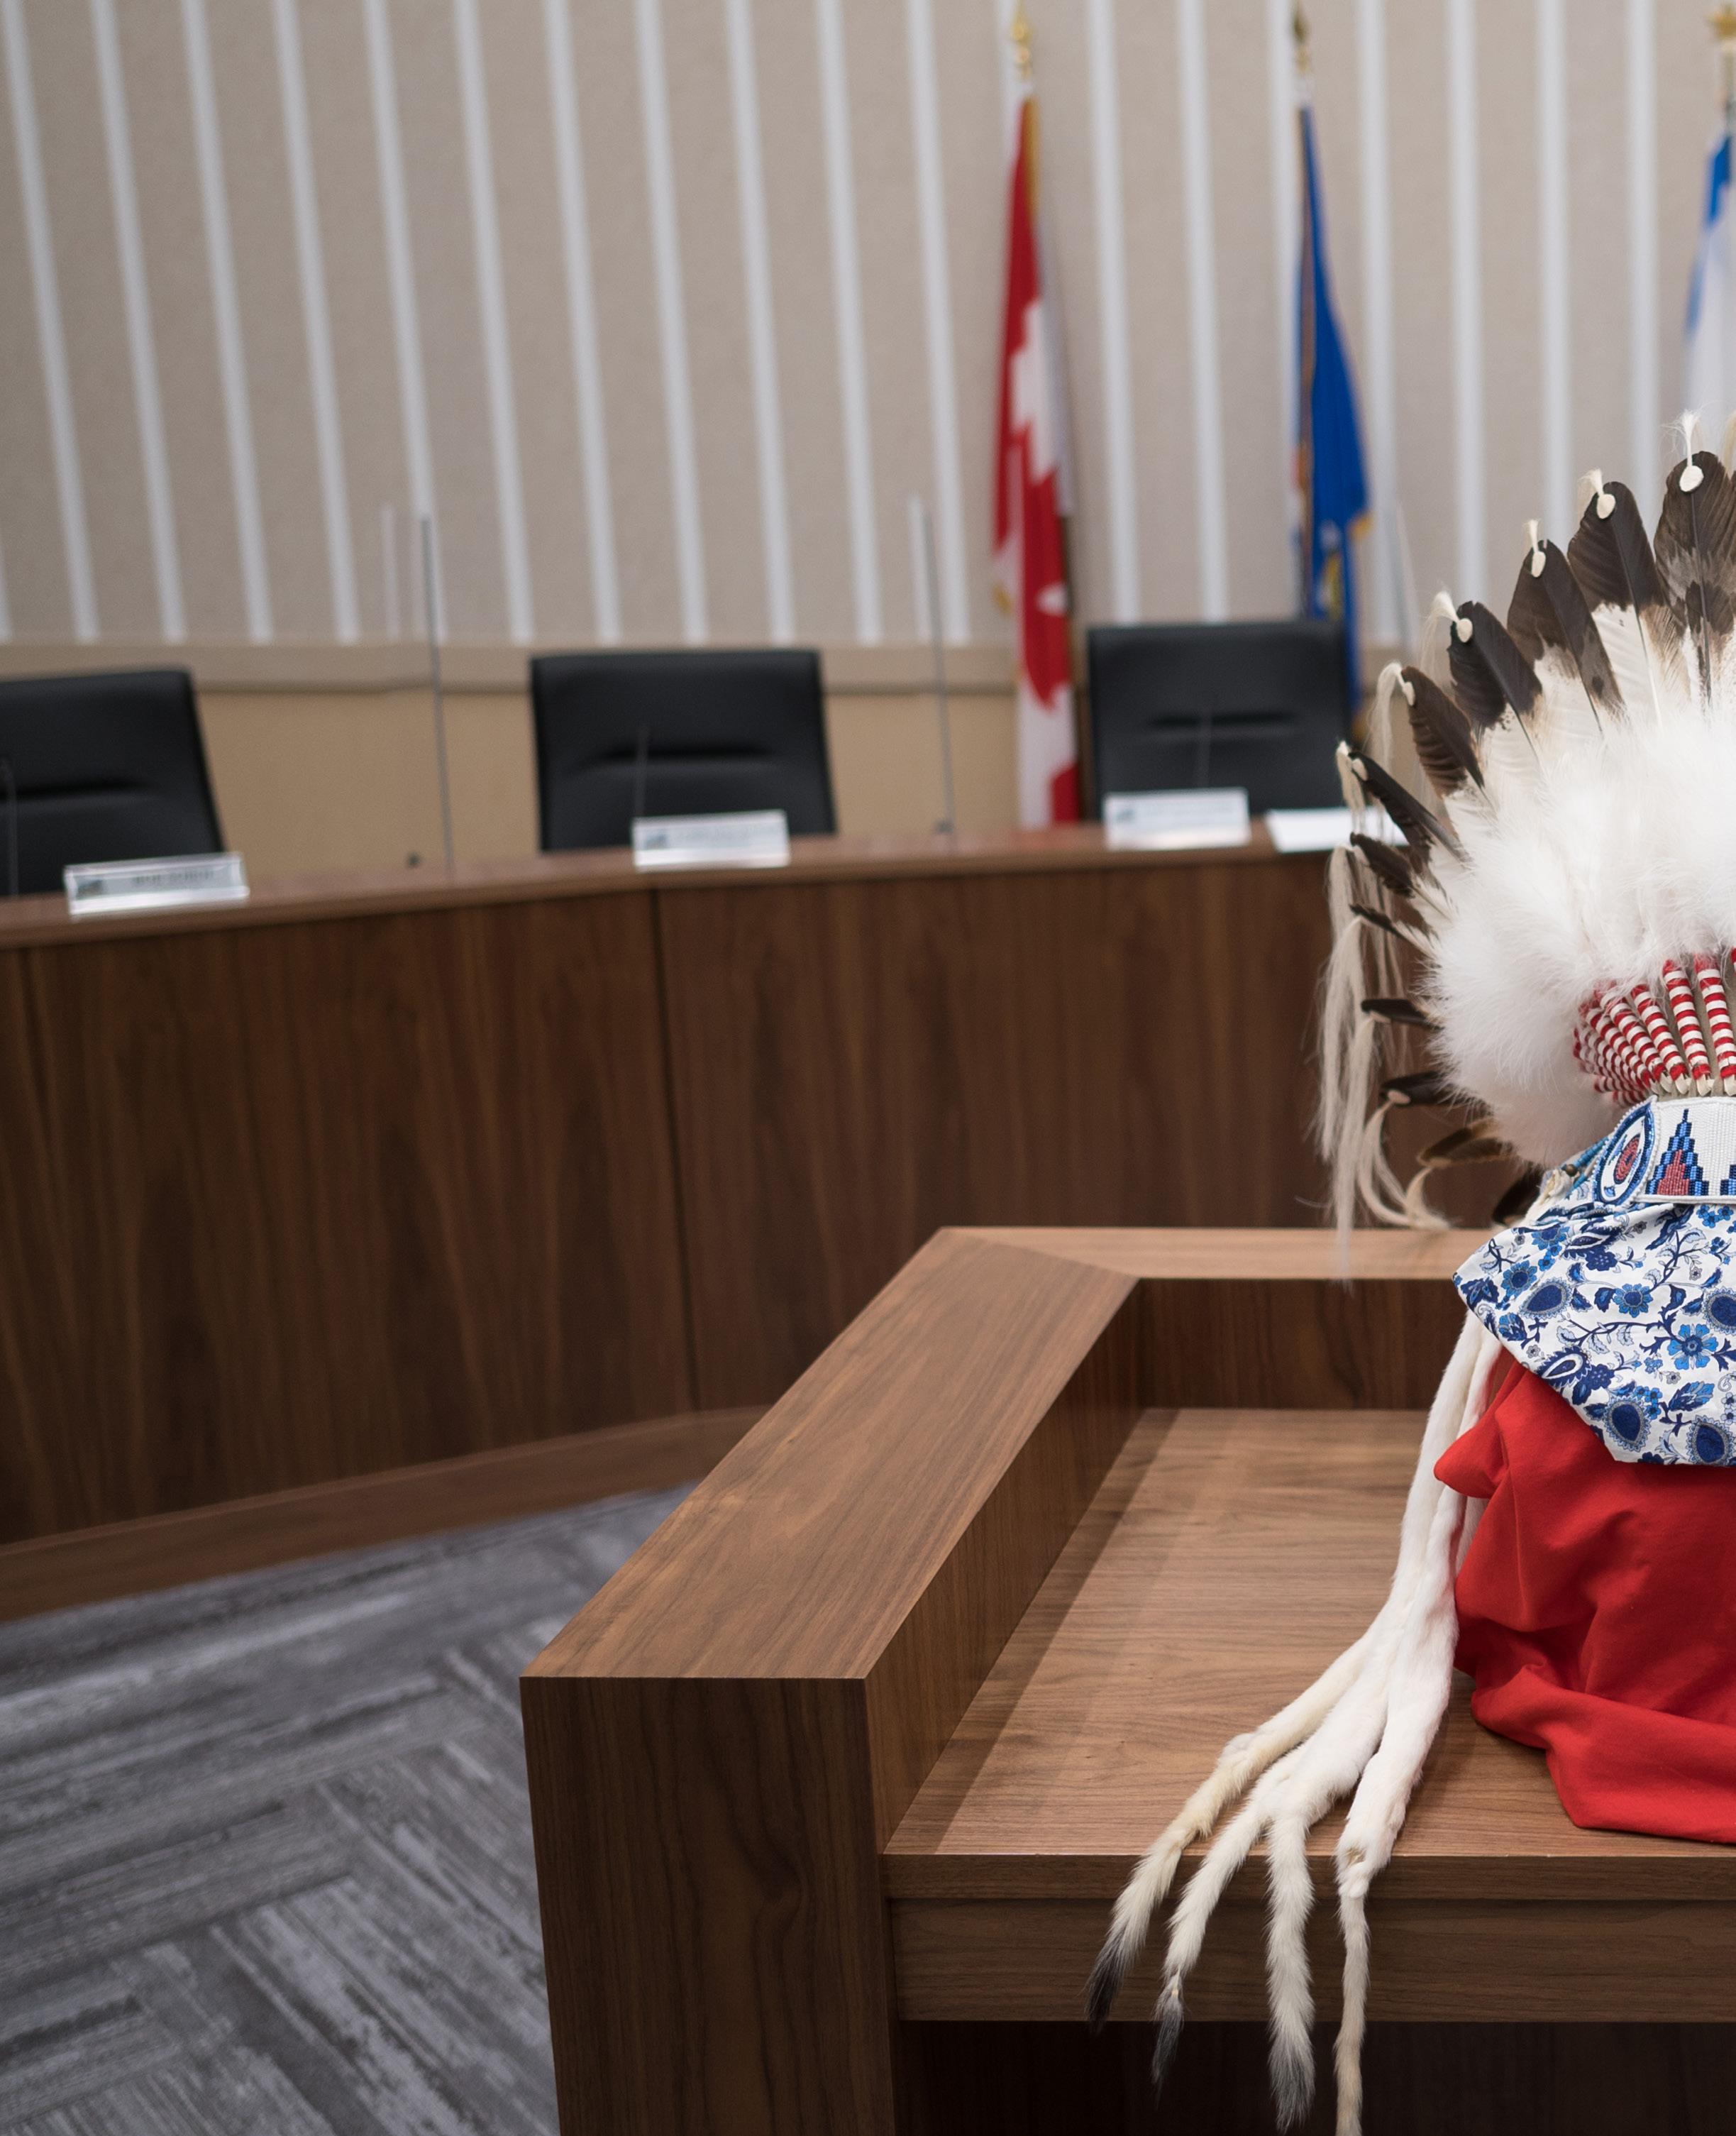
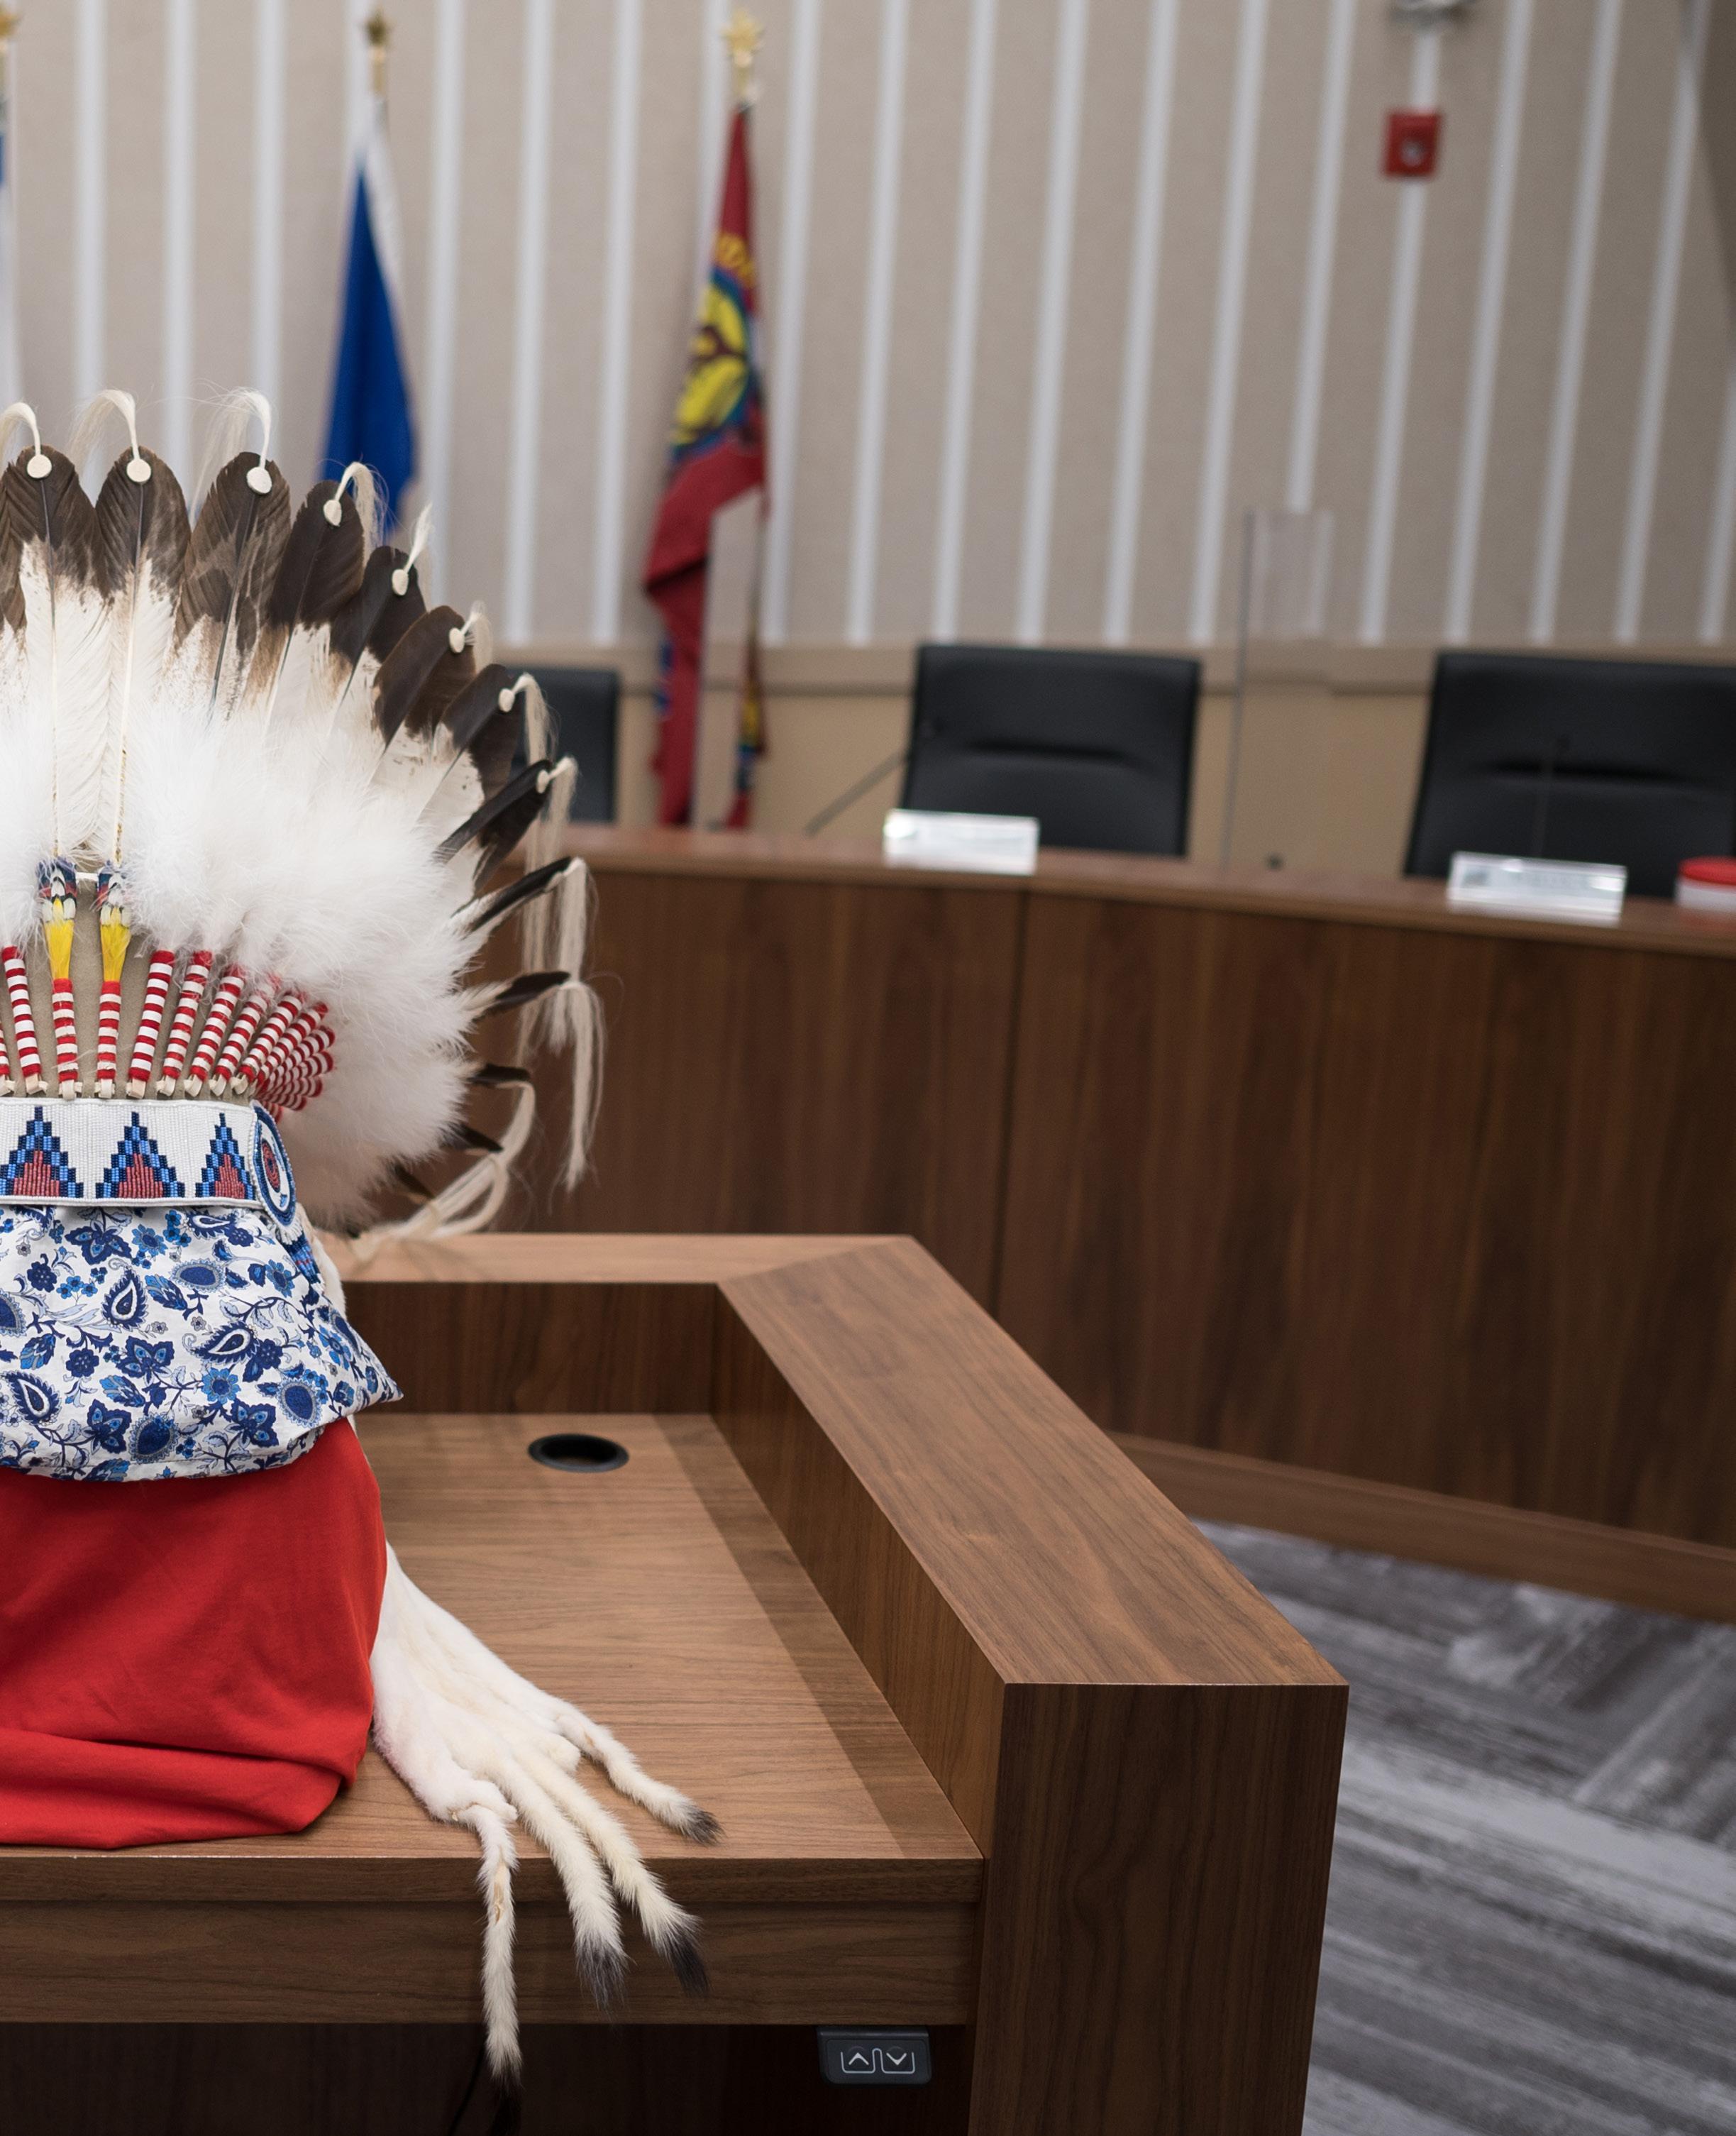
We honour all the many First Nations, Métis, and Inuit whose footsteps have marked these lands for centuries. We acknowledge that the ancestral and traditional lands on which we gather are land of the Blackfoot Confederacy. Treaty 7 territory is a traditional meeting ground for many Indigenous Peoples, and in particular our neighbors, Siksika Nation.
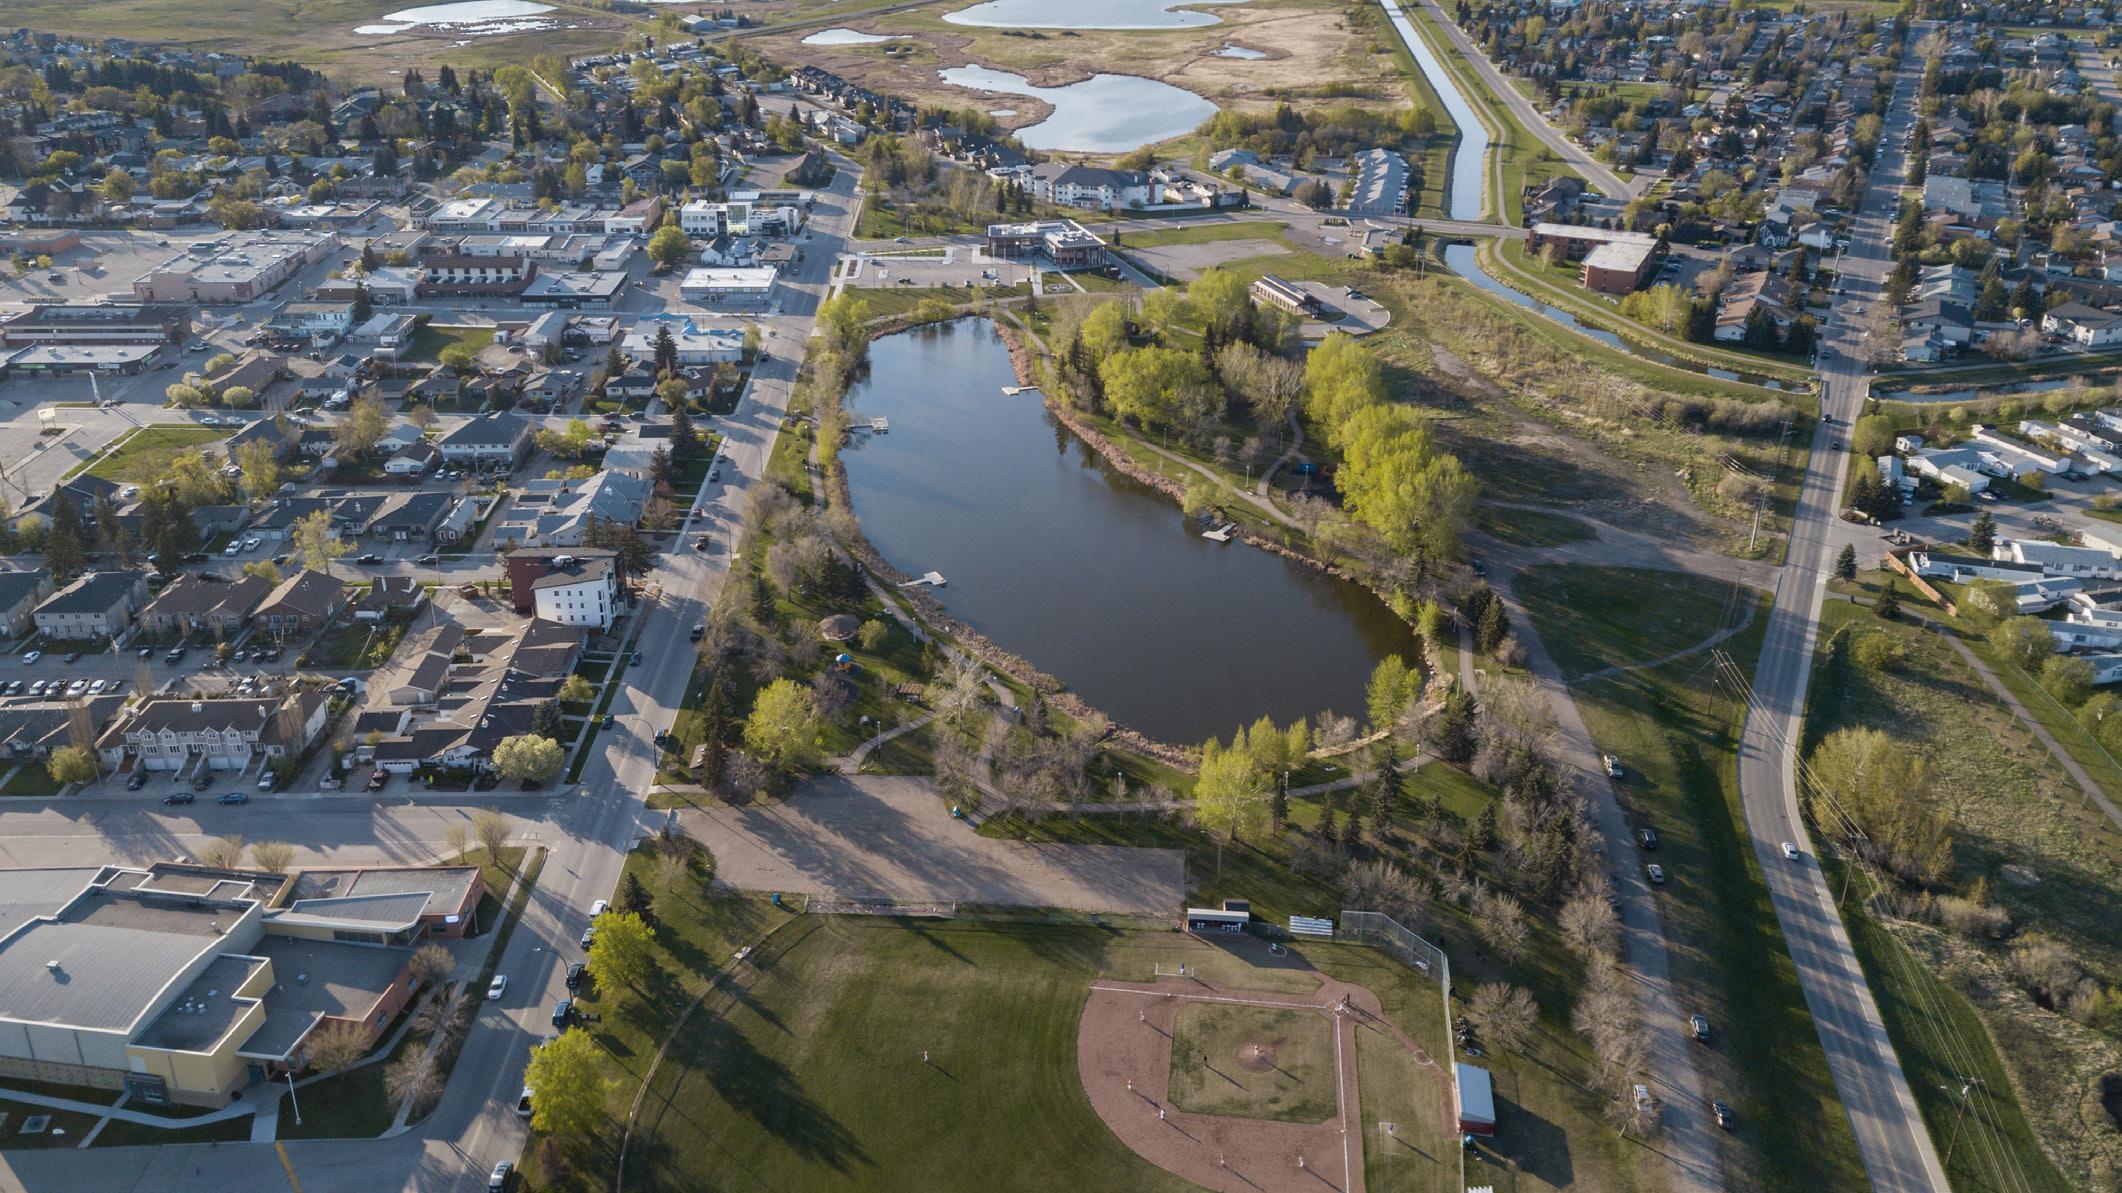
Strathmore residents count on their Town to deliver programs and services they rely on daily and to make Strathmore a great place to live, work and play. The Town of Strathmore is continuously working with its regional partners to help the region thrive and prosper while also addressing the challenges of rapid growth.
The governing body of the Town consists of an elected Town council, comprising a mayor and seven Councillors. Council is responsible for establishing policies, approving budgets, enacting bylaws, and providing guidance to the Chief Administrative Officer (CAO) who leads the administration. The CAO, often referred to as Town Manager, serves as Council’s sole employee and is responsible for the Town’s administration.
Under the direction of the CAO, the administrative staff plays a vital role in implementing Town Council’s strategic plan and delivering Town services to the public. Administration is composed of three departments which work together to manage interconnected activities and various aspects of the Town’s operations.
The Annual Report provides an overview of Strathmore’s financial position and financial activities in 2022. The report includes the consolidated financial statements for the Town of Strathmore, prepared in accordance with the standards established by the Public Sector Accounting Board of the Canadian Institute of Chartered Accountants, and audited by independent external auditors. The financial statements and auditors’ report satisfy a legislative reporting requirement as set out in the Municipal Government Act of Alberta.
Disclaimer
All care has been taken to ensure content is complete and accurate. However, Council does not guarantee it is without flaw. There may be errors and omissions or it may not be wholly appropriate for your particular purposes. In addition, the publication is a snapshot in time based on historic information which is liable to change. The Town of Strathmore accepts no responsibility and disclaims all liability for any error, loss, or other consequence which may arise from you relying on any information contained in this report.

14,339 people call Strathmore home
10.3% residents born outside of Canada
Main countries of origin include: Phillipines, United Kingdom, United States of America, India, Germany, Netherlands
6.5% residents identify as indigenous
1,283
79% residents spend less than 30% of income on shelter costs
37% residents hold a postsecondary certificate, diploma, or degree
Top fields of study:
• Health professions and related programs
• Business, management, marketing and related support services
• Education
• Engineering/engineering-related technologies/technicians
Top industries amongst residents:
• 14% retail trade
• 12% health care and social assistance
• 9% construction
• 8% educational services
• 6% accommodation and food services
• 6% professional, scientific and technical services
Resident’s commutes
• 15% work from home
• 52% within Strathmore
• 12% to other locations within Wheatland, Kneehill, Vulcan County, Starland County
• 34% to other location within Alberta
• 1.25% to other provinces or territories
In October 2021, I was proud to be re-elected as your mayor. I am incredibly honoured to have served the people of Strathmore for more than 30 years as a teacher, as a Councillor, and now as a second-term Mayor. Over that time, I have seen extraordinary change.
The past three years alone have presented us with significant challenges, but we have faced them head-on, demonstrating Strathmore’s resilience and determination. As we look to the future, I recognize that there will be more obstacles to navigate, yet I firmly believe that alongside these challenges, there are abundant reasons for optimism and opportunities to seize.
In January 2022, we welcomed our newest resident and a valuable addition to our community, Kevin Scoble, as Strathmore’s new CAO. While Kevin may be new to the Town, he is certainly no stranger to the area or the responsibilities that come with his new role. Having grown up in Southern Alberta, Kevin later ventured North, spending two decades in senior leadership positions in Fort McMurray and St. Albert.

With the expertise and dedication of the Town’s staff and the collective efforts of our community, my fellow Councillors and I are confident that we will navigate the challenges that lie before us and continue to build a brighter future
for Strathmore. Our town has always shown resilience and a spirit of progress, and together, I can’t wait to see where our many opportunities take us.
As we celebrate the achievements of 2022 through this annual report, the next year fills me with excitement as our strong government partnerships and strategic planning will see several major projects and initiatives delivered, ensuring that Strathmore remains a vibrant and thriving place to live, work, and raise families.
On behalf of Council, I extend my deepest gratitude to the residents of Strathmore for your unwavering support and trust. It is a profound privilege to serve as your mayor.
With sincere appreciation and boundless optimism,
Pat Fule Mayor of StrathmoreIt is with great pleasure and a sense of homecoming that I present the Town of Strathmore’s 2022 Annual Report.
It hasn’t taken long for me to witness firsthand the unwavering passion and deep-seated affection that residents hold for their town. Strathmore is not just a collection of streets and buildings; it is an embodiment of values, heritage, and the spirit of Southern Alberta that flows through the veins of every resident.
I’d like to acknowledge the support of Mayor and Council during the onboarding process of their new CAO. Despite being a relatively new Council themselves, progress didn’t slow.
This Council has injected enthusiasm and vision across a number of fronts and certainly there has been a continuation of Strathmore’s growth in 2022. This year was about building the foundational principles of good governance and organizational resilience needed to align staff and all resources to deliver on Council’s ambitious goals.
One of the first things this new council did was engage with our community and set a vision for their term as part of Strathmore’s Strategic Plan. The investments and complex decisions they make today will lay a strong foundation for our growing community to build upon in the future.
Once Council’s Strategic Plan was set, my team and I put Council’s priorities into action, providing professional advice and recommendations on items for decision, and ensuring that a high level of customer service is maintained for the residents of Strathmore.

I am very proud of the efforts of staff in delivering on the vision and direction of Council.
Over this term, your administration’s priority is to honor the legacy of this remarkable town and to serve as steadfast stewards for its future. My staff and I are committed to collaborating with our residents, businesses, and community organizations to ensure that Strathmore continues to be a place that we can all be proud to call home.
Yours in service,
Kevin Scoble Chief Administrative OfficerThe Town of Strathmore has one mayor and six Councillors that serve a four year term. Each Councillor is elected on an ‘at large’ basis, meaning they aren’t elected on a geographic basis or in a ward. Each Councillor is available to any resident who wishes to discuss an issue.

Each member has one vote and together make up Town Council, the governing body of the Town of Strathmore. Town Council was elected by residents on October 18, 2021. We welcomed four new Councillors, and the return of Mayor Pat Fule and 2 serving Councillors elected for another four year term.
The Mayor is the Chief Elected Official of the municipality and has duties as both Councillor and Mayor. The Chief Administrative Officer (Town Manager) of the Town is in charge of day-to-day Town operations and employees. The principle role of Council is to adopt budgets and create policy for the governance of the town and its residents.


Strathmore’s corporate structure facilitates a high performing, innovative, and resident focused organization marked by great people, good governance, and strong leadership. Council’s senior management, under the direction of the Chief Administrative Officer, provides leadership and direction to progress the strategic outcomes determined by Council, as well as ensuring excellence in local government services.
Service profiles include:
• Business Performance and Improvement

• Council and Committee Services
• Economic Sustainability
• Human Resources
• Investment Attraction
• Organizational Culture and Development
• Safety and Wellbeing
• Senior Leadership Support
• Strategic Initiatives and Partnerships
• Strategic Organizational Planning
KEVIN SCOBLE CHIEF ADMINISTRATIVE OFFICER Town of Strathmore Staff, 2022
Service profiles include:
• Communications
• Events
• Financial Management
• Geographic Information Systems
• Information Technology
• Legislative Services
• Marketing
• Records Management
• Resident Experience
• Risk Management
• Taxation and Assessment
JAMIE DUGDALE DIRECTOR

INFRASTRUCTURE, OPERATIONS, AND DEVELOPMENT SERVICES
Service profiles include:
• Asset Management
• Building Maintenance
• Development Services
• Fleet Management
• Infrastructure Design and Delivery
PRETZLAFF DIRECTOR• Land Use
• Operations
• Parks and Open Spaces
• Roads and Pathways
• Waste and Recycling
• Water and Stormwater Services
COMMUNITY AND PROTECTIVE SERVICES
Service profiles include:
• Arts and Culture
• Community Development
• Community Health and Wellbeing
• Emergency Management
• Facility Management
• Family and Community Support Services (FCSS)
• Fire Department
• Indigenous Relations
• Municipal Enforcement
• Recreation and Leisure
MARK Town of Strathmore Staff, 2022


The Chief Administrative Officer (CAO) of the Town of Strathmore is appointed by Council to manage and direct all Town employees and operations. This role oversees the overall administration of the Town’s departments and provides leadership and direction to the Senior Leadership Team.
The CAO is responsible for enacting Council policies and directives, providing input and advice to Council on policy related issues, and assisting Council in setting corporate goals.
The CAO also provides advice on local governance as well as the authority and responsibilities municipalities have under the Municipal Government Act, Freedom of Information and Protection of Privacy Act (FOIP Act), and Municipal Finance Authority Act
In addition to providing leadership and direction to the Town’s three directors, Strathmore’s CAO also guides the organizations Human Resources and Economic Sustainability and Investment Attraction teams.
Your Economic Sustainability and Investmet Attraction team works on programs, policies or activities that seek to improve the economic well-being and quality of life for our community. This team is responsible for things like business retention and expansion, talent and investment attraction, government and association partnerships, and tourism.
The Town’s Human Resources team is responsible for developing strategic solutions to employment-related matters that affect the organization’s ability to meet its productivity and performance goals. HR works to create a culture of employee empowerment and recognition while strengthening the employer-employee relationship. The team consists of Human Resources and Payroll, plus the Health and Safety function.
Strathmore’s Strategic, Administrative, and Financial Services team is responsible for reporting the Town’s financial position, manging it’s risk, supporting the legislative function of the Town, administering it’s information and communication technology, maintaining a strong brand image, and communicating with our community and stakeholders including residents and ratepayers, local business owners, potential investors, community groups, government agencies, funding bodies, and present and future staff.
The SAFS team consists of five departments: Finance, Information Technology, Legislative Services, Marketing and Communications, and Risk Management.
Your Finance team provides financial expertise, advice, and administration to support the Town’s operations. Many finance functions are necessary to meet statutory requirements as set out in the Municipal Government Act. These statutory requirements focus on the accounting, reporting, and safeguarding of taxpayers’ money and other assets. The Finance team ensures that all requirements are met. In addition, ongoing support is provided to Town Council and staff, and customer service is provided to the public. Some of this team’s functions include, preparing the Operating and Capital Budgets, levying and collecting property tax and utility billing, and overseeing procurement processes.
Your Information Technology team provides the sustained, efficient, and effective delivery of IT services. The IT Team leads the Town in technology, partnering with all other Town departments to help them achieve their business and corporate objectives, and enabling them to provide services to our community. Some of this team’s functions include, network, CCTV, and telecommunication infrastructure support, server maintenance and system integration, project management, application support, audio video management, and geographic information systems (GIS)
Your Legislative Services team manages the processes that support and expedite decision-making by Town Council. This team is responsible for things such as administering FOIP protocols, providing legislative guidance and direction, preparing and preserving records of the official business of the corporation, including bylaws, minutes of Council and Committee meetings, and Council policies.
The Town of Strathmore consistently provides timely and accurate news and information to it’s numerous stakeholders. Your Marketing and Communications team is responsible for things such as marketing and advertising all town-related programs, projects, services, and events; disseminating information through the media; managing communications in an emergency response; creating and maintaining a clear identity for Strathmore; and providing photography, copy, graphic design, and video production services to internal departments.
Your Risk Management team works with all Town departments regarding claims, insurance, and risk. The Team investigates and manages claims made by or against the Town of Strathmore, manages it’s insurance portfolio, manages contracts, and provides support to Town staff to minimize risk.
Strathmore’s Infrastructure, Operations, and Development Services team plans and maintains the Town of Strathmore’s infrastructure assets, ensuring essential services are available when needed by the community. The department delivers municipal services to provide a high quality of life for residents and businesses, focusing on the environment, sustainability, and fiscal responsibility.
The IODS team consists of five departments: Asset Management, Development Services, Infrastructure, Operations, and Parks.
Your Asset Management team aims to maximize the value of Town-owned assets for the community’s benefit. They focus on reducing operational costs, optimizing asset utilization, improving performance, and helping the Town make informed decisions regarding acquisitions, disposals, and risk management for infrastructure growth.
Your Development Services team is responsible for managing the growth and development of Strathmore while also helping to maintain the quality of life enjoyed by residents. This team provides a centralized, coordinated, one-stop service for all development applications, queries, building permits, issuing business licences, and ensuring a consistent application of policies and legislation relating to land development that reflects the community’s vision.
Your Infrastructure team is responsible for the planning, design, and construction project management of many of the Town’s capital projects, which includes things like transportation infrastructure, traffic control, water and waste infrastructure, and commuter paths, and bridges.
Your Operations team provides proactive and responsive operation and maintenance of Town-owned assets, which includes over 160 kilometres of roadways, over 32 kilometers of pathways, and multiple Town buildings. The team carries out snow removal as per the Winter Road, Pathway, and Sidewalk Maintenance Policy.
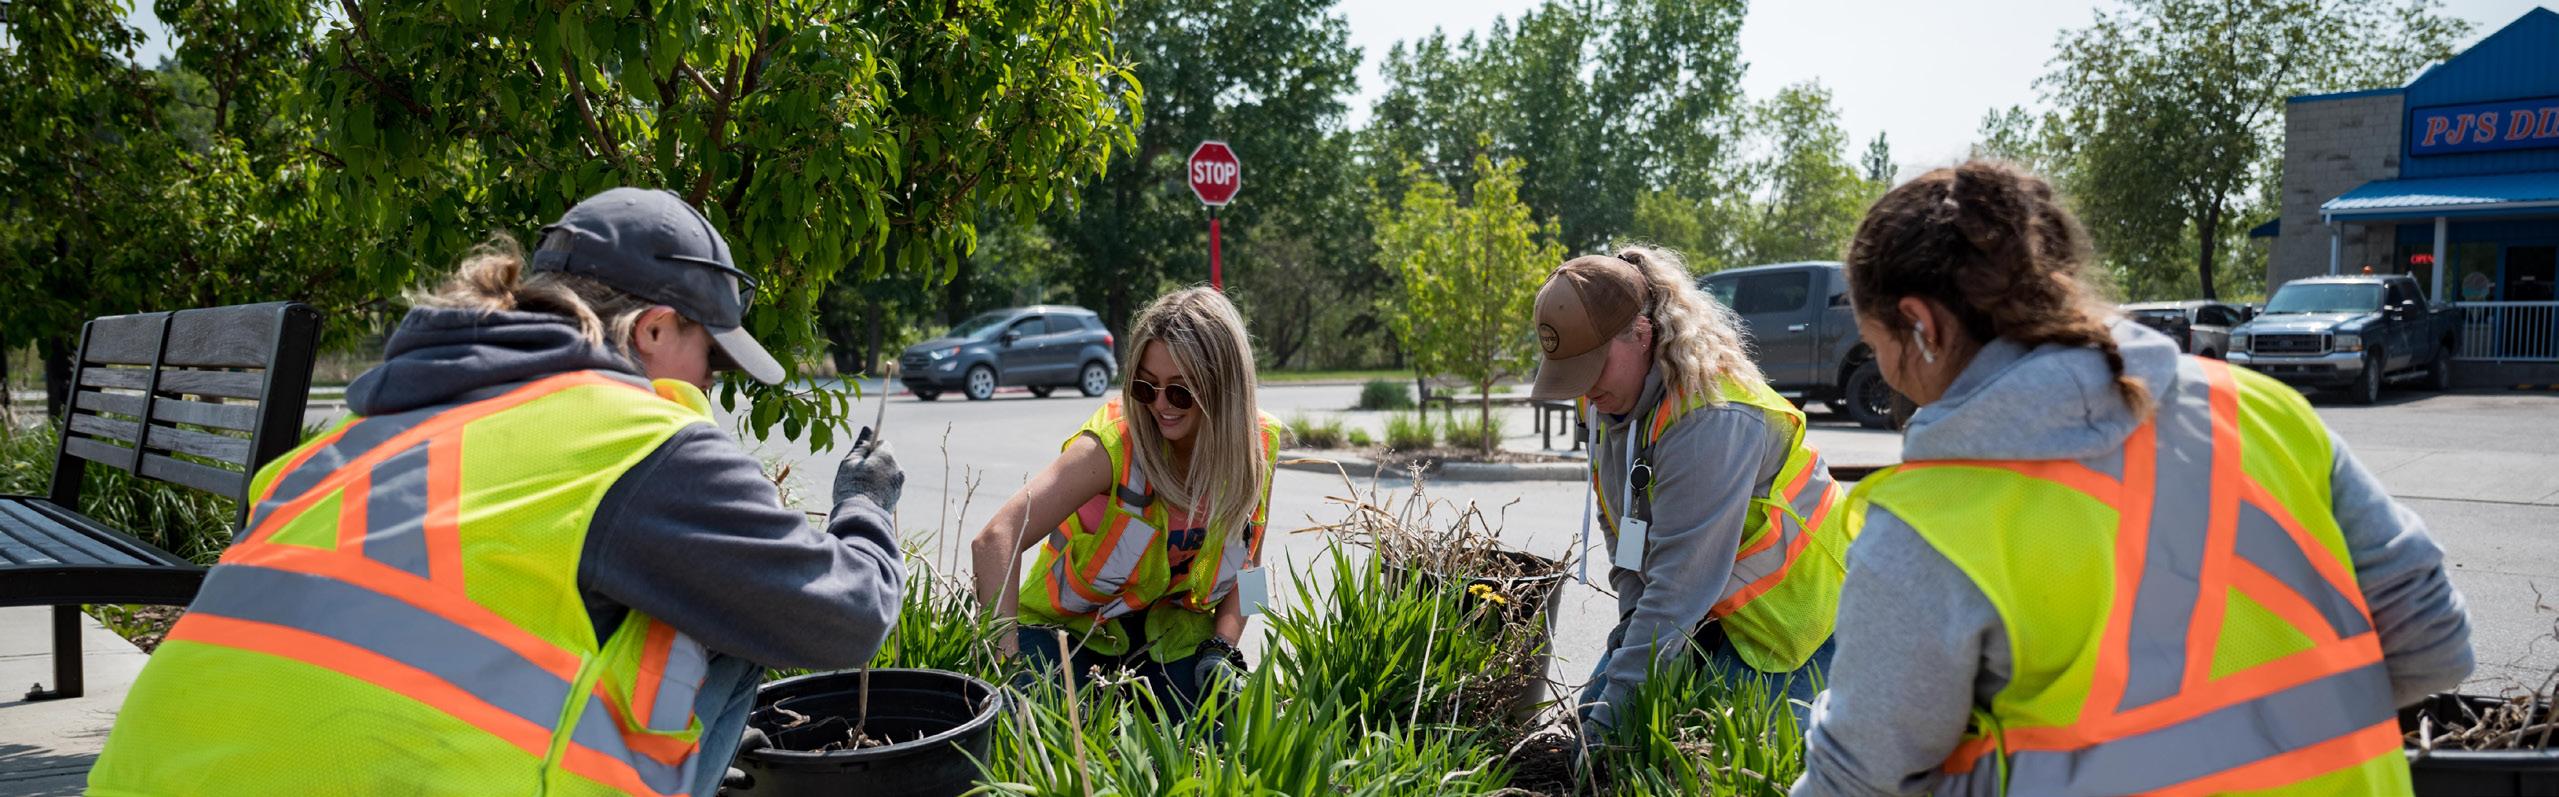
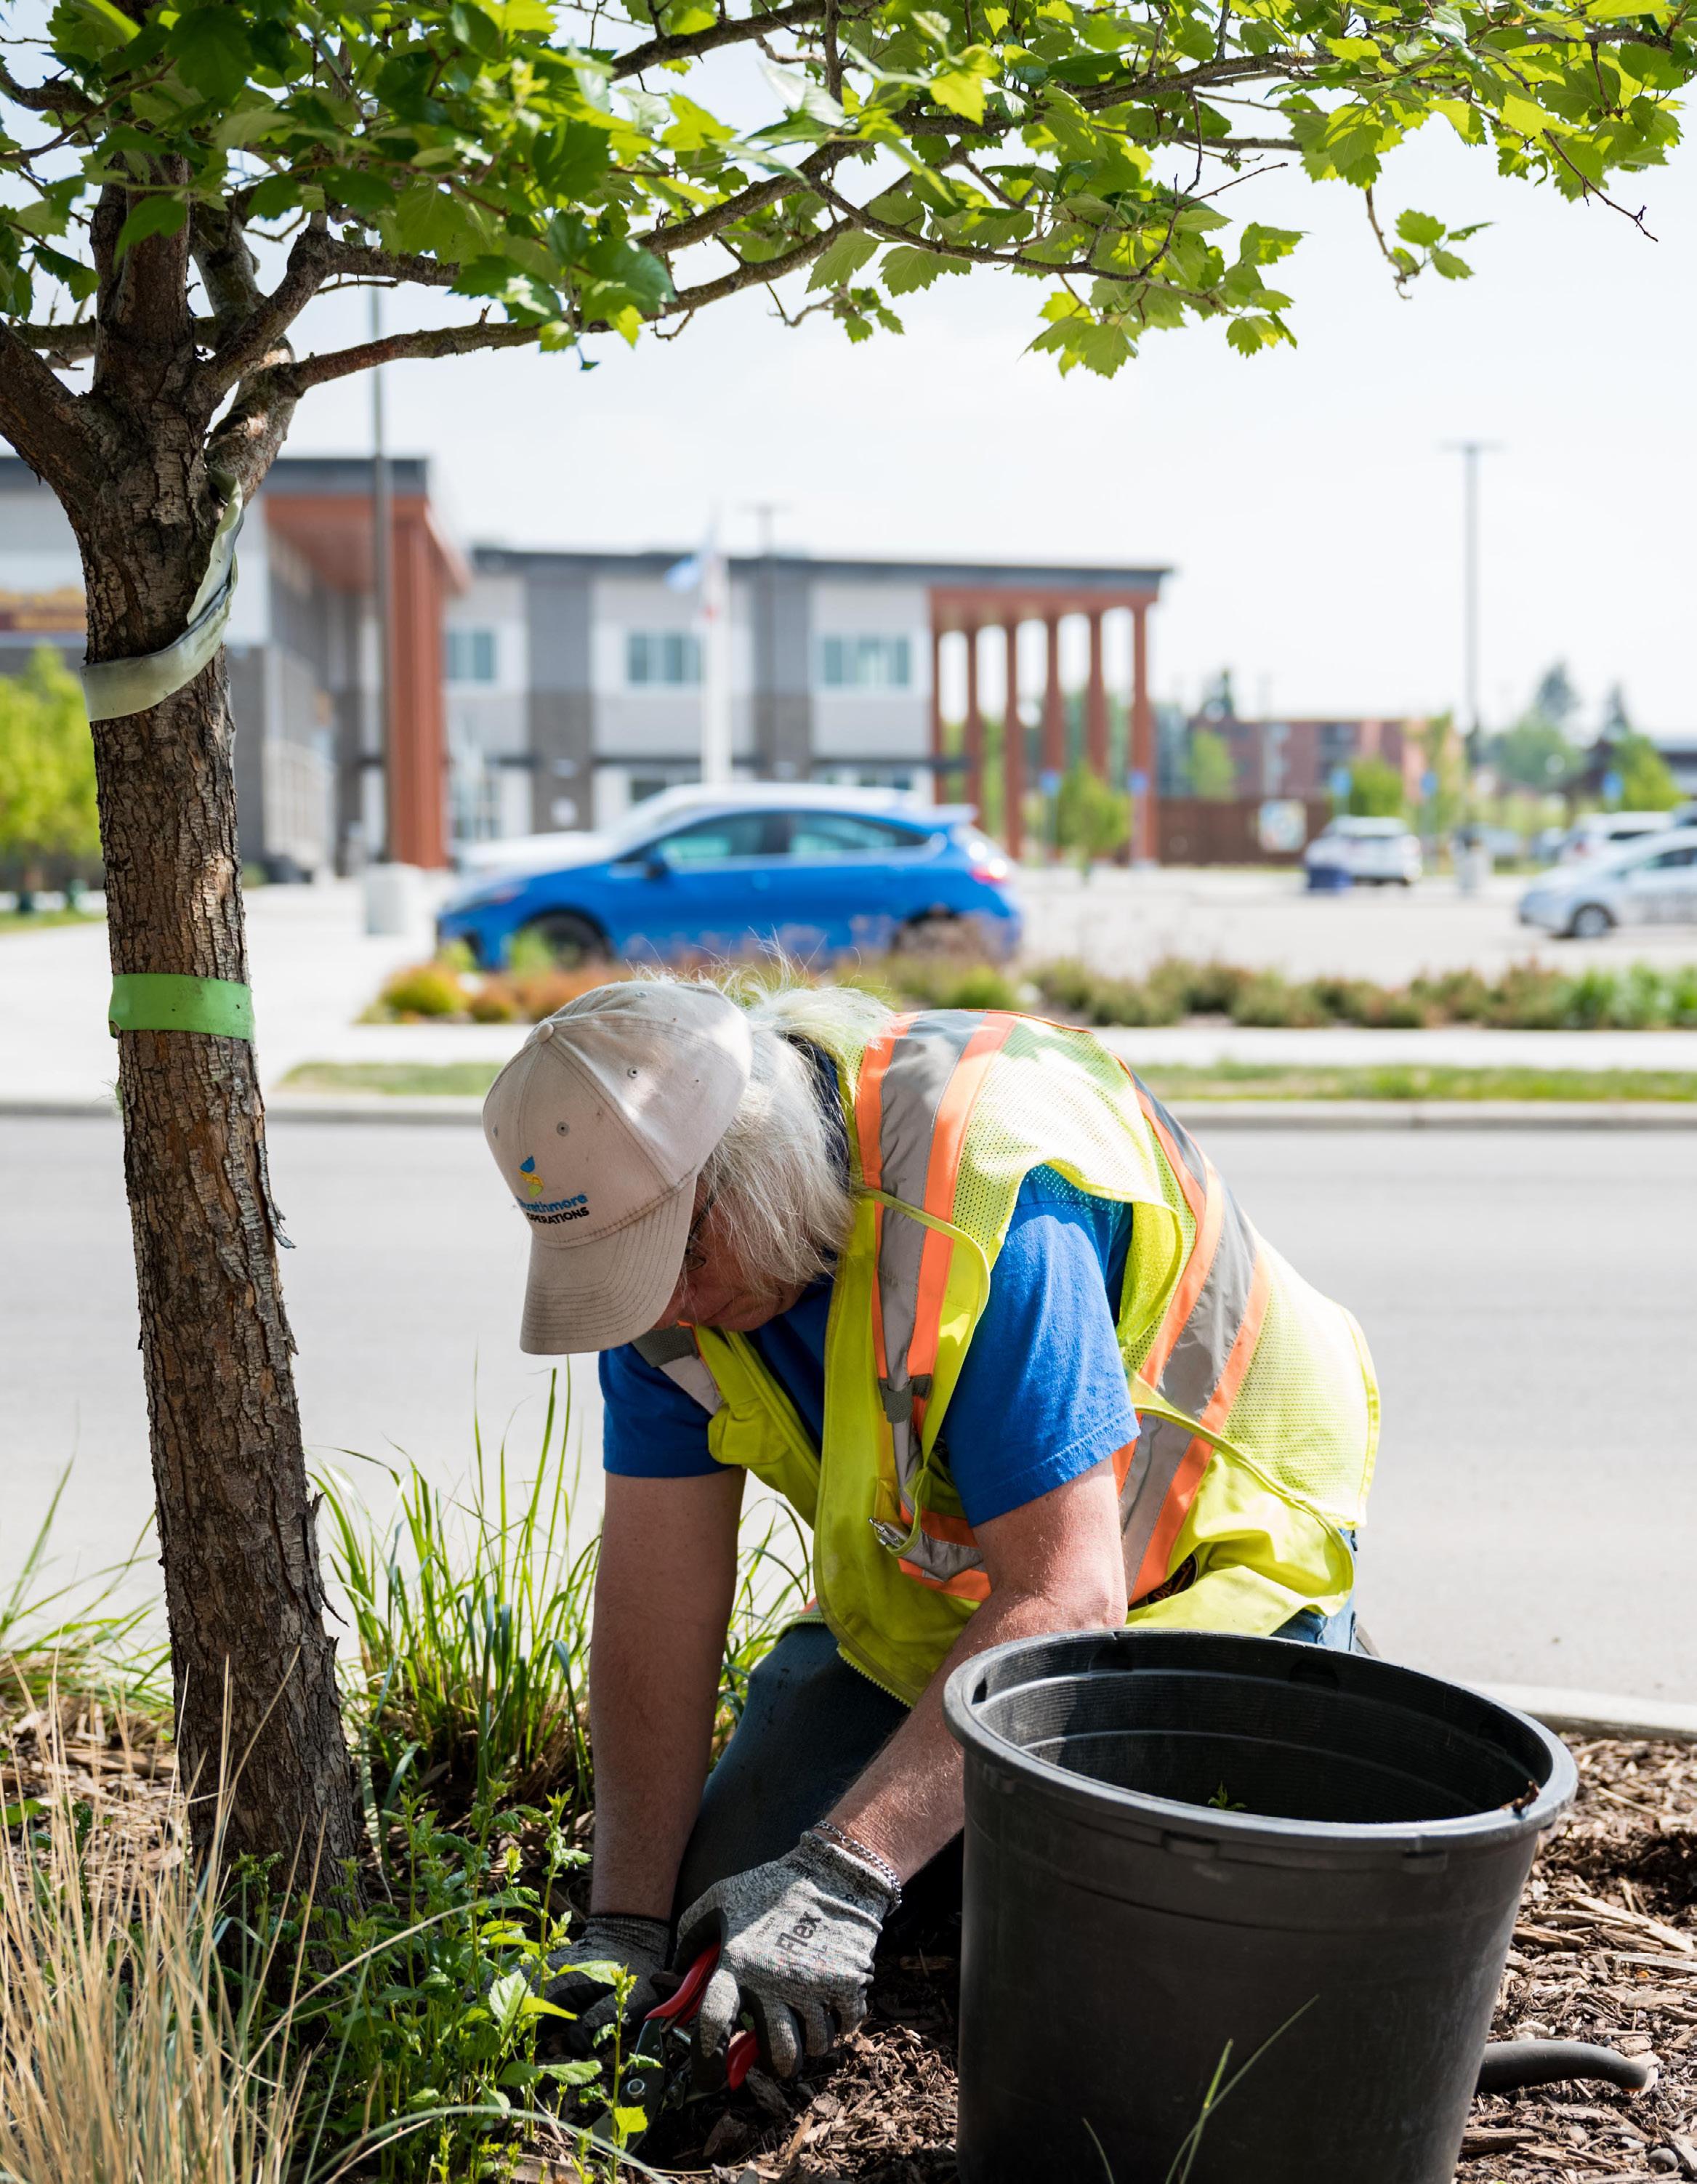
Your Parks team develops, schedules and carries out maintenance and beatutification programs for Town parks, which includes parks administration, maintenance contracts, horticulture, arboriculture, turf, management, and irrigation.

Strathmore’s Community and Protective Services team provides programs and services that help create a healthy, active community. This team manages recreation activities and facilities, fire and emergency services, bylaw enforcement, and Strathmore’s social services.
The CAPS team consists of four departments: FCSS (Family, Community, and Support Services), Municipal Enforcement, Recreation and Culture, and the Strathmore Fire Department.
Your FCSS team promotes and enhances the well-being of Strathmore residents, families, and communities. FCSS programs are intended to help individuals adopt healthy lifestyles, improve their quality of life, and build capacity to prevent and deal with crisis situations should they arise.
Your Municipal Enforcement team supports a safe and healthy environment for the residents of Strathmore. Through education and enforcement, they help uphold community standards and expectations. Strathmore’s Municipal Enforcement officers use an educational approach to resolve infractions whenever possible and are committed to providing quality customer service.
Your Recreation and Culture team fosters a healthy community through programs, activities and events aimed at improving the fitness and wellness of residents and visitors. This active team plays an important role in building a healthy, vibrant community, and are responsible for the operation of the Aquatic Centre, Family Centre, and the Strathmore Motor Products Sports Centre.
Your Strathmore Fire Department provides a variety of pre-emptive and educational services to keep our community aware and safe. Some of the services they provide include emergency response for fire suppression, extraction, medical assistance, water and ice rescue, and HAZMAT type scenarios.


Expenses By Segment (in thousands of dollars)


For the year ended December 31, 2022

A Key Performance Indicator (KPI) is a metric used to evaluate factors that are crucial to the success of an organization. The importance of each KPI may change with time depending on the goals and strategic plans of the organization.
When reviewing KPIs, it is important to not only compare to past performance and desired goals, but to consider industry standards and benchmarks.
The following information has been provided in order to provide you some insight into some important KPIs for your organization.
It is important to review the underlying information of your municipality in order to determine cause and create desired change.
The underlying data for this report was taken from the financial data publicly available found on the Alberta Municipal Affairs website.
Comparable municipalities were determined based on a range of 75% to 125% of your population.
For the year ended December 31, 2022
Assets to Liabilities
This indicator illustrates the extent a government finances its operations by issuing debt. A ratio higher than one indicates that a government has accumulated surplus and has assets greater than debt. A ratio of less than one indicates that debt is greater than assets and the government has been financing its operations by issuing debt.
This indicator illustrates the ratio of a government's financial assets to its liabilities. A result lower than one indicates a net debt position and future revenues will be required to pay for past transactions. A result higher than one indicates net financial assets and financial resources are on hand that can finance future operations. A trend showing increases in net debt or reductions in net financial assets may not be sustainable.

Net debt provides a measure of the future revenue required to pay for past transactions. A ratio that is increasing would indicate that more time to eliminate net debt will be necessary.
This indicator shows the relationship between net debt and the activity in the economy. If the ratio declines, government debt is becoming less onerous on the economy. A stable ratio indicates overall fiscal policies have been sustainable, and the rate of economic growth is the same as the growth in net debt. If the ratio rises, net debt is becoming more onerous on the economy, which may not be sustainable. This may prompt a decision to increase taxes or reduce program expenses.
For the year ended December 31, 2022
This indicator provides the trend of government spending over time in relation to the growth in the economy. A trend that shows total expense is growing at a faster rate than the growth in the economy may not be sustainable.
This indicator measures public debt charges as a percentage of revenues. It illustrates the extent to which past borrowing decisions present a constraint on the ability to meet financial and service commitments in the current period. Specifically, the more a government uses revenues to fund debt servicing, the less will be available for program spending.
For the year ended December 31, 2022
The total amount of municipal borrowings, including long term capital leases, as a percentage of total municipal revenues. This indicator demonstrates the growth in revenue compared to changes in debt. An increasing trend would indicate the municipality is increasing its debt load faster than its revenue is growing, which may not be sustainable.
This indicator is important because it reports the extent that the estimated useful lives of tangible capital assets are available to provide its services. If a government's scale, scope and level of services remain unchanged or grow, its asset base could eventually impair flexibility because of the impending future costs of capital asset repair or replacement.
For the year ended December 31, 2022
For the year ended December 31, 2022
The total cost of annual additions (through purchases or construction) to tangible capital assets (vehicles, equipment, buildings, roads, utility infrastructure, land) relative to the annual amortization (depreciation) on all tangible capital assets - measured as a fiveyear average.
This indicator is important because it shows the ratio of a local government's own source revenues to its tax base. A change in the size of a local government's taxable assessment or a change in the rate of growth in assessment in relation to changes in own source revenues could influence flexibility.
For the year ended December 31, 2022
Government transfers to total revenues
The purpose of this ratio is to show the proportion of revenues that provincial or local governments receive from other governments. This indicator offers a perspective on the degree of vulnerability a government faces as a result of its dependence on another level of government for revenues.
OTHER INDICATORS
Accumulated surplus available for future use
Accumulated surplus, to the extent it has not been invested in Tangible Capital Assets, represents overall surplus that is available for future use. This consists of unrestricted surplus and reserves and shows trends in spending vs. saving. This indicator only shows total surplus; the overall size of the municipality is not taken into account.
Total Town Count: 105
Comparables - Same Type (4)
Comparables were determined on a range of 75% to 125% of your population Town list with a comparable population
Comparables - Any Type (15) List used for comparable populations
BONNYVILLE NO. 87, M.D. OF HIGH RIVER BROOKS
CANMORE
STRATHMORE
SYLVAN LAKE
CANMORE
CLEARWATER COUNTY
COLD LAKE
HIGH RIVER
LAC STE. ANNE COUNTY
LACOMBE
LEDUC COUNTY
MACKENZIE COUNTY
MOUNTAIN VIEW COUNTY
STRATHMORE
SYLVAN LAKE
WETASKIWIN
WETASKIWIN NO. 10, COUNTY OF