Inte rgove rnme ntal Re ve nue s
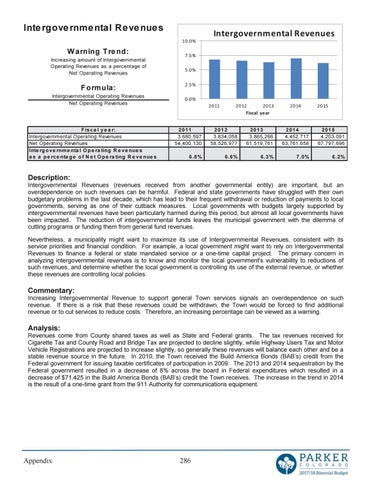
Intergovernmental Revenues 10.0%
W arning T re nd: Increasing amount of Intergovernmental Operating Revenues as a percentage of Net Operating Revenues
F ormula: Intergovernmental Operating Revenues Net Operating Revenues
F is c a l y e a r: Intergovernmental Operating Revenues Net Operating Revenues Inte rg o v e rnm e nta l O p e ra ting R e v e nue s a s a p e rc e nta g e o f N e t O p e ra ting R e v e nue s
7.5% 5.0% 2.5% 0.0% 2011
2012 2013 Fiscal year
2014
2015
2011 3,680,597 54,400,130
2012 3,834,058 58,526,977
2013 3,865,266 61,519,761
2014 4,452,717 63,761,658
2015 4,203,091 67,797,696
6 .8 %
6 .6 %
6 .3 %
7 .0 %
6 .2 %
Description: Intergovernmental Revenues (revenues received from another governmental entity) are important, but an overdependence on such revenues can be harmful. Federal and state governments have struggled with their own budgetary problems in the last decade, which has lead to their frequent withdrawal or reduction of payments to local governments, serving as one of their cutback measures. Local governments with budgets largely supported by intergovernmental revenues have been particularly harmed during this period, but almost all local governments have been impacted. The reduction of intergovernmental funds leaves the municipal government with the dilemma of cutting programs or funding them from general fund revenues. Nevertheless, a municipality might want to maximize its use of Intergovernmental Revenues, consistent with its service priorities and financial condition. For example, a local government might want to rely on Intergovernmental Revenues to finance a federal or state mandated service or a one-time capital project. The primary concern in analyzing intergovernmental revenues is to know and monitor the local government's vulnerability to reductions of such revenues, and determine whether the local government is controlling its use of the external revenue, or whether these revenues are controlling local policies.
Commentary: Increasing Intergovernmental Revenue to support general Town services signals an overdependence on such revenue. If there is a risk that these revenues could be withdrawn, the Town would be forced to find additional revenue or to cut services to reduce costs. Therefore, an increasing percentage can be viewed as a warning.
Analysis: Revenues come from County shared taxes as well as State and Federal grants. The tax revenues received for Cigarette Tax and County Road and Bridge Tax are projected to decline slightly, while Highway Users Tax and Motor Vehicle Registrations are projected to increase slightly, so generally these revenues will balance each other and be a stable revenue source in the future. In 2010, the Town received the Build America Bonds (BAB’s) credit from the Federal government for issuing taxable certificates of participation in 2009. The 2013 and 2014 sequestration by the Federal government resulted in a decrease of 8% across the board in Federal expenditures which resulted in a decrease of $71,425 in the Build America Bonds (BAB’s) credit the Town receives. The increase in the trend in 2014 is the result of a one-time grant from the 911 Authority for communications equipment.
Appendix
286