Property Market Update
MAY 2023

While property markets on the eastern seaboard have experienced significant declines over the past year, Adelaide real estate continues to defy the trend.
The latest CoreLogic report shows that dwelling values in Sydney, Brisbane and Melbourne have dropped by 10.7 per cent, 9.8 per cent and 8.9 per cent respectively over a 12-month period.
In contrast, Adelaide property prices have increased by 1.3 per cent over the same period. Perth is the only other capital city to experience annual growth, also by 1.3 per cent.
According to CoreLogic, dwelling values in Adelaide are down just 0.1 per cent over the past quarter and actually rose by 0.2 per cent last month.
As a result, home values here now sit just 2.2 per cent below the record-high levels established in July 2022.
At TOOP+TOOP, we continued to achieve strong results at all price points.
Our team sold almost 50 properties for the month at an average price of more than $1.1 million. Our average time on market was just 20 days, compared with the broader Adelaide average for all agencies of 31 days.
Put simply, good-quality listings with TOOP+TOOP are still selling quickly and achieving excellent prices.
While buyer interest and activity has remained consistently high in Adelaide, stock levels continue to be lower than expected.
In Adelaide, the volume of new listings for the month dropped by 16.2 per cent, while total advertised stock was down by 16.5 per cent.
As a result, buyer demand continues to outweigh supply, creating strong competition for quality listings.
BRONTE MANUEL
M 0439 828 882
E bronte.manuel@toop.com.au
W brontemanuel.toop.com.au


$ # $ # RESIDENTIAL REAL ESTATE $9.5 Trillion AUSTRALIAN SUPERANNUATION Residential Real Estate Underpins Australia’s Wealth $3.4 Trillion AUSTRALIAN LISTED STOCKS $2.8 Trillion COMMERCIAL REAL ESTATE $1.3 Trillion NUMBER OF DWELLINGS 10.9 Million OUTSTANDING MORTGAGE DEBT $2.2 Trillion TOTAL SALES P.A. 473,724 GROSS VALUE OF SALES P.A. $416.4 Billion HOUSEHOLD WEALTH HELD IN HOUSING 56.1% Source: CoreLogic, RBA, APRA, ASX Australian dwelling values Overview 3 MONTHS 12 MONTHS CAPITAL CITIES 1.0% -8.0%
-6.8% -8.4%

changes AUSTRALIAN DWELLING VALUES AUSTRALIA Rolling quarterly change in dwelling values COMBINED REGIONALS COMBINED CAPITALS 1.4% -0.1% -6% -4% -2% 0% 2% 4% 6% 8% Apr 13 Apr 15 Apr 17 Apr 19 Apr 21 Apr 23 Combined Capitals Combined Rest of State 3.0% 0.3% 0.1% -0.1% 1.0% -2.4% -2.0% -1.0% -0.7% -1.0% 0.8% 2.4% 1.2% -1.6% 0.5% 1.4% -0.1% 1.0% Sydney Melbourne Brisbane Adelaide Perth Hobart Darwin Canberra Regional NSW Regional Vic Regional QLD Regional SA Regional WA Regional TAS Regional NT Combined capitals Combined regionals Australia Change in dwelling values, three months to April 2023
12 month changes AUSTRALIAN DWELLING VALUES AUSTRALIA Rolling annual change in dwelling values COMBINED REGIONALS COMBINED CAPITALS -10.7% -8.9% -9.8% 1.3% 1.3% -12.7% -0.5% -9.3% -10.0% -7.2% -5.6% 10.0% 3.7% -6.6% 1.8% -8.4% -6.8% -8.0% Sydney Melbourne Brisbane Adelaide Perth Hobart Darwin Canberra Regional NSW Regional Vic Regional QLD Regional SA Regional WA Regional TAS Regional NT Combined capitals Combined regionals Australia -8.4% -6.8% -20% -10% 0% 10% 20% 30% Apr 13 Apr 15 Apr 17 Apr 19 Apr 21 Apr 23 Combined Capitals Combined Rest of State Change in dwelling values, twelve months to April 2023
3 month
1.4% -0.1% 1.0%
-8.0%
Rolling quarterly change in values, dwellings Rolling quarterly change in values, dwellings
AUSTRALIAN DWELLING VALUES 3.0% 0.3% 0.1% -0.1% -8% -6% -4% -2% 0% 2% 4% 6% 8% 10% 12% Apr 18 Apr 19 Apr 20 Apr 21 Apr 22 Apr 23 Sydney Melbourne Brisbane Adelaide 1.0% -2.4% -2.0% -1.0% -8% -6% -4% -2% 0% 2% 4% 6% 8% 10% Apr 18 Apr 19 Apr 20 Apr 21 Apr 22 Apr 23 Perth Hobart Darwin ACT Lowest 25% of values Middle 50% of values Highest 25% of values Capital
1.3% 2.2% 4.0% -0.3% 0.1% 0.7% 0.8% 0.3% -0.5% 1.8% 0.4% -1.3% 1.7% 1.4% 0.4% -2.1% -2.3% -2.6% -2.2% -2.0% -1.9% 0.1% -1.0% -1.5% 25th 50th 75th 25th 50th 75th 25th 50th 75th 25th 50th 75th 25th 50th 75th 25th 50th 75th 25th 50th 75th 25th 50th 75th SYD MELB BRIS ADL PER HOB DAR ACT Quarterly change in stratified hedonic dwellings index (3 months to April)
Capital cities
cities AUSTRALIAN DWELLING VALUES
HOUSING CYCLES
Rolling 28-day growth rate in CoreLogic Daily Home Value index
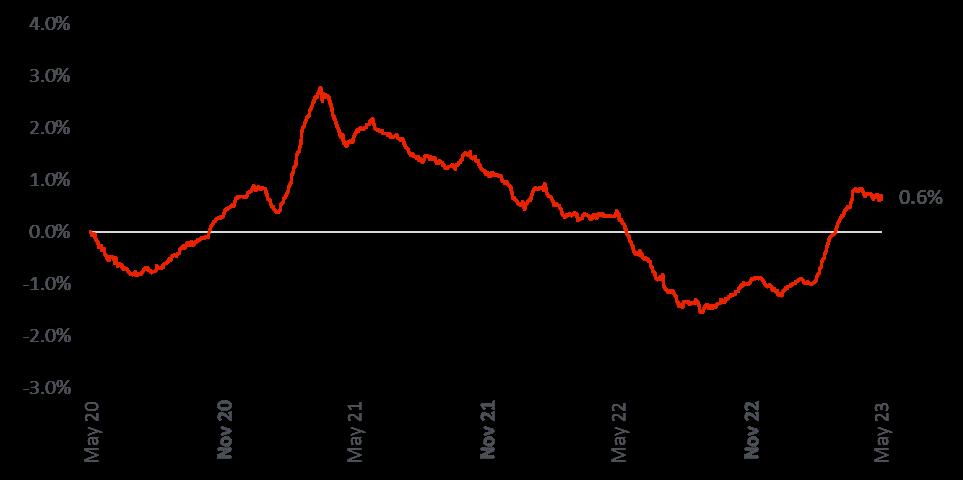
Combined capital cities, rolling 28-day change Adelaide HOUSING CYCLES -5% 0% 5% 10% 15% 20% 25% 30% Apr 18 Apr 19 Apr 20 Apr 21 Apr 22 Apr 23
0.2% -0.1% 1.3%
Sales and listings


-21.5% -22.7% -20.8%
20,000 30,000 40,000 50,000 60,000 Apr 18 Apr 19 Apr 20 Apr 21 Apr 22 Apr 23 NATIONAL SALES AUSTRALIA Monthly sales with six month moving average, National COMBINED REGIONALS COMBINED CAPITALS Monthly sales volume 6 month moving average 5 year average Note: recent months of sales volumes are modelled estimates, and are subject to revision -29.1% -24.7% -23.9% -7.7% -3.8% -13.4% 0.0% -5.0% -26.1% -23.8% -22.3% -11.6% -12.4% -25.8% -10.0% -20.8% -22.7% -21.5% Sydney Melbourne Brisbane Adelaide Perth Hobart Darwin Canberra Regional NSW Regional Vic Regional QLD Regional SA Regional WA Regional TAS Regional NT Combined capitals Combined regionals National Change in sales volumes, twelve months to April 2023
VENDOR DISCOUNT
-4.2% -3.2%
-3.2%
26 26 13 31 15 9 56 34 31 24 19 45 28 15 73 22 25 23 33 30 28 30 18 41 70 43 52 48 35 45 36 63 67.5 29 44 33 Sydney Melbourne Brisbane Adelaide Perth Hobart Darwin Canberra Regional NSW Regional Vic Regional QLD Regional SA Regional WA Regional TAS Regional NT Combined capitals Combined regionals National MEDIAN DAYS ON MARKET AUSTRALIA COMBINED REGIONALS COMBINED CAPITALS Median days on market Combined regionals Combined capitals 29 44 15 25 35 45 55 65 75 Apr 18 Apr 19 Apr 20 Apr 21 Apr 22 Apr 23 33 23 44 25 29 22 Median days on market – three months to April 2023
AUSTRALIA COMBINED REGIONALS Median vendor discount Combined regionals Combined capitals COMBINED CAPITALS -6% -5% -4% -3% -2% Apr 18 Apr 19 Apr 20 Apr 21 Apr 22 Apr 23 -3.4% -3.4% -2.9% -2.9% -2.8% -2.9% -4.1% -2.9% -2.8% -2.5% -3.6% -3.8% -3.9% -3.5% -2.6% -3.2% -3.2% -3.2% -4.1% -4.0% -3.9% -4.6% -3.0% -4.7% -4.5% -3.9% -5.0% -4.7% -4.3% -4.0% -4.1% -5.3% -3.7% -3.9% -4.6% -4.2% Sydney Melbourne Brisbane Adelaide Perth Hobart Darwin Canberra Regional NSW Regional Vic Regional QLD Regional SA Regional WA Regional TAS Regional NT Combined capitals Combined regionals National Apr-23 Apr-22 Median vendor discount – three months to April 2023 -3.9% -3.2%
-4.6%
LISTINGS Number of total listings, National Dwellings Total listings over the 4 weeks ending Compared to same time last year Compared to 5-year average 137,629
May 7
LISTINGS Number of new listings, National Dwellings New listings over the 4 weeks ending Compared to same time last year Compared to 5-year average May 7 -13.9%
-5.9% -27.2%
-21.0% 31,356
New listings, change from equivalent period last year
AUSTRALIA COMBINED REGIONALS COMBINED CAPITALS
Data is for the four weeks ending 7 May
Total listings, change from equivalent period last year AUSTRALIA COMBINED REGIONALS COMBINED
-21.0%
-13.5% -6.7% -10.1% -16.5% -20.1% 59.9% -4.0% 14.6% 17.6% 32.3% -15.1% -16.0% -22.5% 37.6% Sydney Melbourne Brisbane Adelaide Perth Hobart Darwin Canberra Rest of NSW Rest of Vic Rest of Qld. Rest of SA Rest of WA Rest of Tas -18.4% -20.0% -32.2% -16.2% -17.5% -13.4% -16.7% -7.0% -21.6% -15.4% -27.3% -8.3% -22.2% -14.4% Sydney Melbourne Brisbane Adelaide Perth Hobart Darwin Canberra Rest of NSW Rest of Vic Rest of Qld. Rest of SA Rest of WA Rest of Tas
LISTINGS
-21.8% -20.6% -10.7% 1.3% -5.9% WEEKLY CLEARANCE RATES Weekly clearance rates, combined capital cities 0 1,000 2,000 3,000 4,000 5,000 6,000 0% 10% 20% 30% 40% 50% 60% 70% 80% 90% May-16 May-17 May-18 May-19 May-20 May-21 May-22 May-23 Auction volumes Clearance Rate Number of auctions (RHS) Auction clearance rate (LHS) Auction clearance rate, 4 week average (LHS)
CAPITALS
Rental market
6.0% 11.7%
13.1% 11.6% 11.7% 10.9% 13.2% 3.9% 4.3% -0.7% 3.8% 4.0% 8.1% 7.4% 8.6% 4.6% -1.0% 11.7% 6.0% 10.1% Sydney Melbourne Brisbane Adelaide Perth Hobart Darwin Canberra Regional NSW Regional Vic Regional QLD Regional SA Regional WA Regional TAS Regional NT Combined capitals Combined regionals National 10.1% 0% 1% 2% 3% 4% 5% 6% 7% 8% 9% 10% 11% Apr 18 Apr 19 Apr 20 Apr 21 Apr 22 Apr 23 RENTAL RATES AUSTRALIA COMBINED REGIONALS COMBINED CAPITALS Annual change in rental rates - National Annual change in rental rates to April 2023 10.1%
Dwelling
approvals & housing credit
RENTAL
AUSTRALIA COMBINED REGIONALS COMBINED CAPITALS Gross rental yields 3.9% 2.0% 2.5% 3.0% 3.5% 4.0% 4.5% Apr 17 Apr 18 Apr 19 Apr 20 Apr 21 Apr 22 Apr 23 3.2% 3.4% 4.4% 4.1% 4.9% 4.4% 6.4% 4.1% 4.1% 3.9% 5.0% 5.1% 6.5% 4.5% 6.7% 3.7% 4.6% 3.9% Sydney Melbourne Brisbane Adelaide Perth Hobart Darwin Canberra Regional NSW Regional Vic Regional QLD Regional SA Regional WA Regional TAS Regional NT Combined capitals Combined regionals National 3.9% 3.7% 4.6% Gross rental yields, April 2023
YIELDS
FINANCE & LENDING
Monthly value of new finance commitments, total ($ millions) Portion of new lending for investment housing (excluding refinance)
Source: ABS $2,500 $7,500 $12,500 $17,500 $22,500 $27,500 Mar 07 Mar 09 Mar 11 Mar 13 Mar 15 Mar 17 Mar 19 Mar 21 Mar 23 Owner occupiers Investors 33 3% 34 5% 20% 25% 30% 35% 40% 45% 50% Mar 07 Mar 09 Mar 11 Mar 13 Mar 15 Mar 17 Mar 19 Mar 21 Mar 23 2,000 4,000 6,000 8,000 10,000 12,000 14,000 16,000 Mar 93 Mar 96 Mar 99 Mar 02 Mar 05 Mar 08 Mar 11 Mar 14 Mar 17 Mar 20 Mar 23 DWELLING APPROVALS Monthly house v unit approvals, National Houses Units Decade average, units Source: ABS Decade average, houses
INVESTORS & LENDING
Investors as a portion of total lending (based on value, excluding refinancing)
FIRST HOME BUYERS
First home buyers as a % of owner occupier housing finance commitments by state
NSW VIC QLD SA WA TAS Source: ABS 38.6% 15% 25% 35% 45% 55% 65% Mar 13 Mar 15 Mar 17 Mar 19 Mar 21 Mar 23 31.1% 15% 25% 35% 45% 55% Mar 13 Mar 15 Mar 17 Mar 19 Mar 21 Mar 23 32.5% 15% 25% 35% 45% 55% Mar 13 Mar 15 Mar 17 Mar 19 Mar 21 Mar 23 29.2% 15% 25% 35% 45% 55% Mar 13 Mar 15 Mar 17 Mar 19 Mar 21 Mar 23 28.4% 0% 20% 40% 60% Mar 13 Mar 15 Mar 17 Mar 19 Mar 21 Mar 23 25.7% 15% 25% 35% 45% 55% Mar 13 Mar 15 Mar 17 Mar 19 Mar 21 Mar 23 33.3% 38.6% 31.1% 32.5% 29.2% 28.4% 25.7% 23.1% 32.2% Aust NSW Vic Qld SA WA Tas NT ACT Investors as a % of housing finance commitments by state (March ‘23)
Source: ABS 24.7% 22.5% 25.6% 24.0% 22.7% 29.2% 25.2% 31.8% 24.0% Aust NSW Vic Qld SA WA Tas NT ACT 0% 5% 10% 15% 20% 25% 30% 35% 40% 45% 50% Feb 13 Feb 15 Feb 17 Feb 19 Feb 21 Feb 23 NSW Vic Qld SA WA Tas
home buyers as a % of owner occupier housing finance commitments March 2023
First
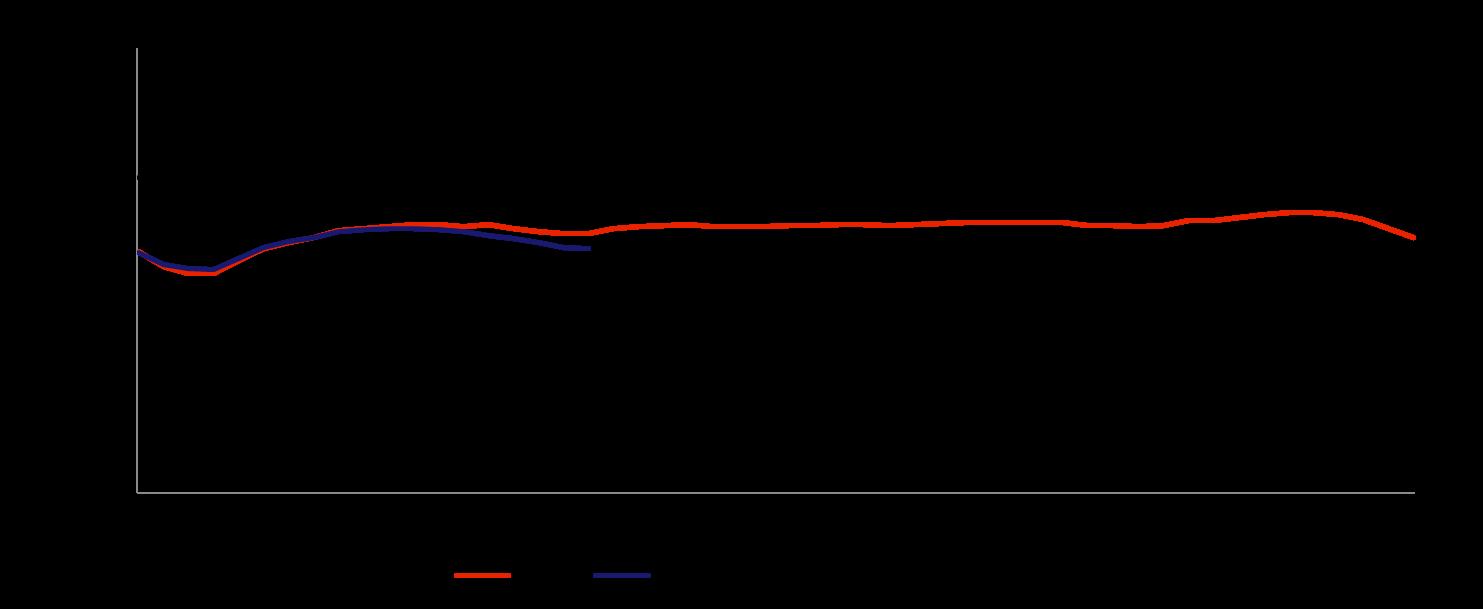
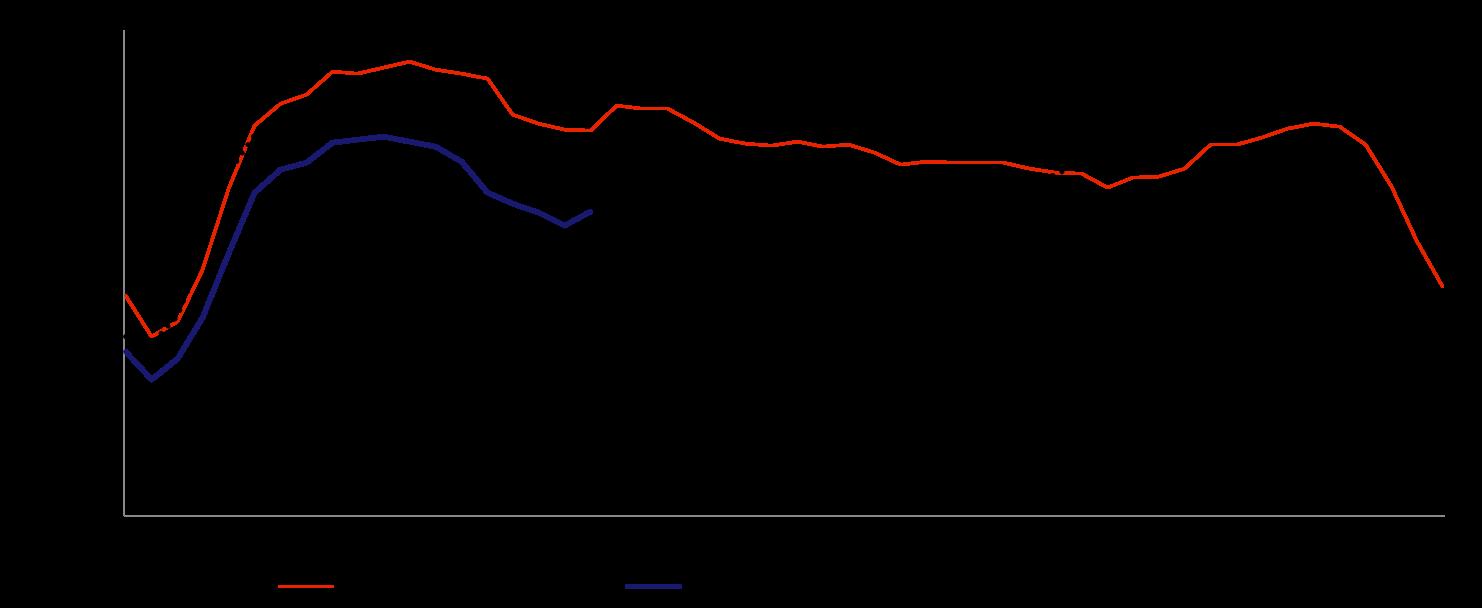
The RBA lifted the cash rate to 3.85% in May Statement highlights
Average borrowing costs by borrower and loan type Owner occupiers Investors Source: RBA 1.0% 2.0% 3.0% 4.0% 5.0% 6.0% 7.0% Feb 20 May 20 Aug 20 Nov 20 Feb 21 May 21 Aug 21 Nov 21 Feb 22 May 22 Aug 22 Nov 22 Feb 23 Variable rate Fixed rate, less than or equal to 3 years Fixed rate, greater than 3 years 1.0% 1.5% 2.0% 2.5% 3.0% 3.5% 4.0% 4.5% 5.0% 5.5% 6.0% 6.5% Feb 20 May 20 Aug 20 Nov 20 Feb 21 May 21 Aug 21 Nov 21 Feb 22 May 22 Aug 22 Nov 22 Feb 23 Variable rate Fixed rate, less than or equal to 3 years Fixed rate, greater than 3 years
HOUSING CREDIT
MORTGAGE RATES Source: RBA • • • • “further tightening” may be required to get inflation back to target. 7.25% 3.00% 4.75% 2.50% 1.50% 0.25% 0.10% 3.85% 0% 1% 2% 3% 4% 5% 6% 7% 8% May 07 May 09 May 11 May 13 May 15 May 17 May 19 May 21 May 23 RBA Cash Rate
Mortgage originations for ‘riskier’ types of lending trended notably lower through the December quarter of 2022
The portion of loans originated with a debt-to-income ratio of six or more fell to 11.0% (down from 23.3% in the September 2021 quarter), and loan to income ratios of six or more dropped to 4.5% in the quarter.
Are the regions still popular with buyers?
The portion of home sales that took place in regional Australia comprised an estimated 37.0% of home sales in the three months to April. This is down from a peak of 42.3% in the three months to September 2020, but remains above the decade average of 35.3%.
HOUSING
CREDIT
% of loans on interest only terms % of loans originated with a loan to income ratio >=6x % of loans originated with a debt to income ratio >=6x % of loans originated with an LVR >=90% Investors Owner occupiers Source: APRA
Chart of the month Source: CoreLogic. Note: recent months of sales volumes are modelled estimates, and are subject to revision.
This is a general market promotion. Please disregard if you have already enlisted another agent. RLA 301309 Scan here to find out more about how your suburb is performing