Multiscalar analysis, urban codes and scenarios in Brunswick P.
11-13
14-16
P.
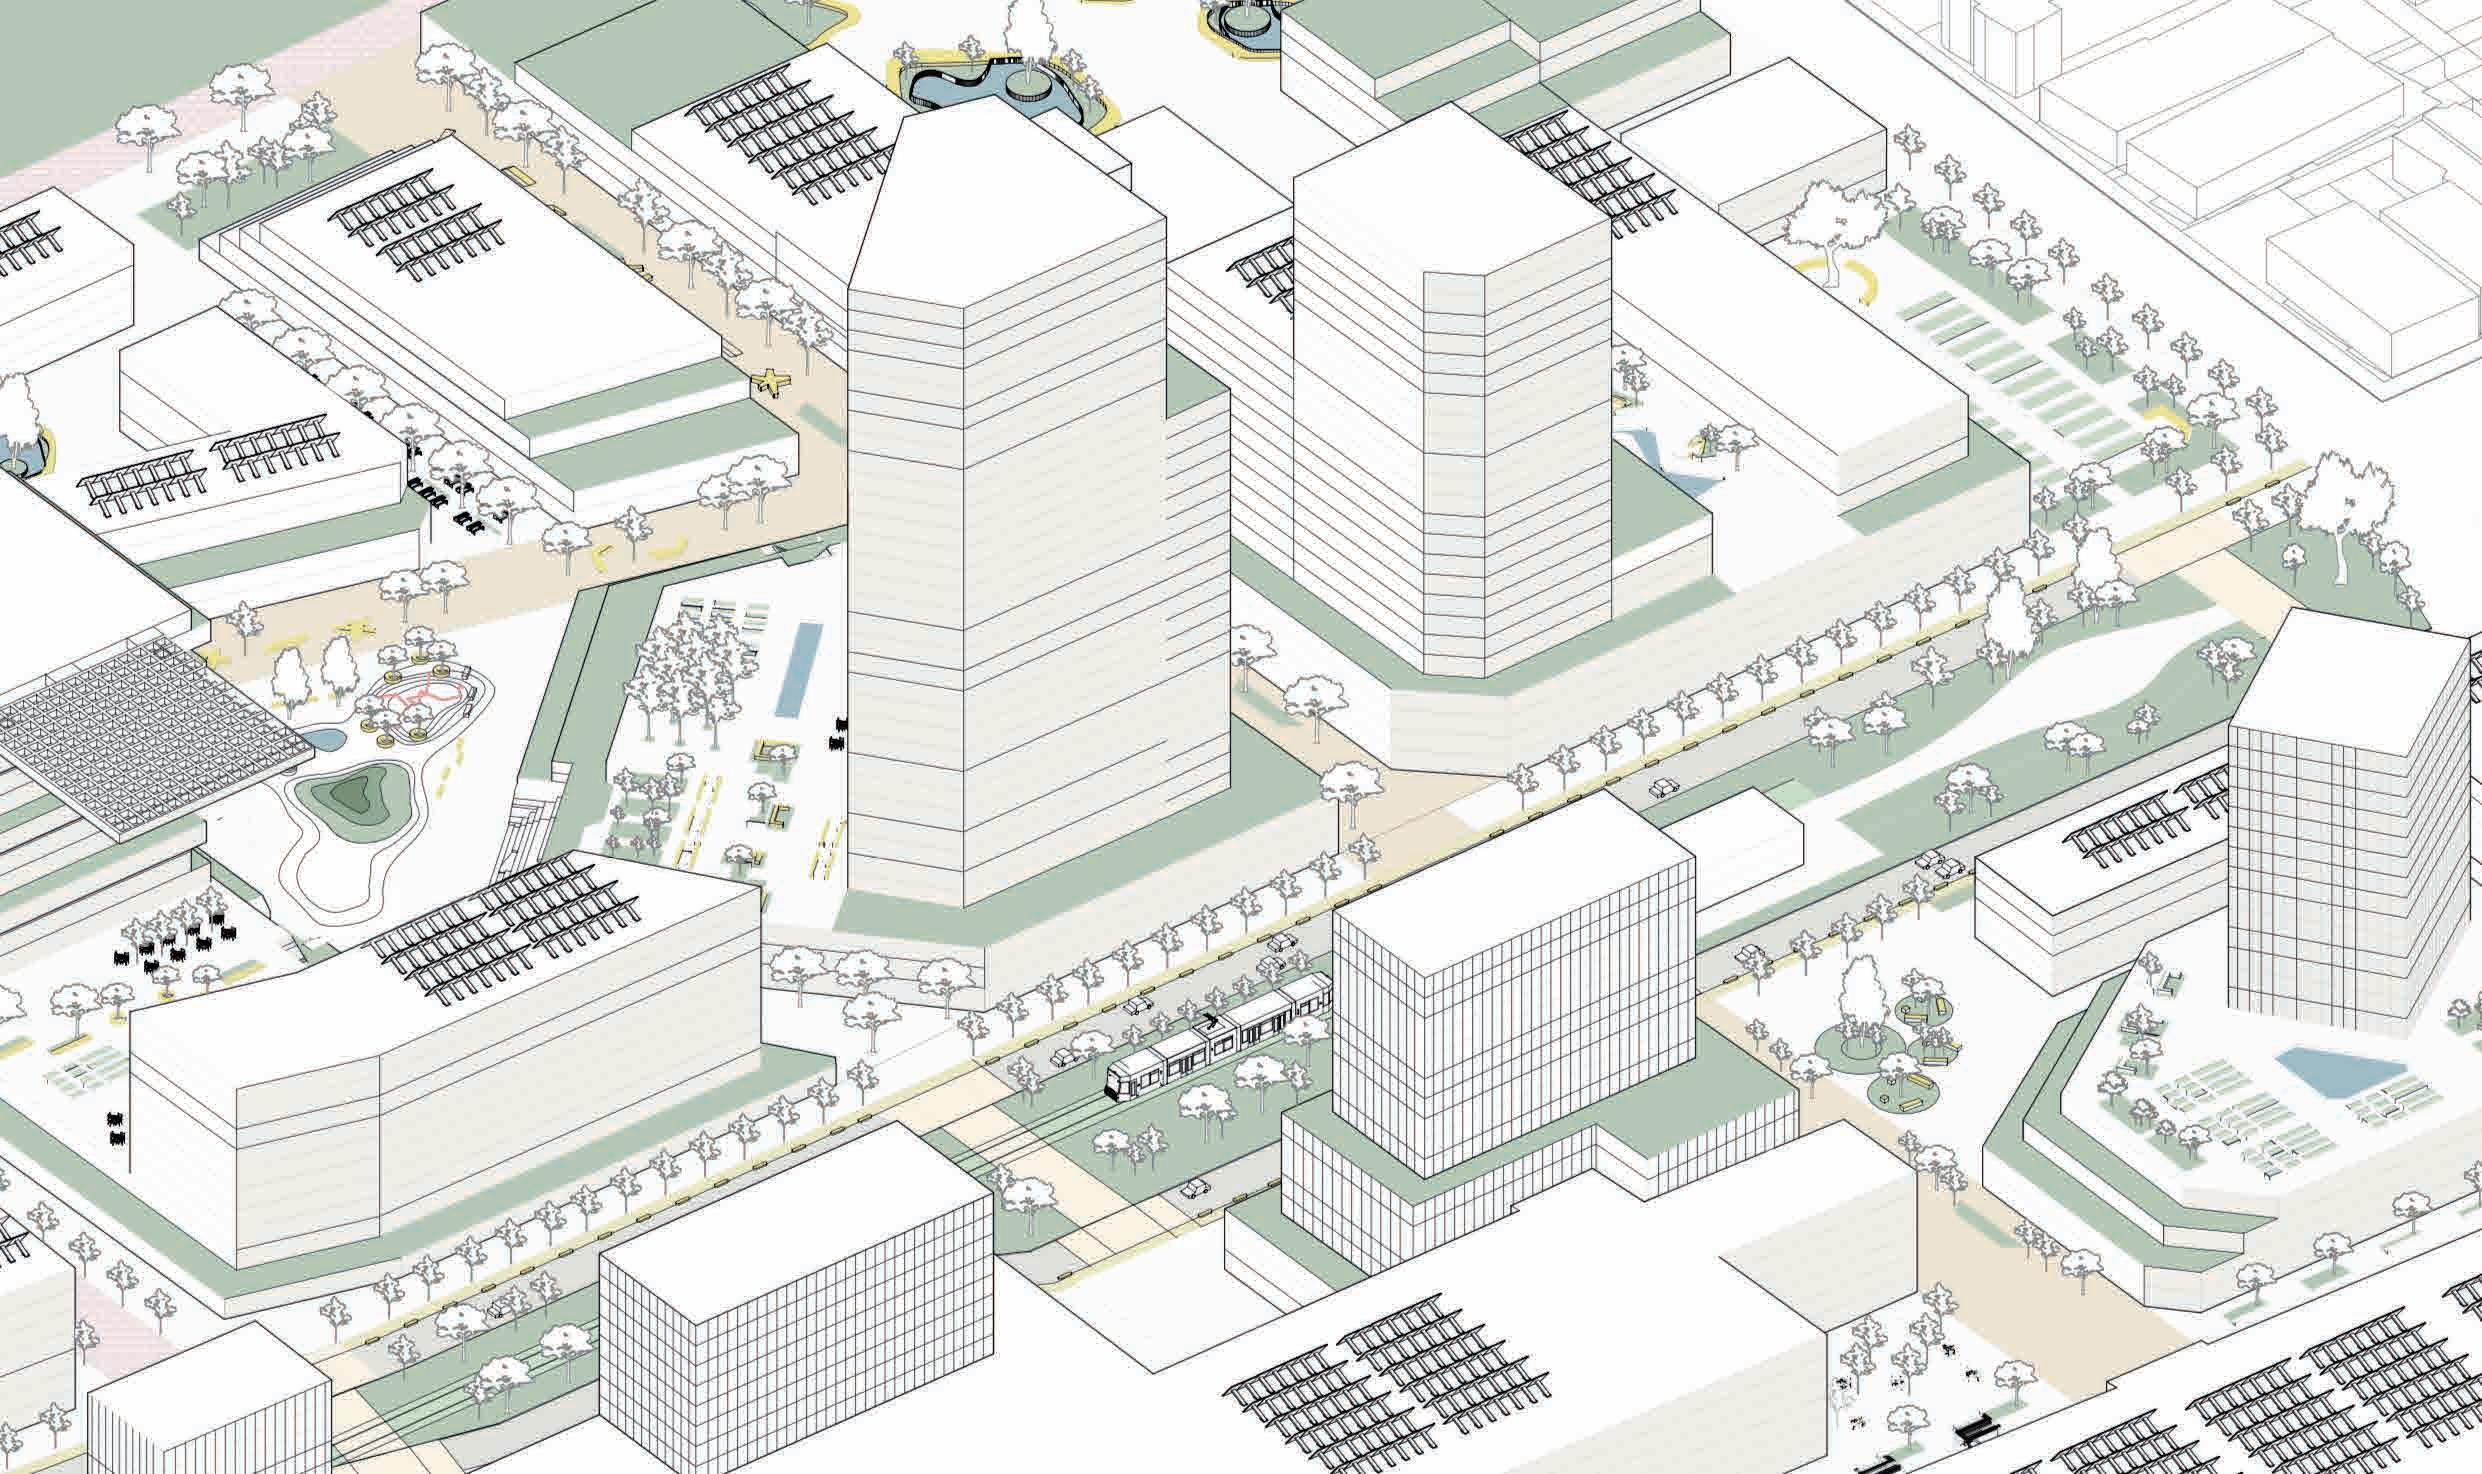
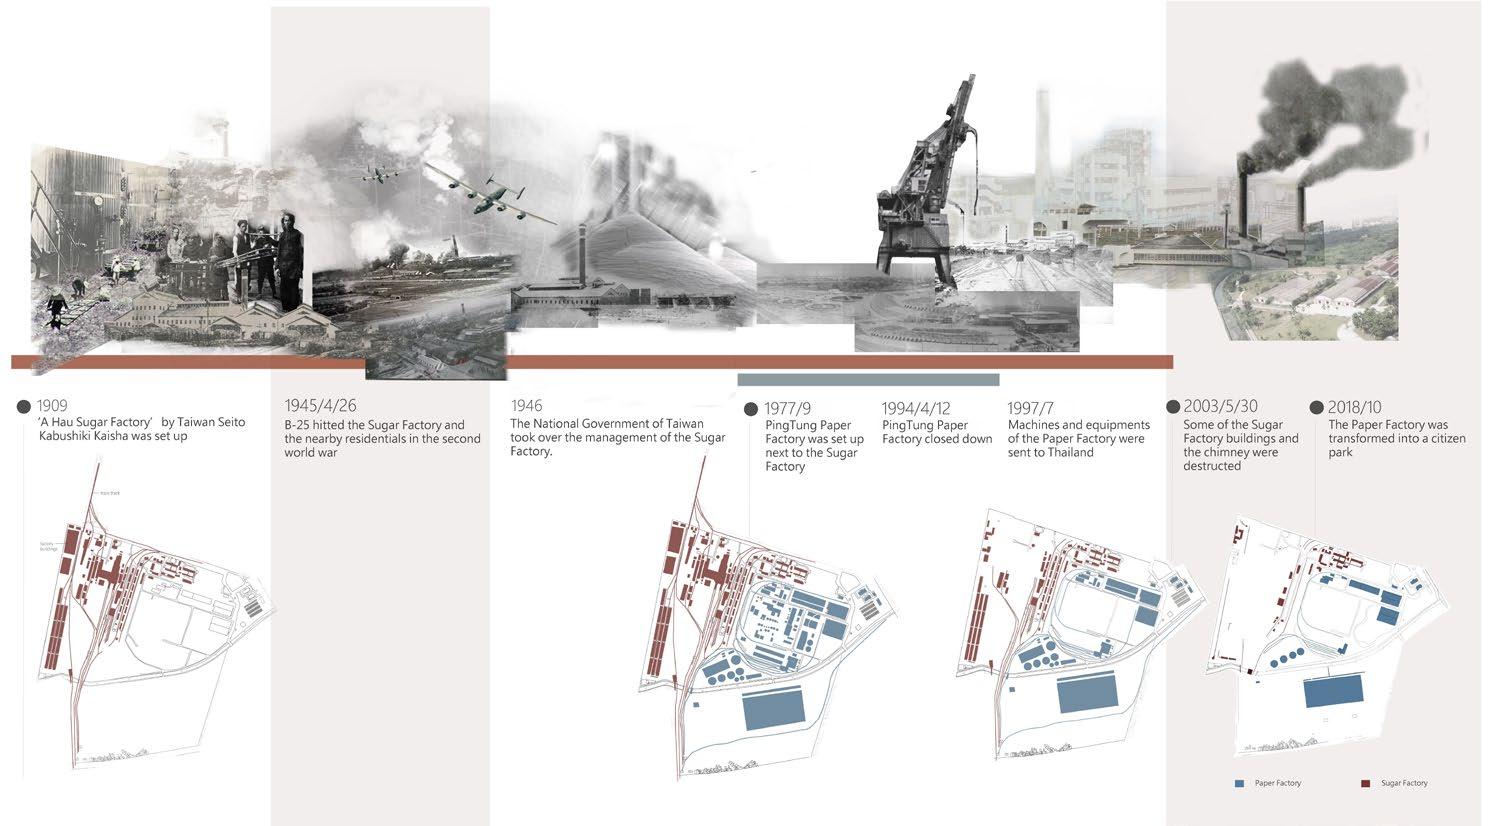
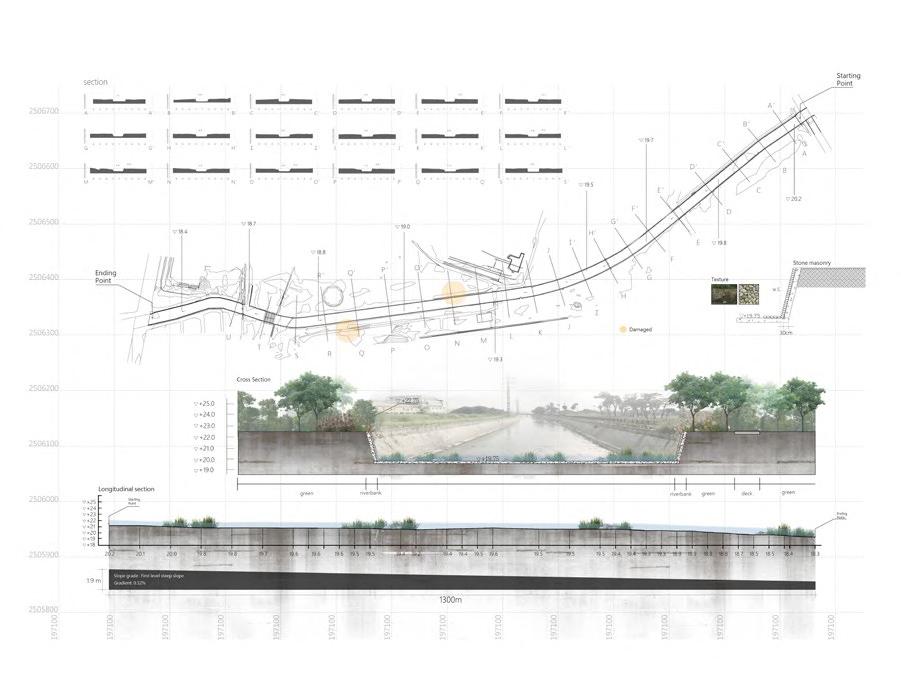
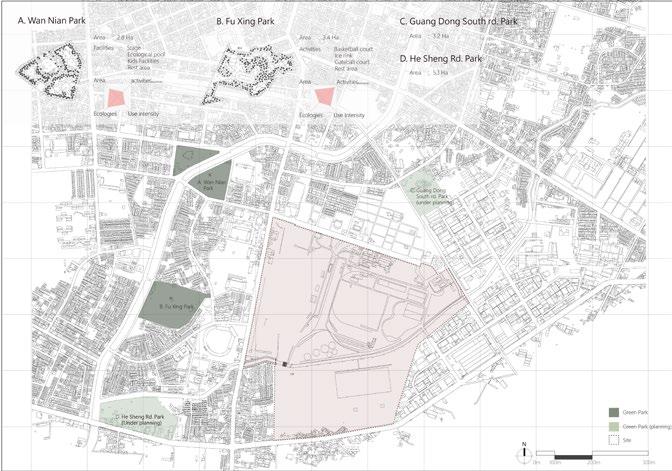
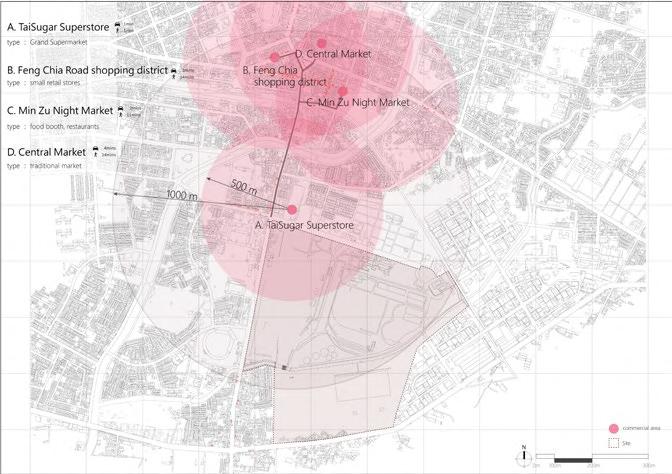
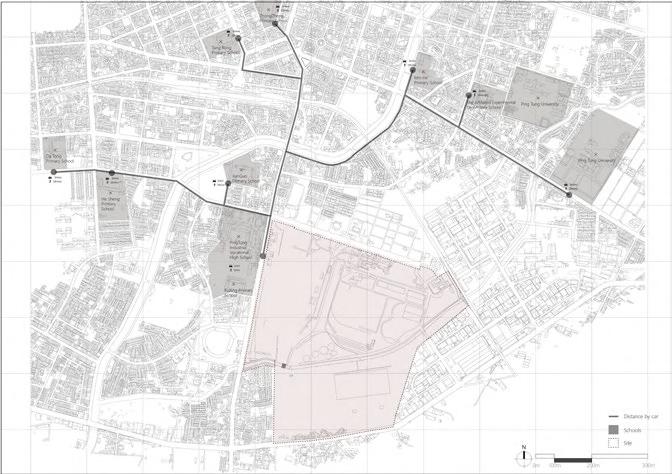
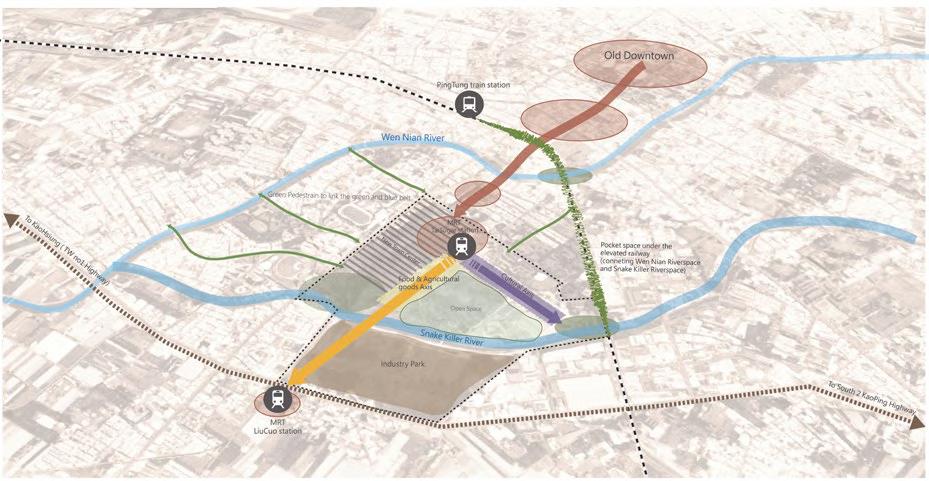
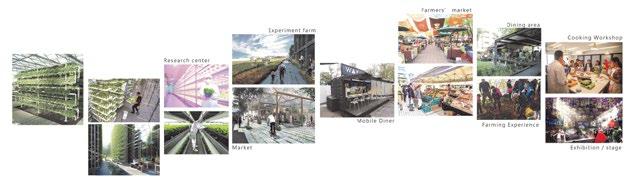
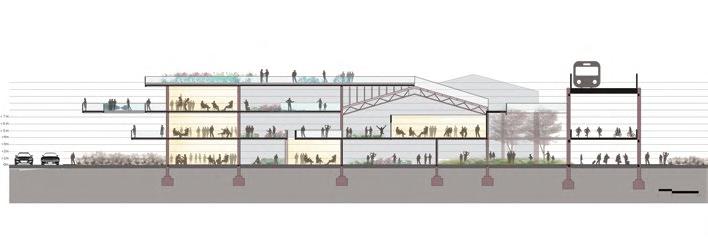
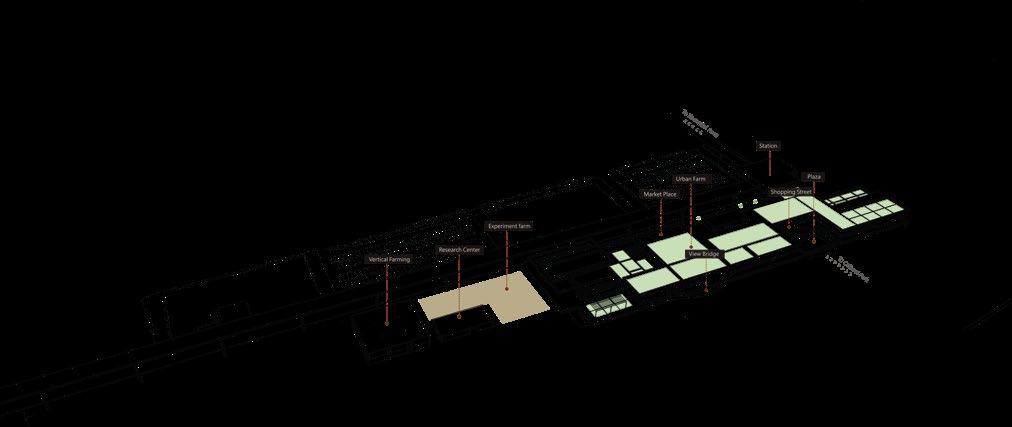
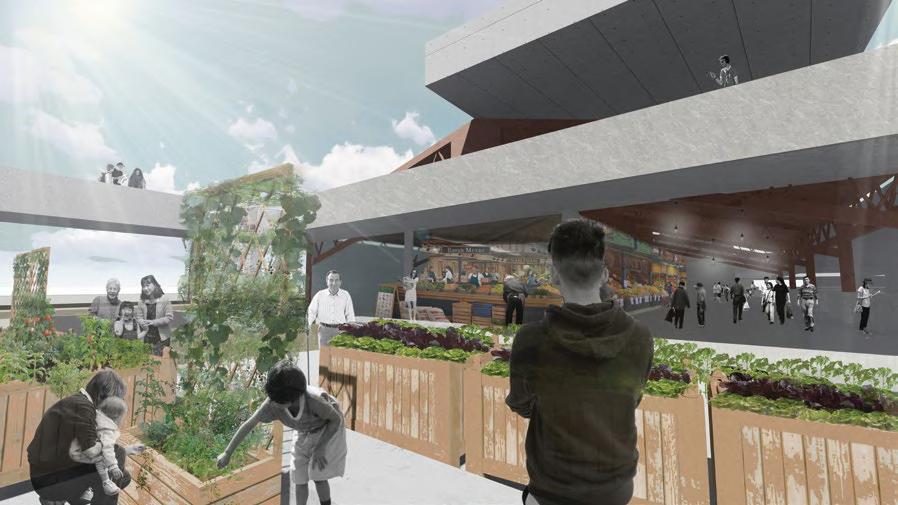
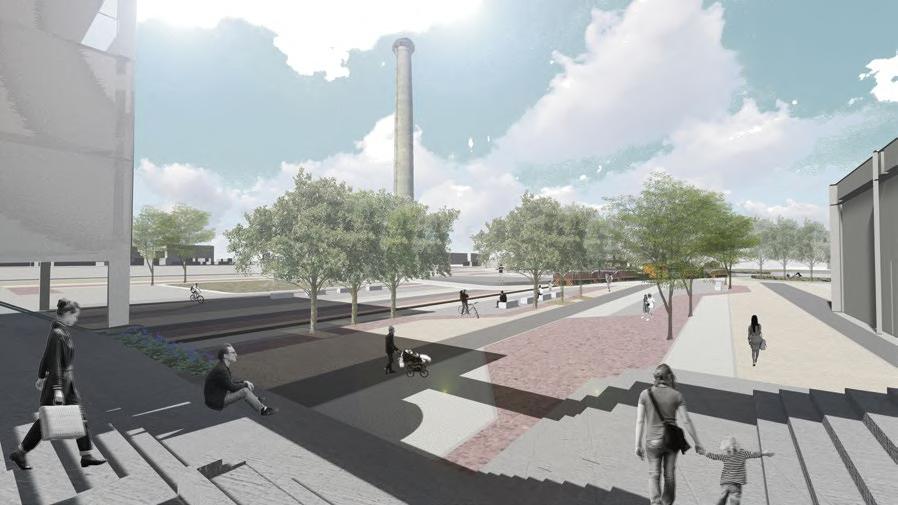
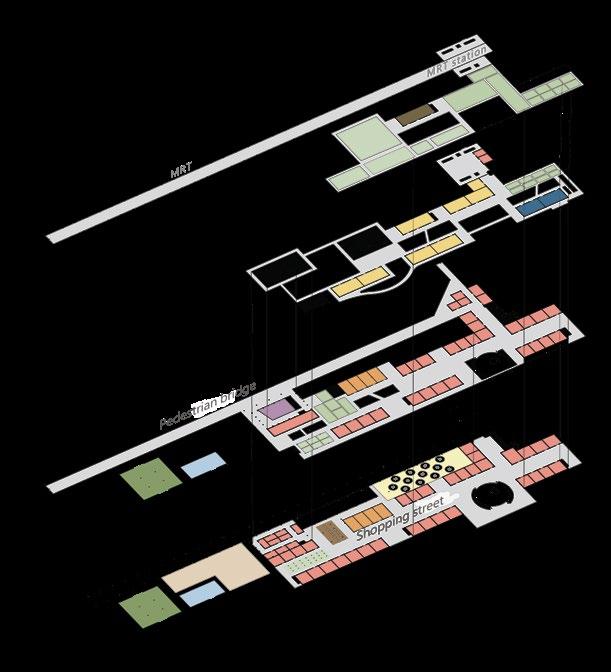
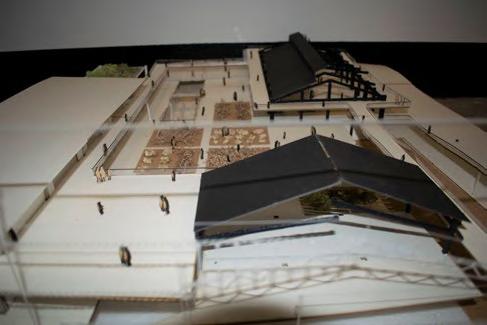
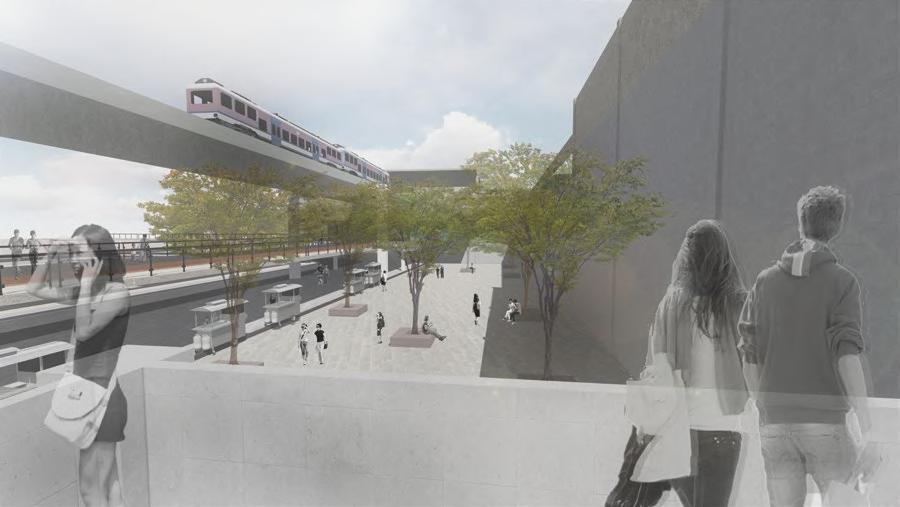
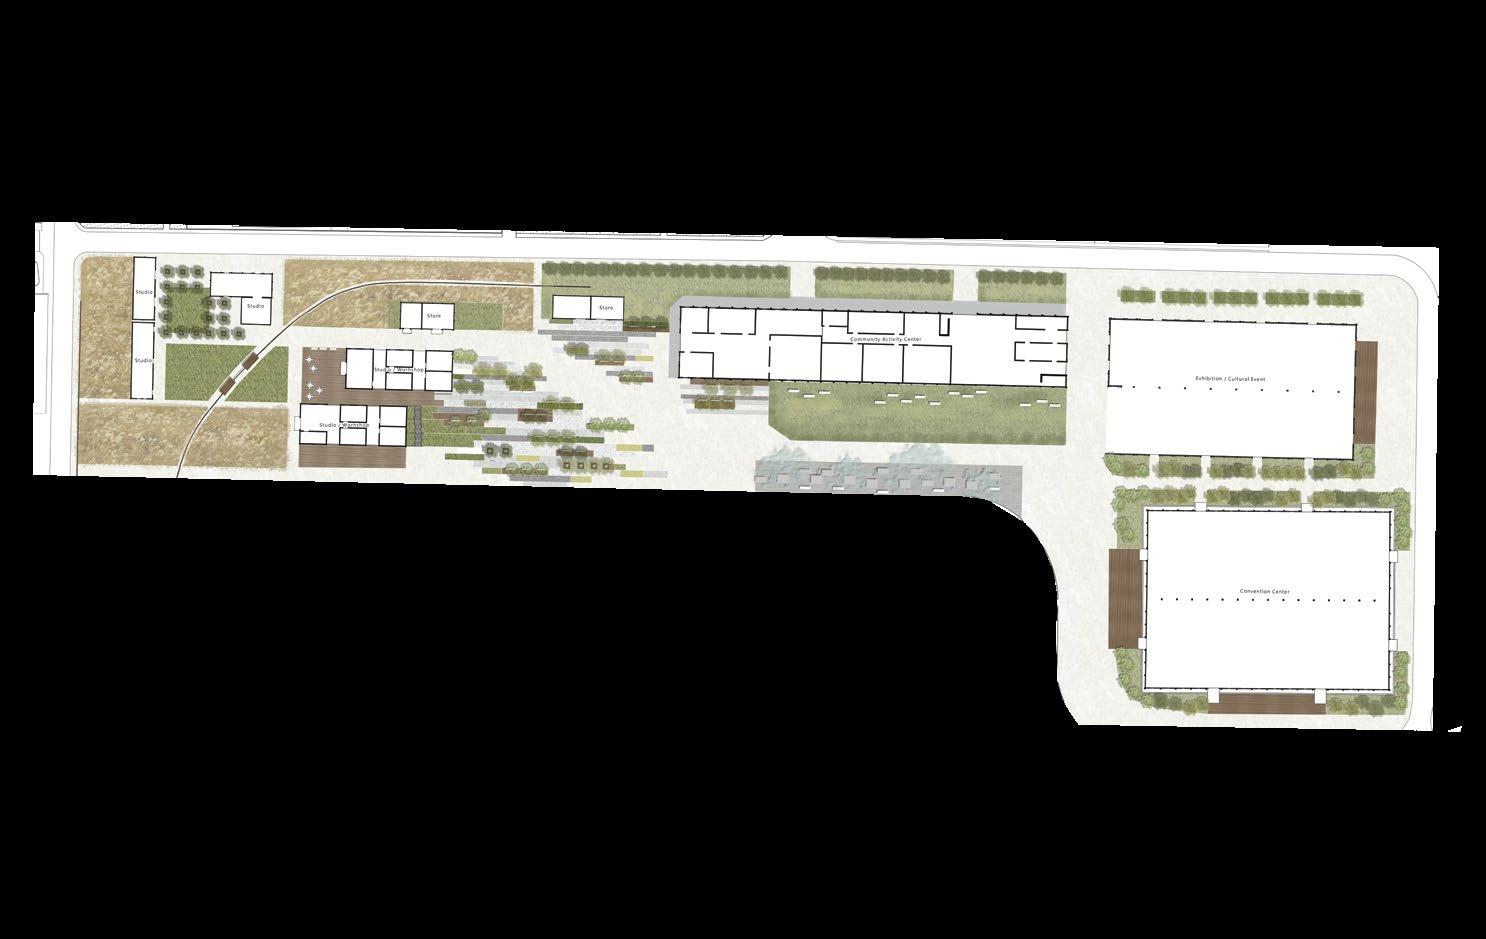
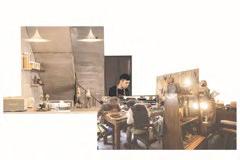
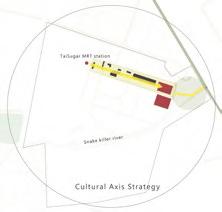
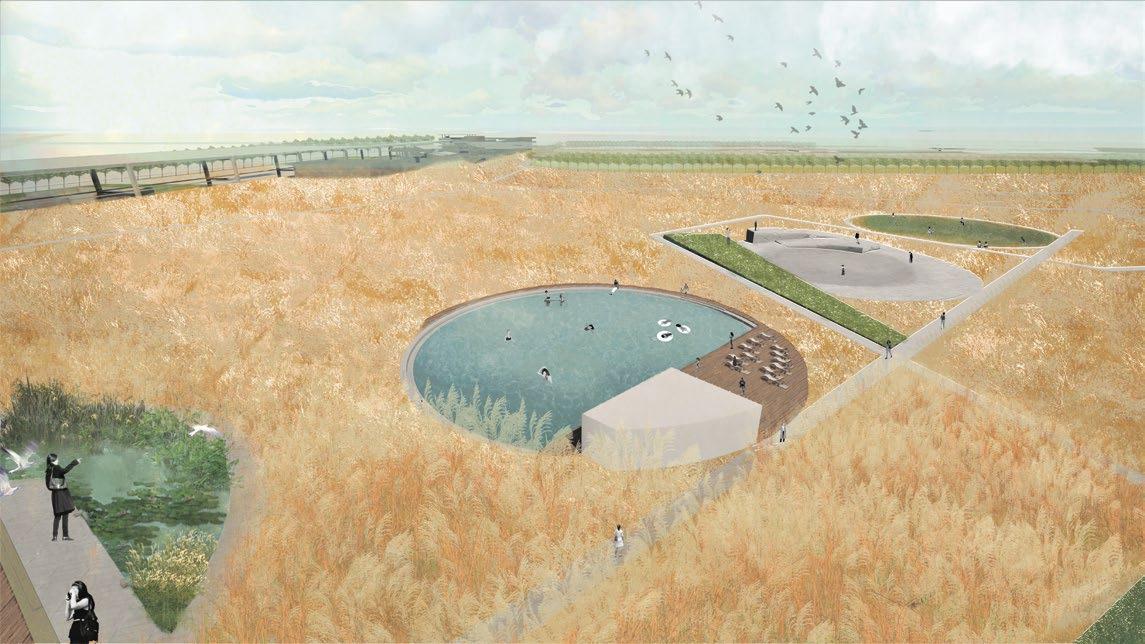
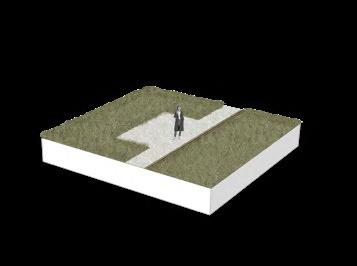
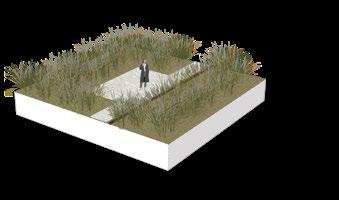
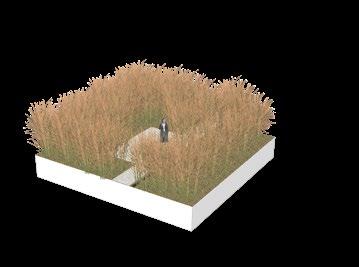
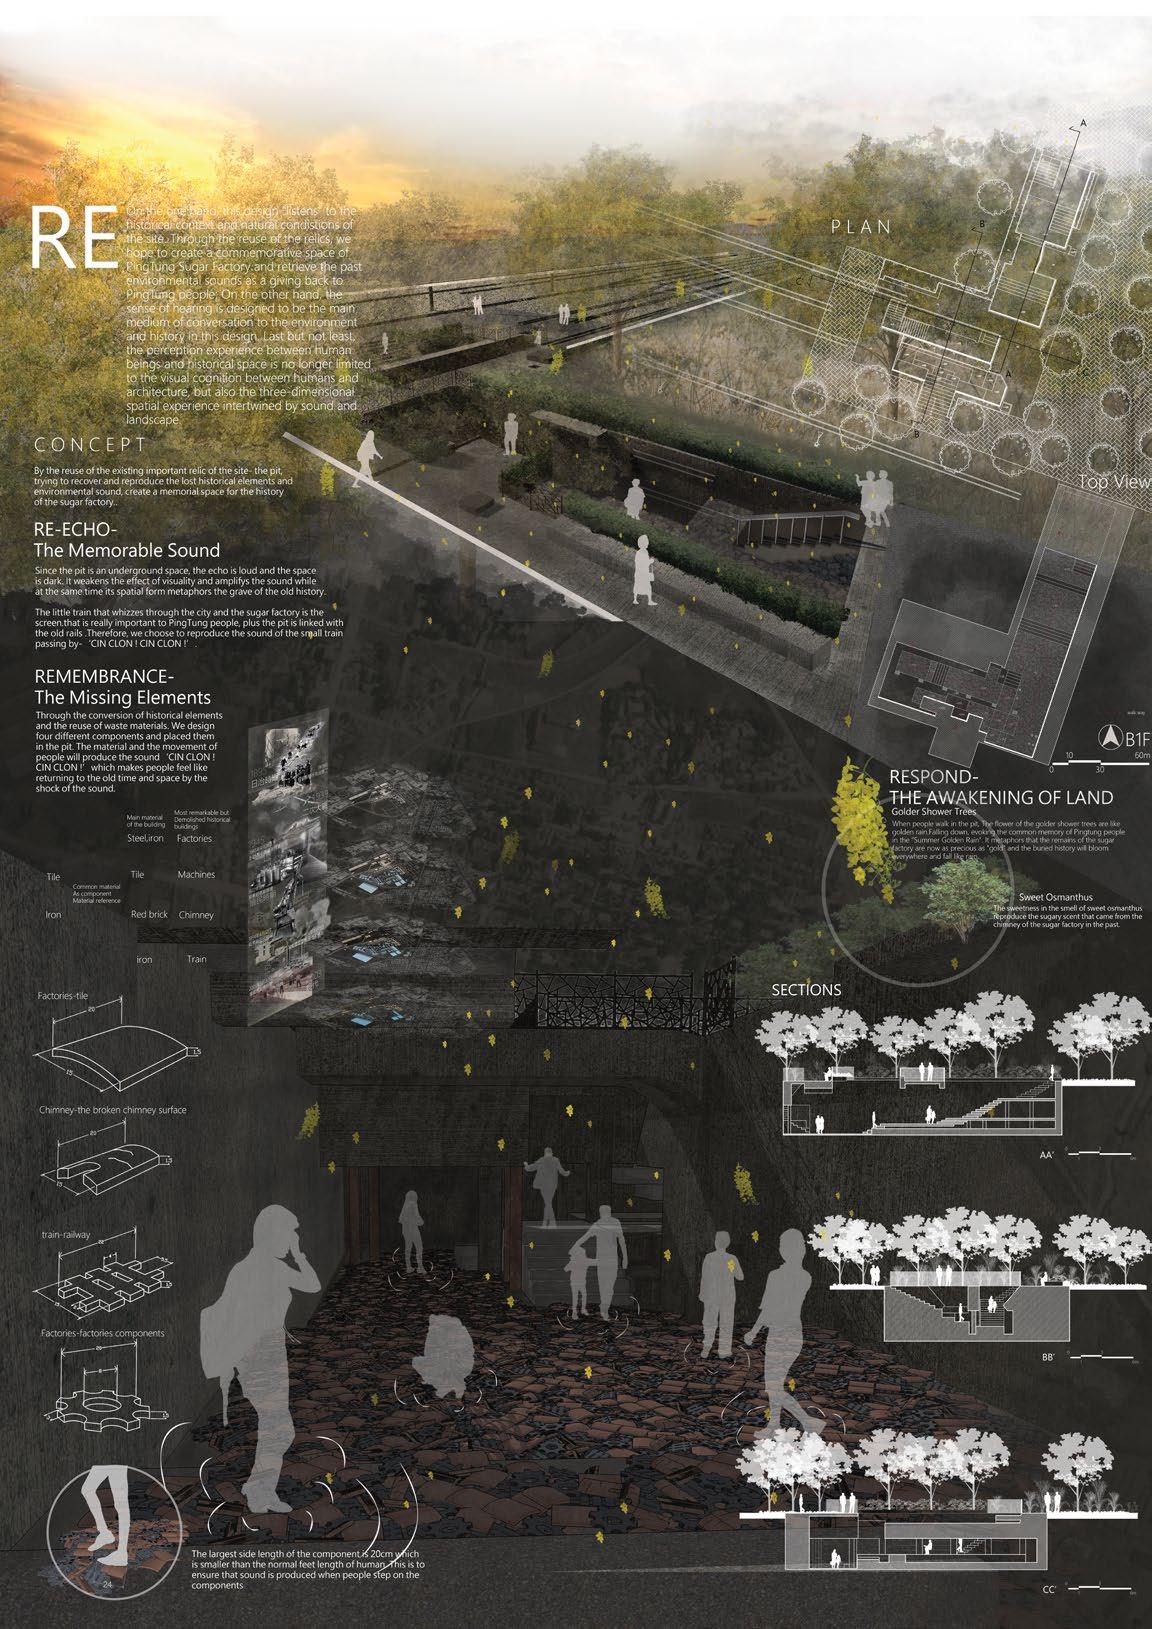
PINGTUNG SUGAR FACTORY RENEWAL PLAN, PINGTUNG, TAIWAN
Year 4 Thesis Deisgn
Sept 2018 - April 2019
Tutor : YuFeng Wang ( yufeng@post.harvard.edu ; +886 227116623)
Two people group work: full involvment in the whole project including nding the site, de ning the topic, discussion with tutor, doing the design and share equal distribution in the digital and verbal presentation
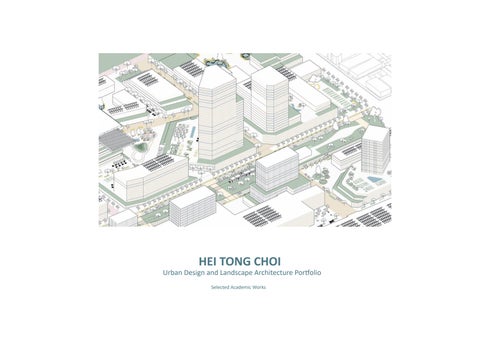
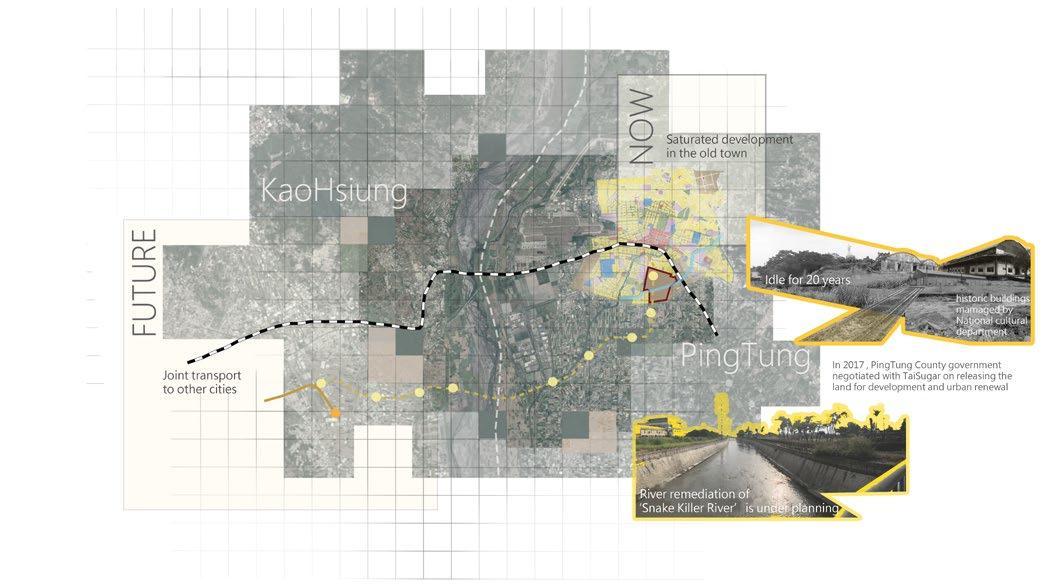
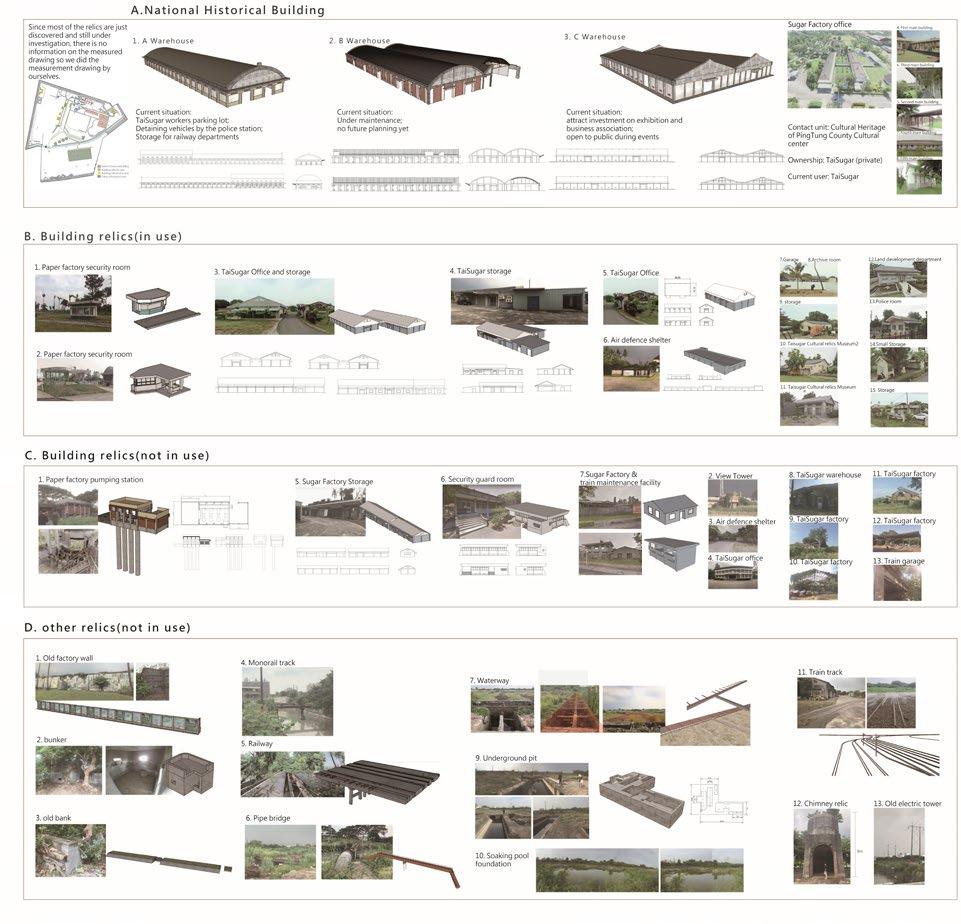
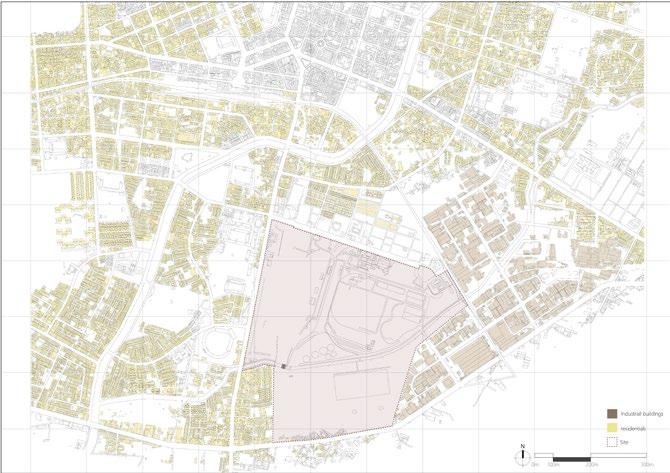
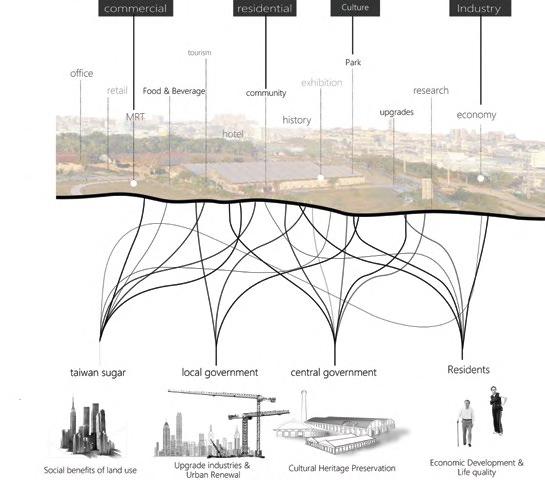
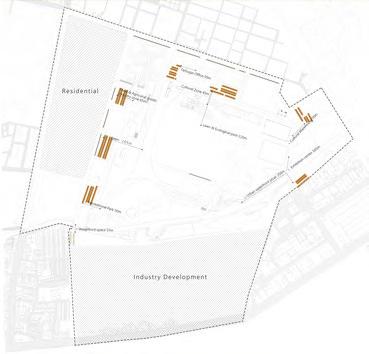
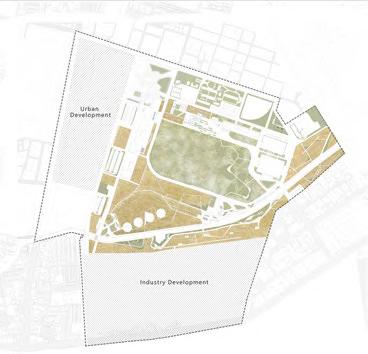
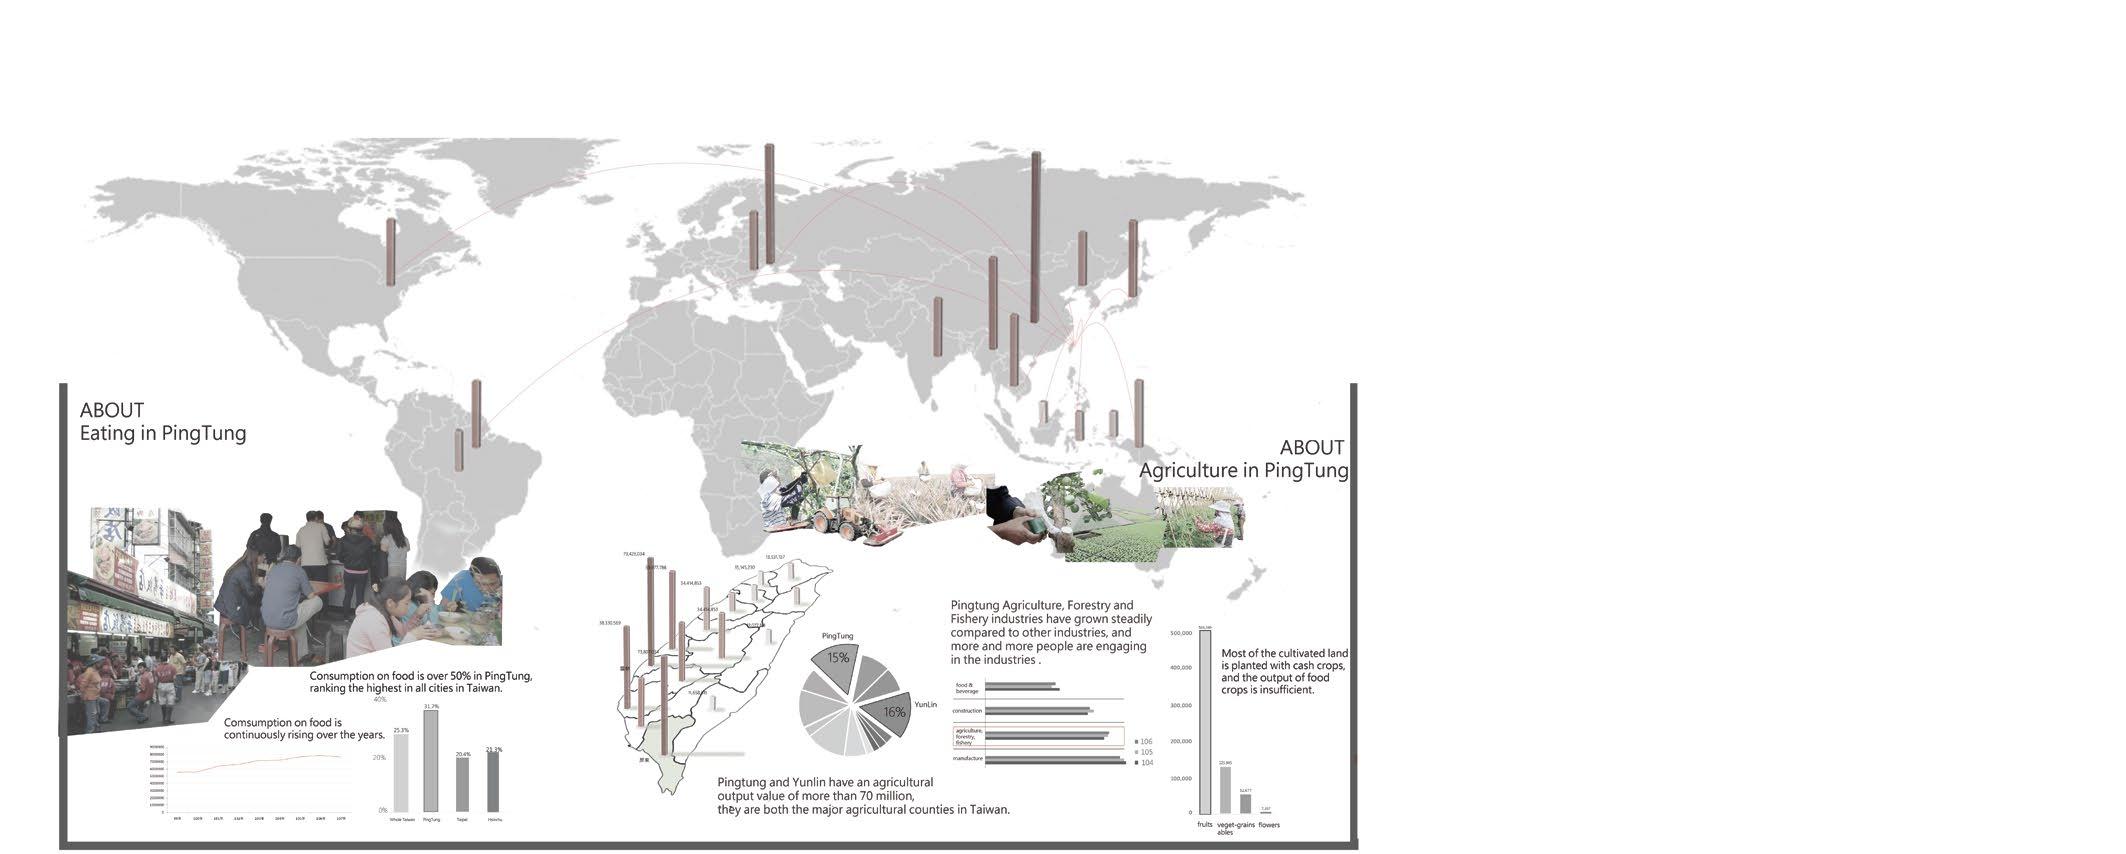
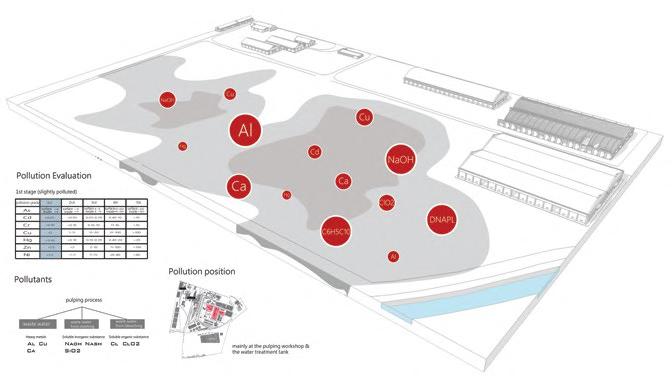
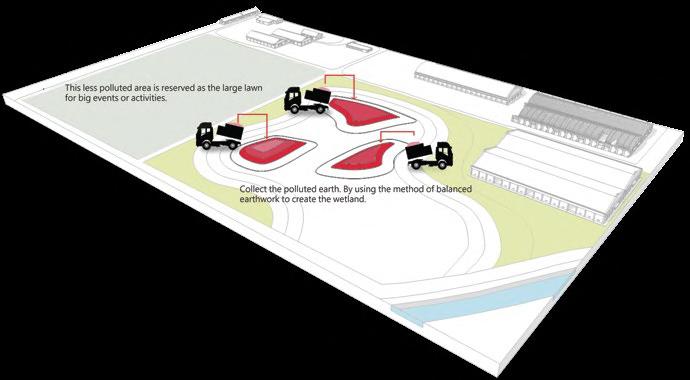
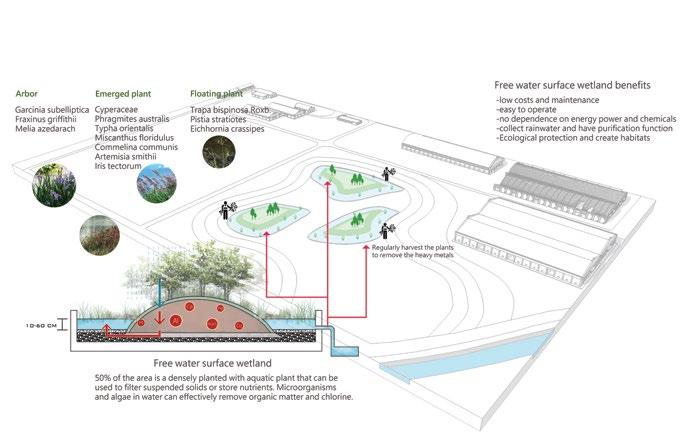
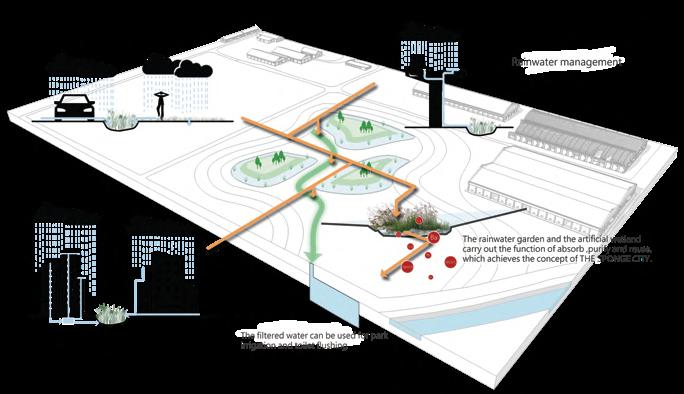
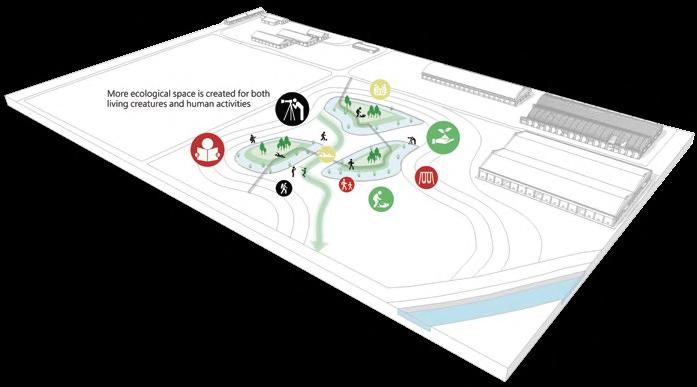
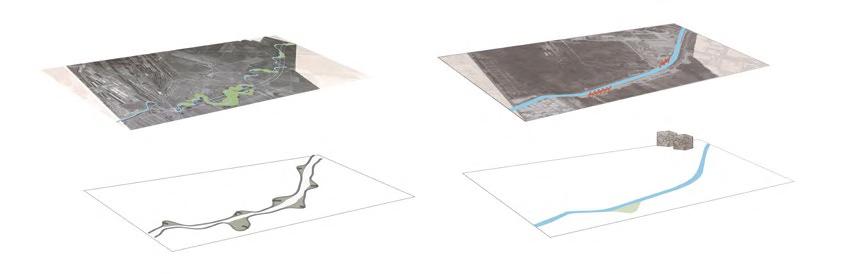
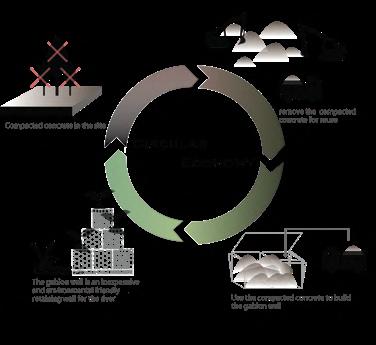
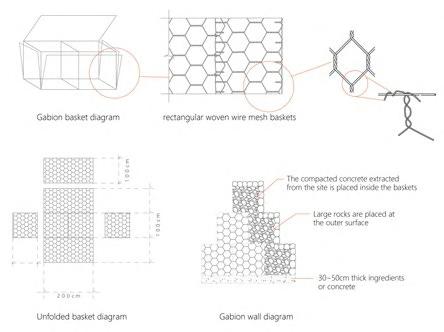
TaiSugar, the owner of this site planned to divide the land randomly for mainly commercial development, ignoring the context of the culture of the site. We criticised on that and intended to emphasize the importance of heritage in our project, valued the potential location and natural conditions and plan for the good of the urban development, public space and industry of PingTung.
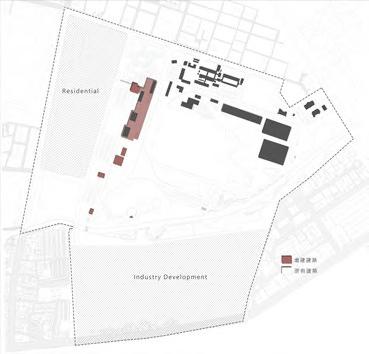
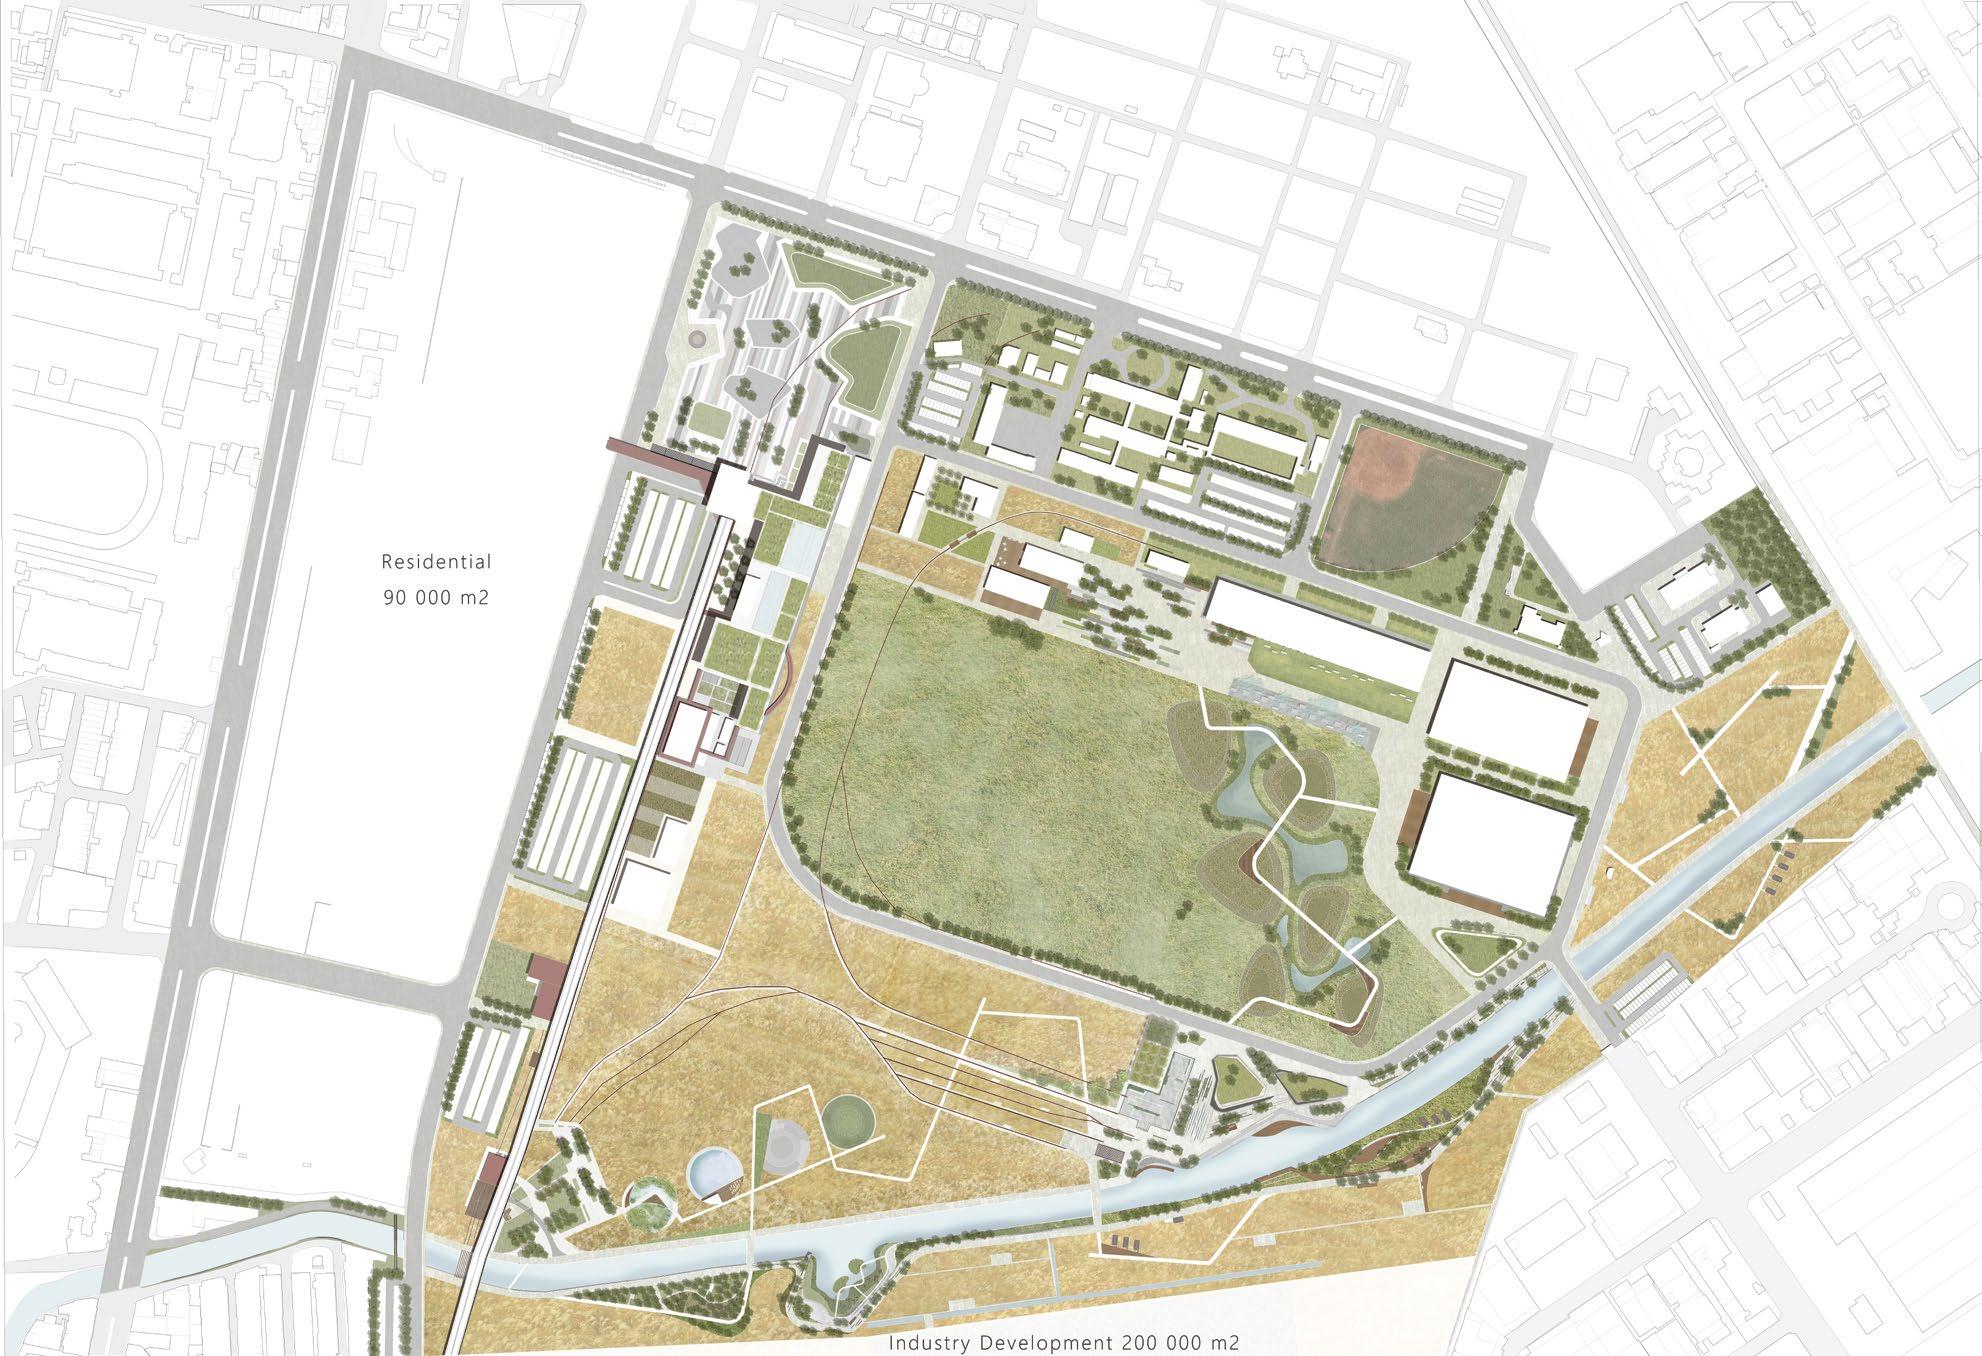
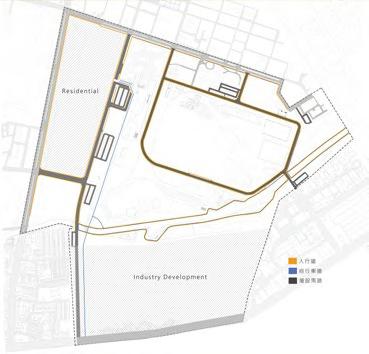
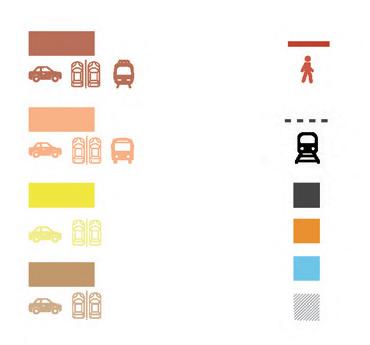
Buildings Vegetation Circulation Car Parkings


11
12
13
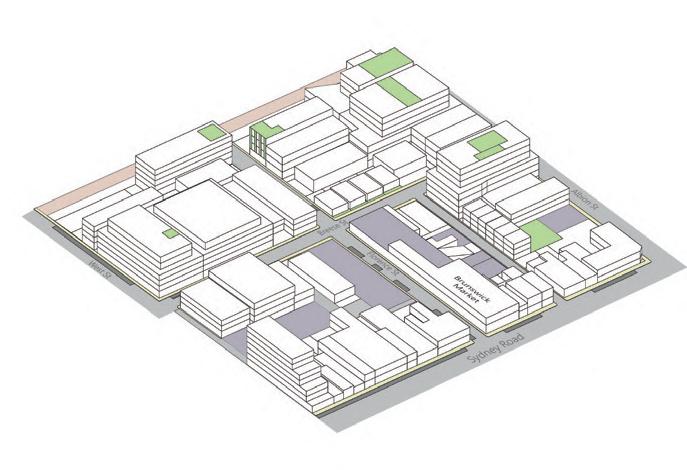
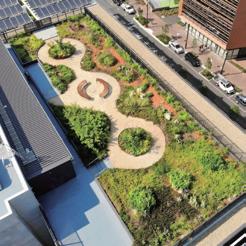
Green Urbanity
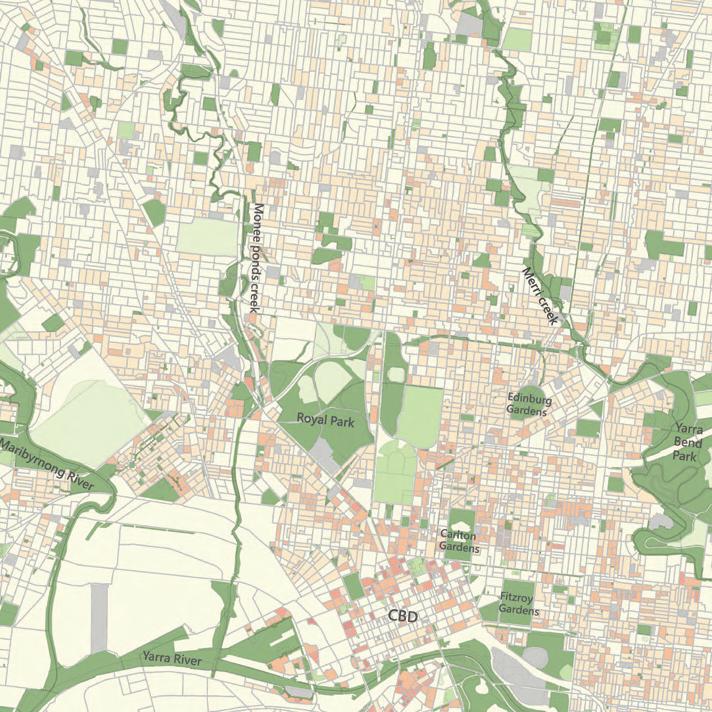
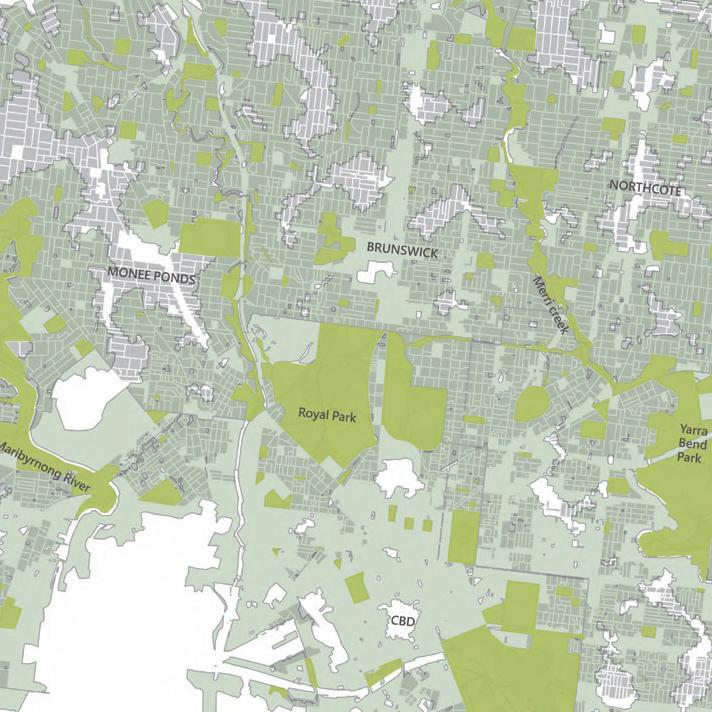
BRUNSWICK, MELBOURNE
SPATIAL ANALYSIS
10 x 10 km 1 x 1 km
Green spaces catchment
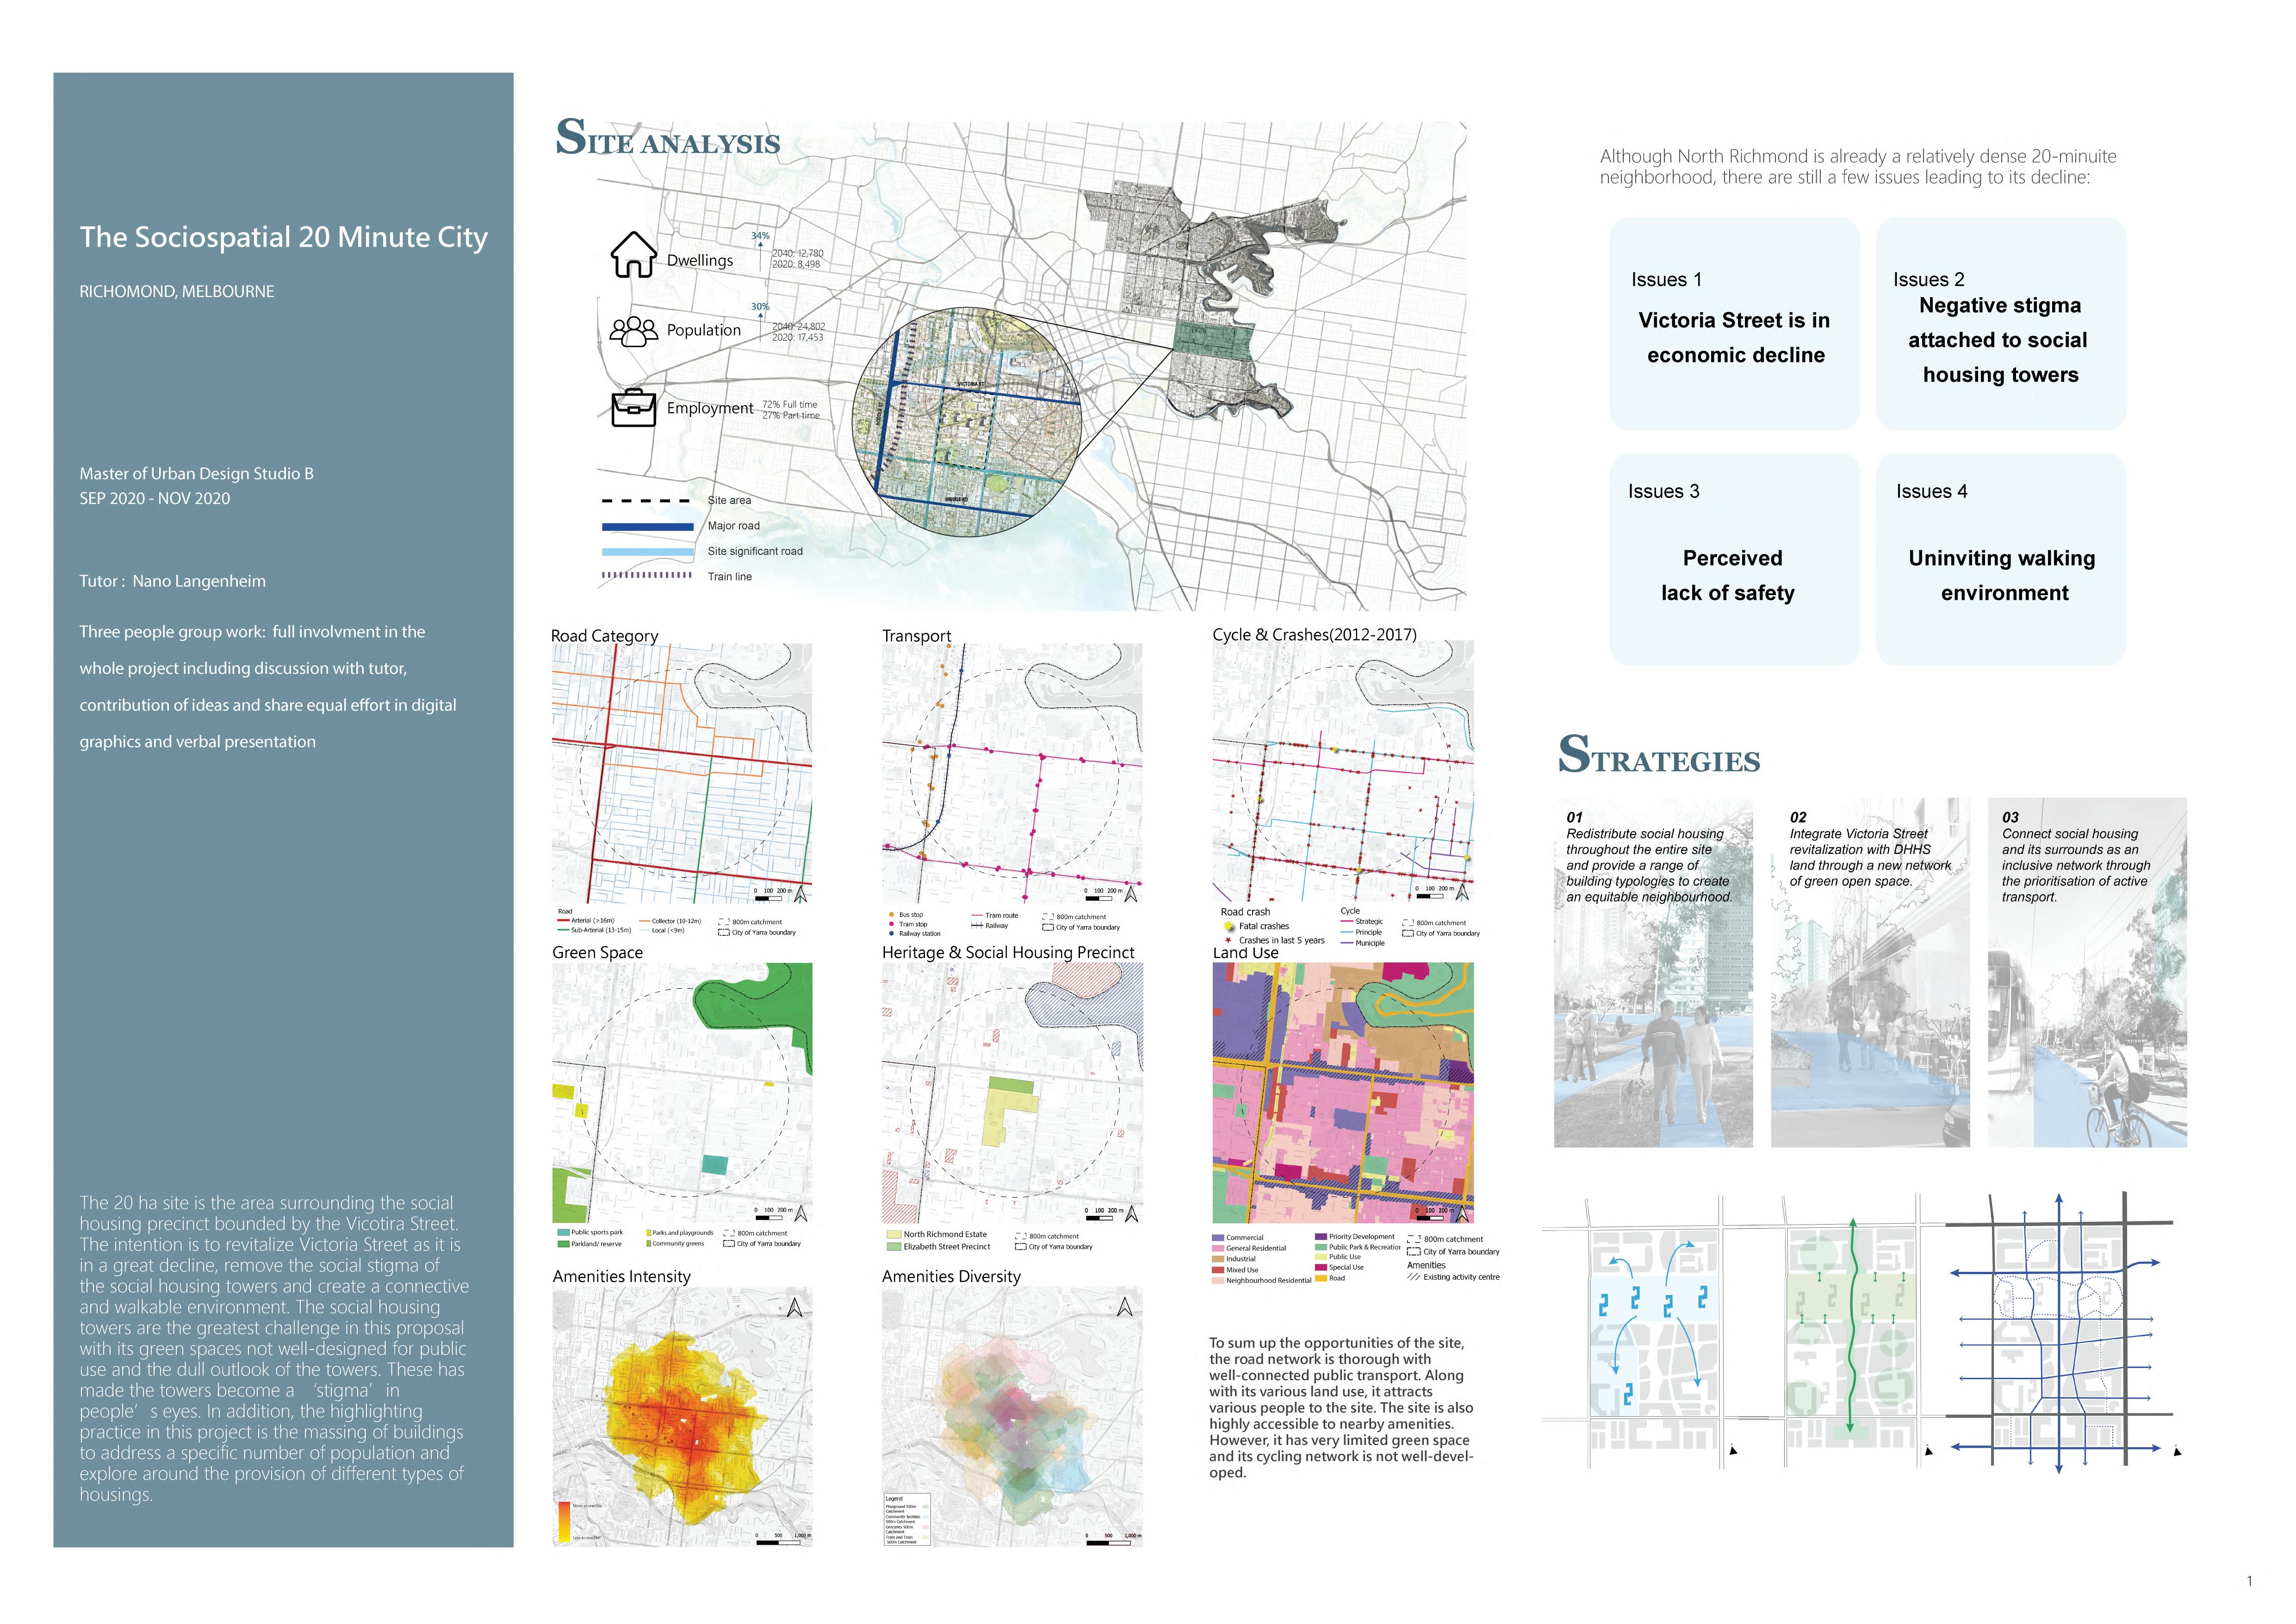
According to the ‘Open Space Strategy’ of the City of Melbourne (2012), the walking distance to open spaces is suggested to be within 400m. The 400m walking catchment shows that most parts of the inner city are well-served by provision of green spaces.
However, it is not the case for the inner north city especially in Monee Ponds, Brunswick and Northcote. Areas that are not accessible to green spaces are mostly residential areas, hence should be prioritised areas to be improved.
Master of Urban Design - Land Use and Urban Design (elective)
200 x 200 m Site
Green Amenities
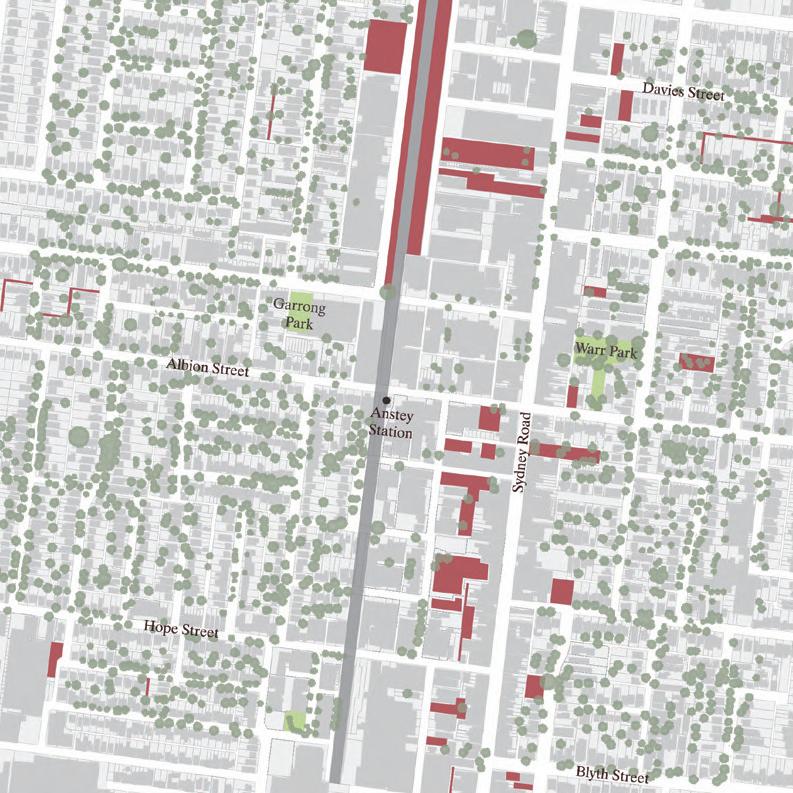
The neighborhood is evident in spatial segregation. The eastern and western sides are solely residentials typified by small grain size and low building height. Most of these houses have their own front or backyard green spaces.
However, the central proposed Brunswick Activity Centre (City of Moreland, 2017) comprises of commercial, industrial sites and higher density residential, typified by larger grain size and higher building height, have very limited private green spaces. Many of these flat roofs are potential to be utilized for greening.
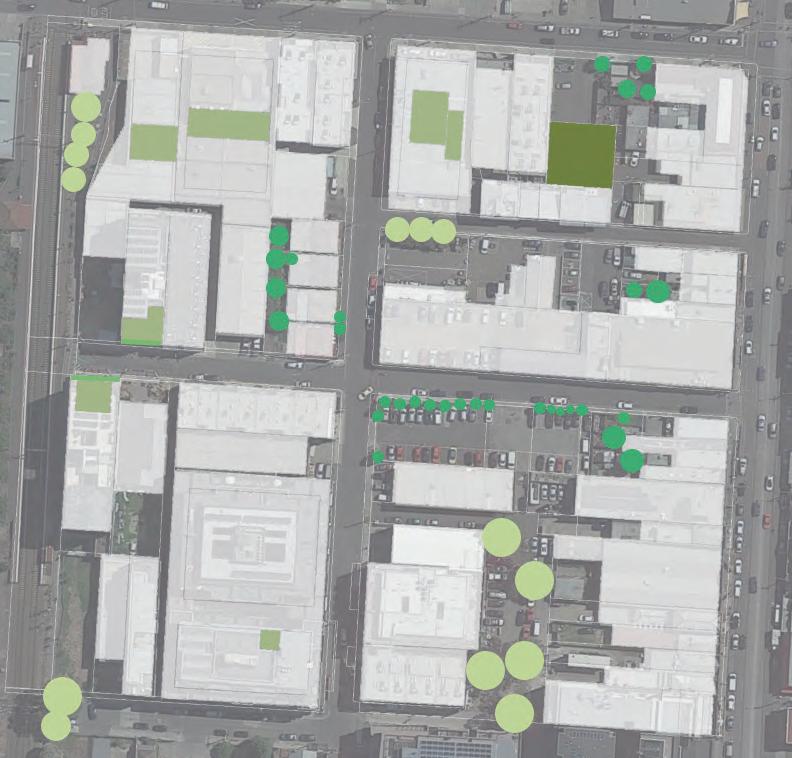
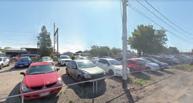
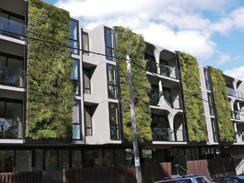
There is no public space in the site, only one ground level private green space are observed. The ground is highly occupied by surface car park rather. The majority of the trees are planted by private property and almost no street tree is present. However, it is good to see that some new private developments start implementing green roofs and walls.
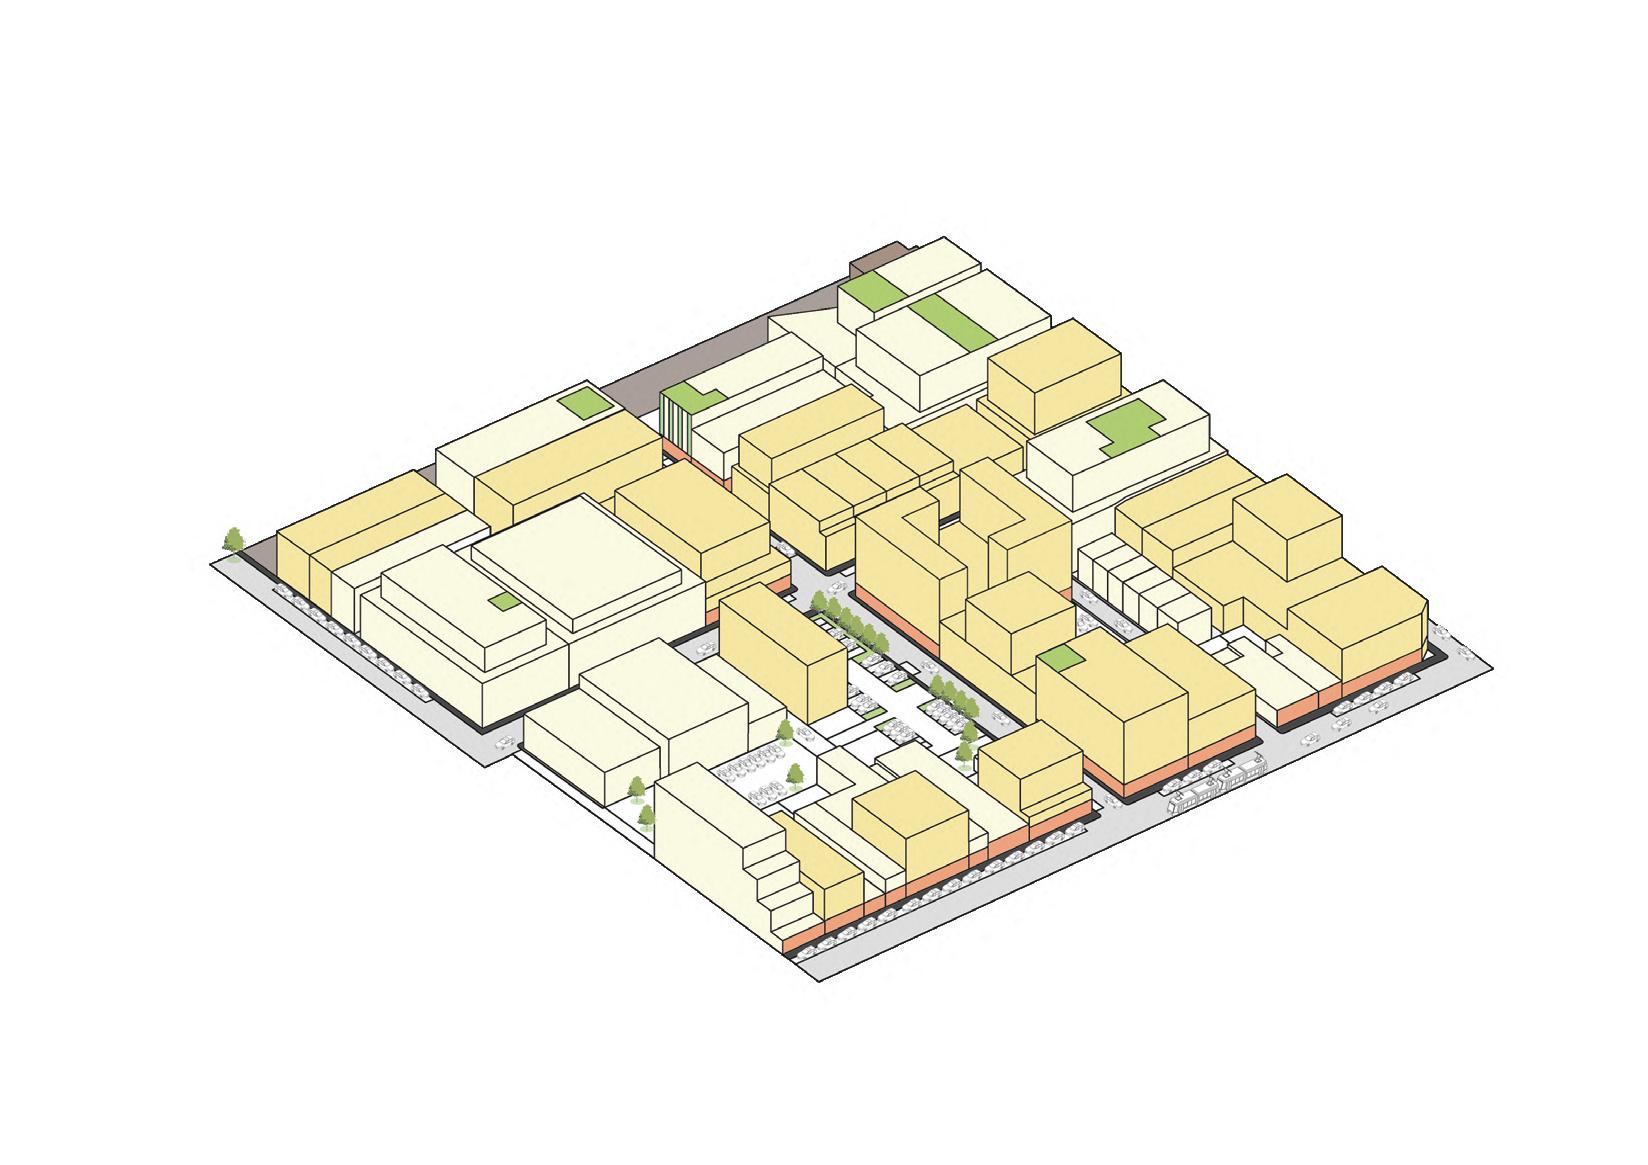
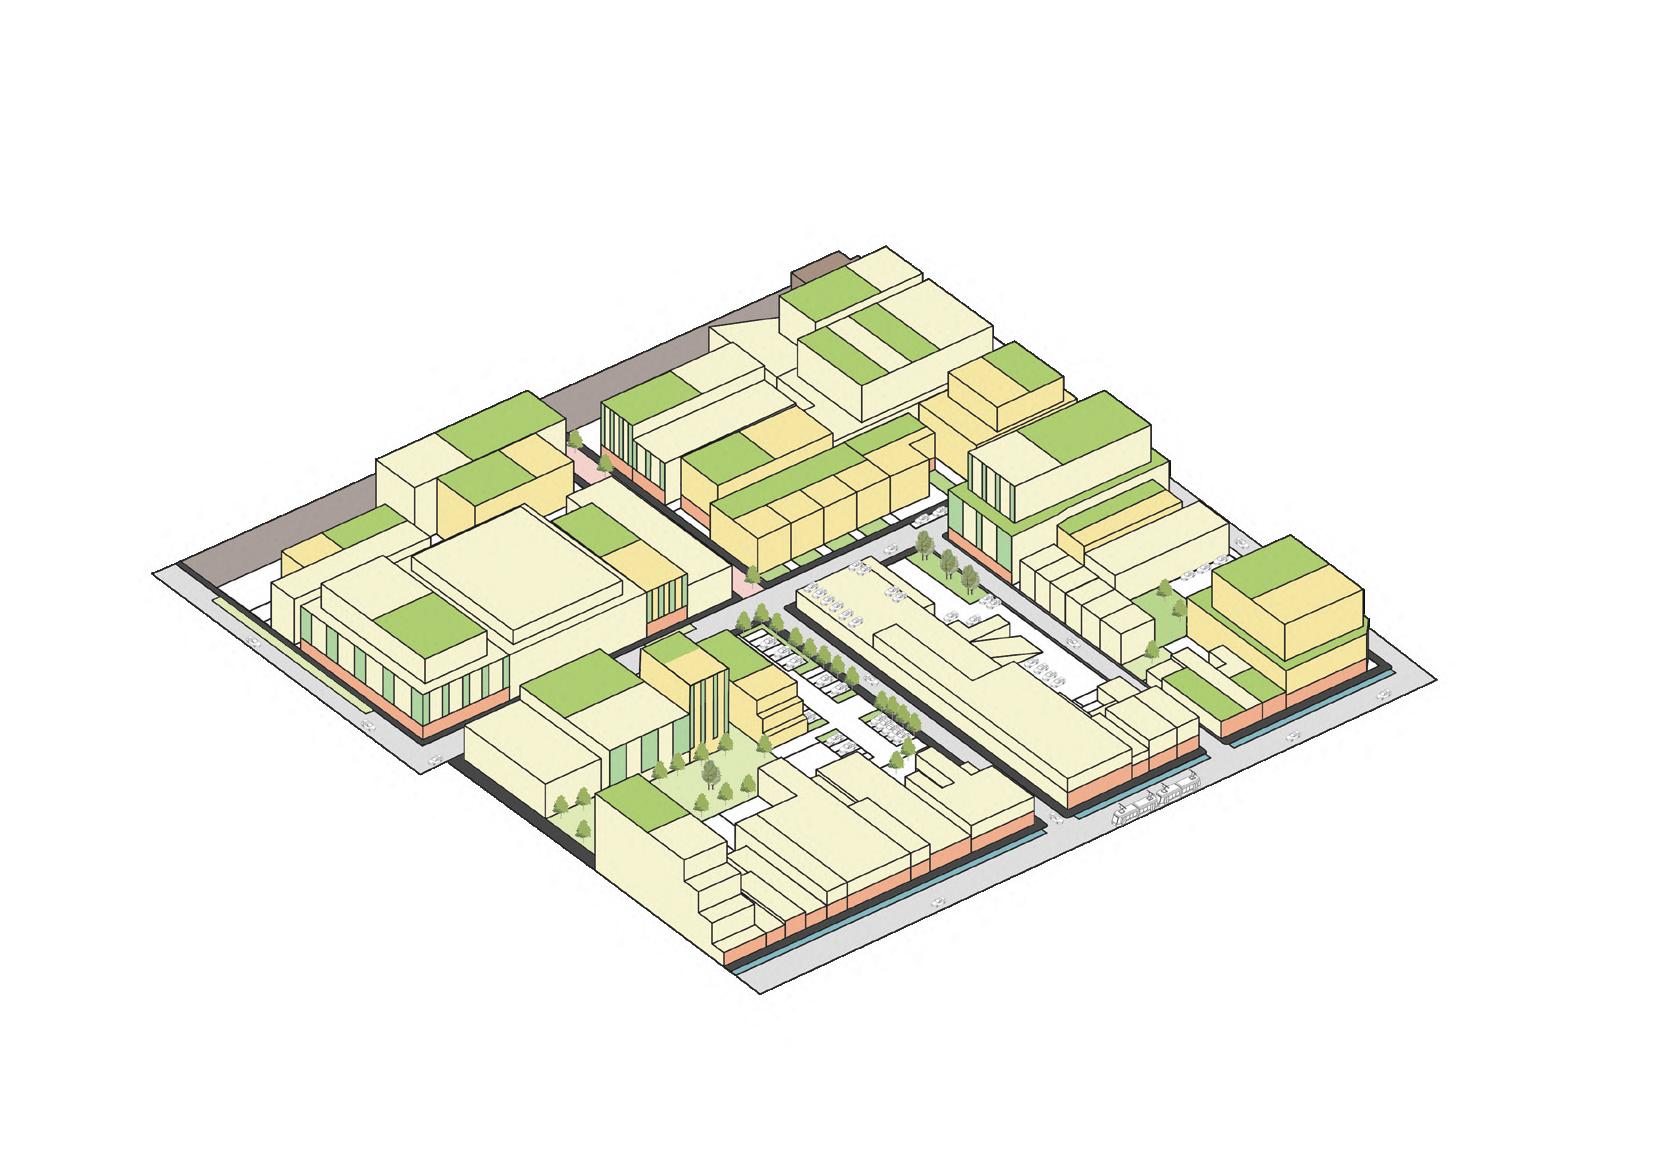
The main task of this assessment is to re-imagine possible futures for the chosen site in inner-north of Melbourne. With the application of urban design theories and knowledge, urban design practice is critically re ected and urban codes are used as tools to guide high quality urban development.
The project rst involves a multi-scalar analysis to identify opportunities and constraints of the chosen site, vision and goals are then set in respond to the site character and issues. Urban codes are subsequently set to guide the design of desired quality of public spaces. Lastly, three scenarios with di erent degrees of application of codes are tested.
The different access level of green spaces shows that the large publicly open green spaces are mostly located around the inner city while those in the inner north city are limited and in much smaller scale.
When overlaying the population desnity, an area in Brunswick (which is the selected site) has relatively high population density than the other inner north area but has very limited open green spaces.
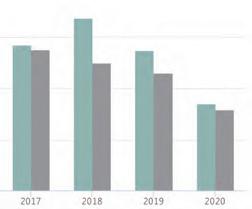
The change in resident population in Brunswick also has a positive trend and a larger change than the Greater Melbourne over the period 2017-2020 (Figure. 1). This population growth further urges a greener environment for the area.
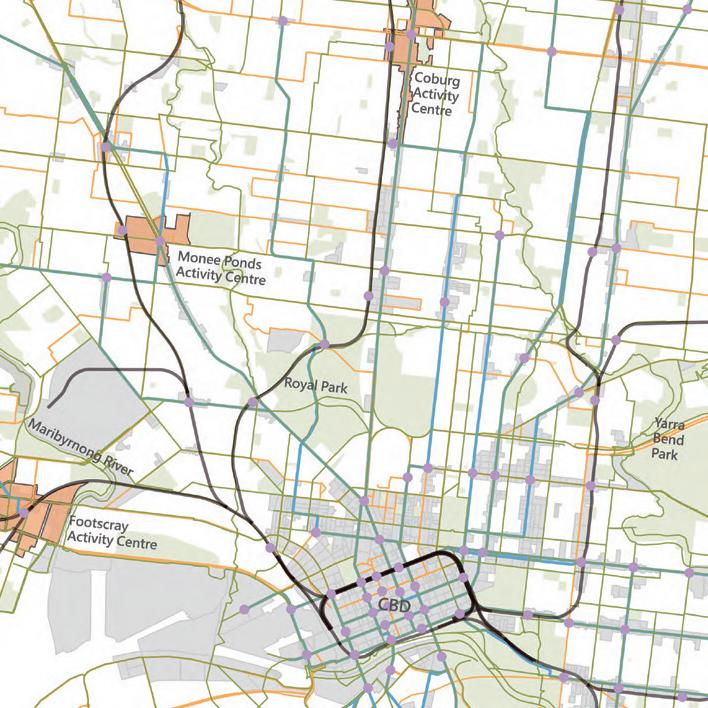
Transport and locations of interest
A green environment does not only focus on green spaces but also green transport mode.
The chosen to km neighborhood is considered as area of interest as it itself comprises of the Brunswick Activity Centre in local scale and is located next to the key Coburg Activity Centre.
Similar to the provision of green spaces, the inner north city is not well-served by publilc transport and cycling network compared to the inner city.
Hence, there is an opportunity to enhance green transport in the chosen neighborhood being a location of interest.
Vacant
Segregation is also seen in the tree coverage pattern. The commercial strip has created a huge gap within the green patch of the area with very limited amount of trees. Besides, very few green roofs had been observed. This reveals the significant need to increase public green spaces and enhance planting of street trees especially in the cetntral area.
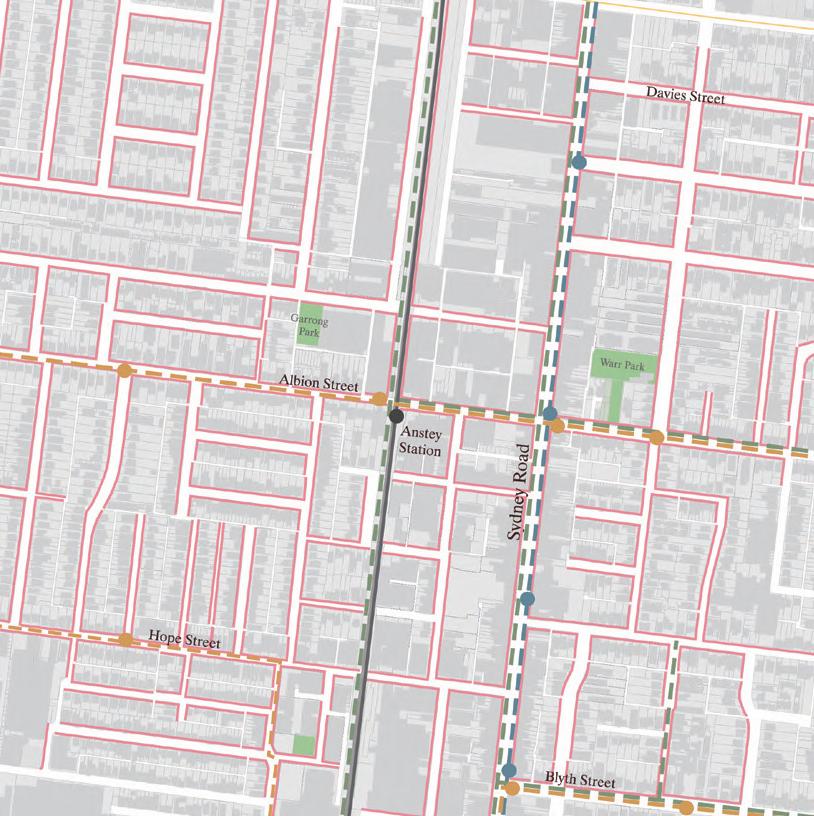
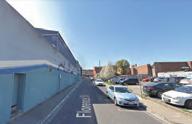
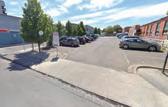
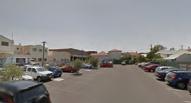
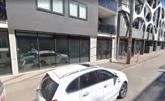
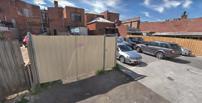
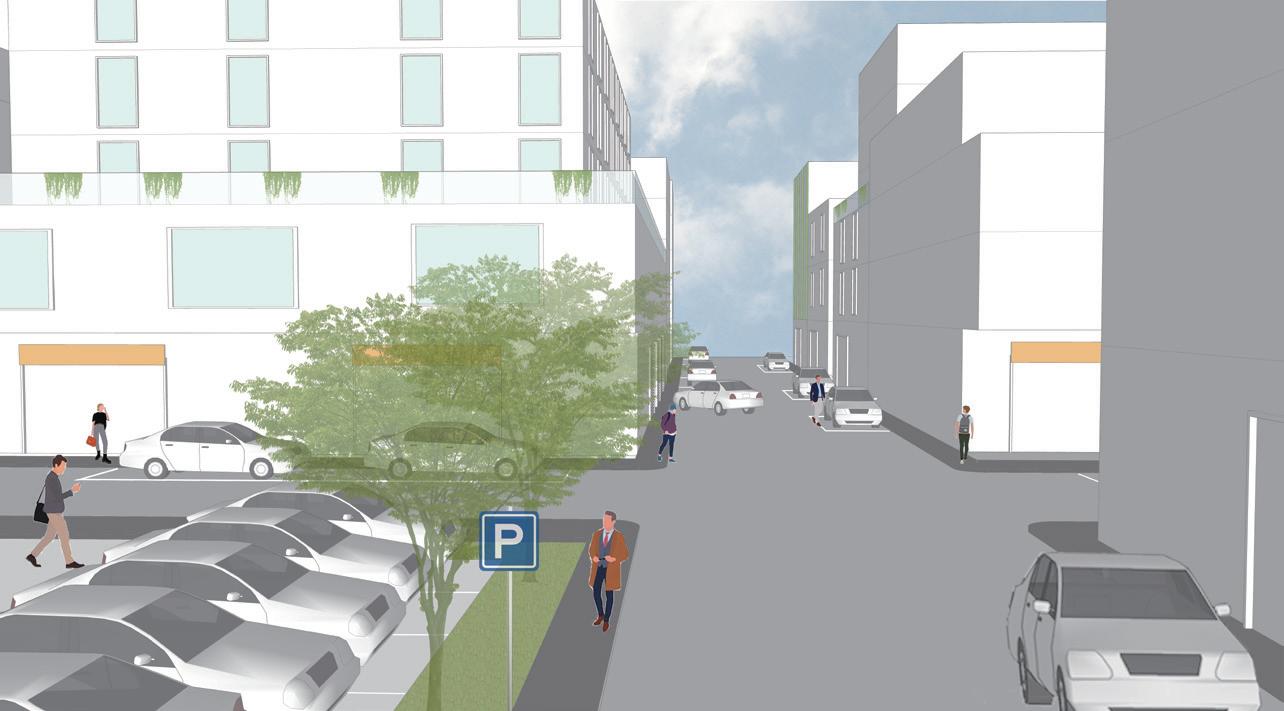
A number of vacant spaces, parking lots and dead-end lanes are observed in the area, especially in the central commercial area at Sydney Road and on the two sides of the train track. Dovey (2016) suggested that car parking spaces in a TOD development areas should be removed to open up opportunities for open spaces.
Interfaces Streets
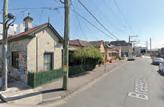
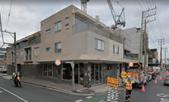
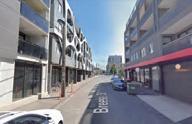
The area has very limited direct transparent interface, most shops are concentrated on Sydney Road. High vehicular transition and blank interface has made the street very inactive and unattractive to walk.
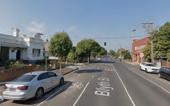
Although the use of car and public transport for travelling to local shopping area Sydney Road is not very high. There is still room to increase the use of walking, and especially cycling which only accounts for 6%.
Only the central area is better served with public transport and cycling network. Majority of the streets have prioritised vehicular uses where cycle paths are shared and narrow (Fig 6.).
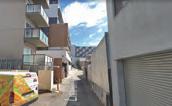
Protected footpahts are only seen around the large block (mostly larger than 200m) edge which reveals low permeability (Pafka, LUUD Lecture 4, 2021). Also, laneways within the block are not well-designed for easy and safe access (Fig 7.).
Summary
The
part of the area is well-serviced by public transport. Footpaths are connected but are very narrow since road spaces are occupied by on-street parking and vehicular uses.
400 m walking catchment green spaces residential data from ABS; VPA, 2020,
N 0 500 1000m Legends Population density & access of green spaces open limited highly limited closed 0-5000 5000-10000 10000-50000 50000-100000 100000-300000 population density ppl/sqkm) green spaces access level percentage change (%) Fig 1. Change in estimated resident population source: ABS) data from ABS; VPA, 2020)
500 1000m Legends
data from DELWP, PTV, ABS, PSMA) bus line tram line train line cycle paths points of interest commercial activity center green spaces
N 0 500 1000m Legends public green spaces Brunswick Activity Centre Legends
data from DELWP, MWC 50 100m Separate house 34.30% Medium density 39.30% High density 25.10% others 0.90% source: ABS, 2011-2016 Fig 2. Dwelling type in Brunswick vacant spaces, parking lots and dead-ends public green spaces
C
B
(mapped with Google Map) 50 100m Legends protected footpaths
source: Google Street View source: Google Street View (data from PTV, pedestrian path mapped Google Street View) 50 100m Legends Walking 50% Cycling 6% Public transport 24% Car drive 20% source: Munro, 2016) Fig 5. Transport mode to Sydney Road shopping area
A
private green spaces private green roof garden trees on public land trees on private land green walls Impermeable Blank Direct Transparent Vehicular Transition Pedestrian Transition Direct Opaque
spaces & Tree Canopy
N
northern
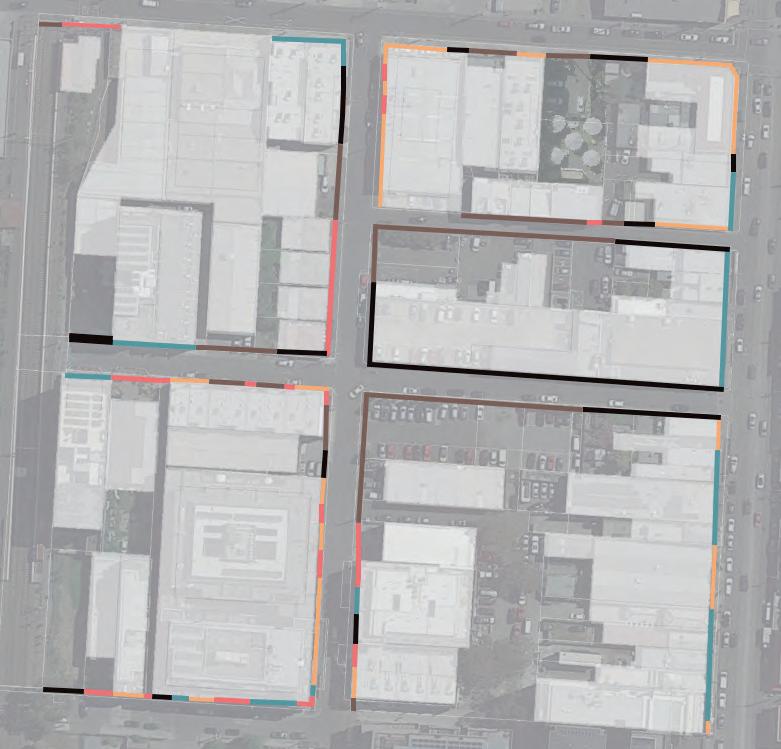
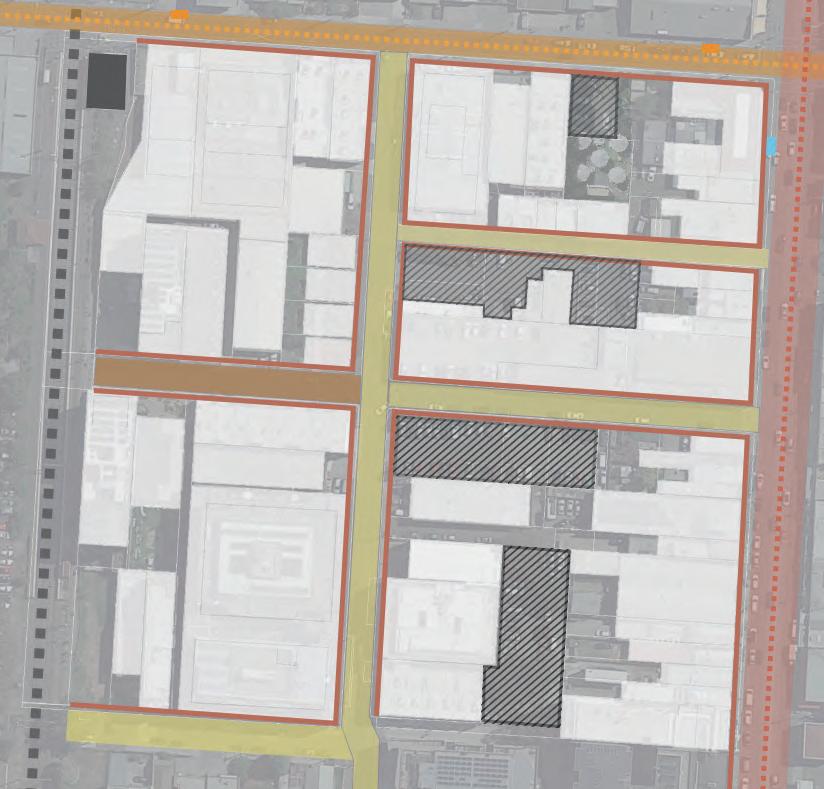
source: Virtual Moreland 3D Fig 3. Roofscape in Brunswick along Sydney Road source: Google Street view Fig 4. Vacant spaces in the nieghborhood Fig 6. cycling path in between on-street parking and road Fig 7. narrow laneways source: Google Street view Fig 8. Surface carpark source: Google Street view Fig 9. Street frontages images source: Google Street view Fig 10. Road layout on Breese St and Florence St 200 200m site 200 200m site 200 x 200m site Sydney Road Breese St Florence St Albion St West St William St Sydney Road Breese St Florence St Albion St West St William St Arterial road Primary local road Secondary local road Dead-end local road footpaths train line train stop bus stop tram stop surface carpark A B car park Anstey train station Tram stop Located within the activity centre and proximal to transit corridors increases the potential for more functional mix to activate the area and encourage sustainable modes of transport (Dovey et al., 2018; Dovey 2016). a few new developments attempt to implement vertical greening which could be expanded
Main issues streets prioritise vehicular uses, not pedestrian friendly insufficient provisions of green spaces both public and private very limited greenery on street poor contact with nature for residents inactive streets with limited active shop frontages Sydney Road Breese St Florence St Albion St West St Brunswick Market William St New development (unknown interface) New development (unknown interface) excessive amount of vacant spaces that could be utilized Main opportunities
AUG 2021 - OCT 2021 Tutor Ha Thai Individual work
414
VISION
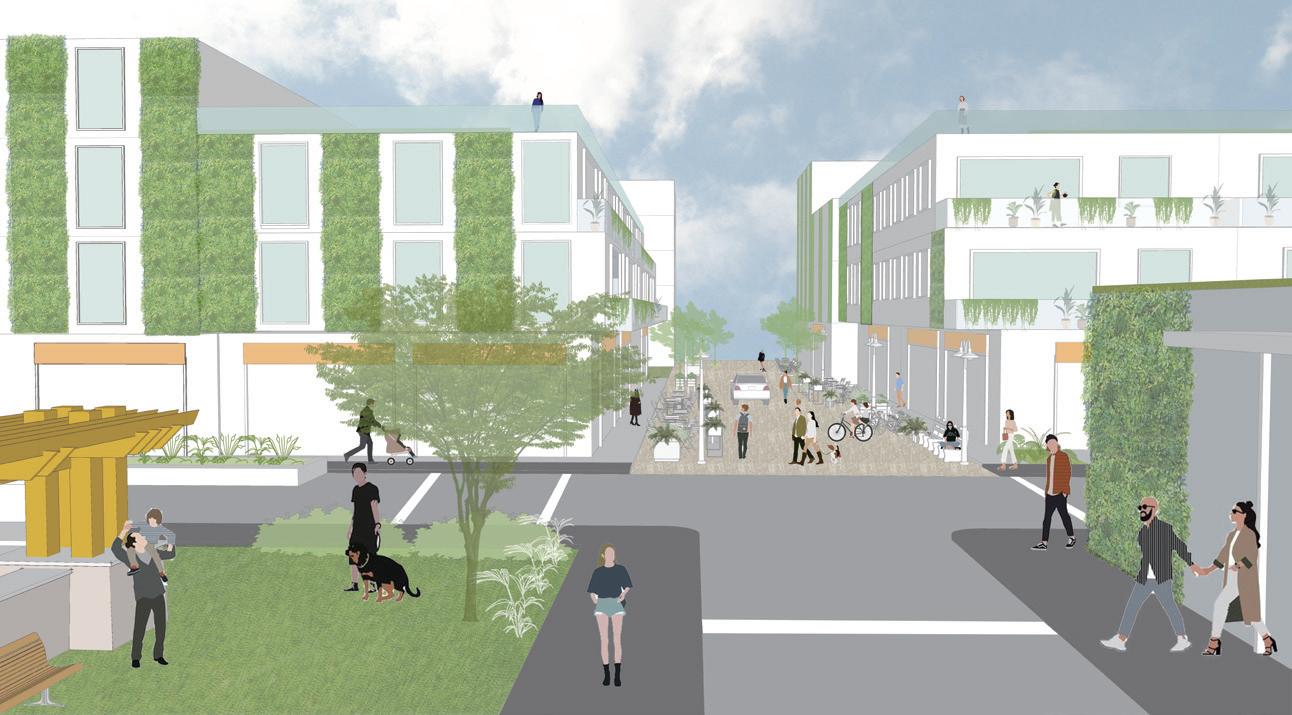
The Brunswick neighborhood will embrace a balanced green and built environment with the provision of su cient greenery, green spaces, and walkable and attractive streets, supporting the sustainable growth of the neighborhood.
Strategic Goals
1. Enhance walking experience
Walking experience can be enhanced by having streets that are safe, comfortable and attractive. Through the provisions of green infrastructure and street furniture on footpaths, it allows people to meet and connect with nature. Passive surveillance can also enhance the sense of safety on streets (Jacob, 1961), it can be achieved by ensuring more eyes on the street.
2. Enhance street-life intensity
Diverse and active shop frontages at street level play a major role in de ning street activities in the neighborhood. It can be e ective in attracting people to walk along the street.
As a result of goals 1 and 2, safe and attractive streets can encourage people to prioritize walking as the primary mode of transport which promotes health and sustainable bene ts to the neighborhood (Marshall Julian D. et al., 2009).
3. Provide accessible Public & Private green spaces
Equitable access to public green spaces within walking distance of catchment will be ensured to the neighborhood. In addition, private green spaces will also be provided within the establishment of private developments.
4. Mitigate urban heat
Greening on the impervious surfaces in the densely built urban environment helps in mitigating climate change e ects and reducing urban heat island e ect. The neighborhood will be ensured with a more resilient and sustainable growth within the earth’s ecological limit.
CODES
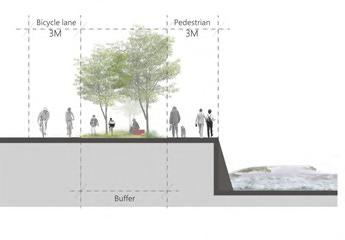
Code 1 On-street Green Infrastructure & Footpaths
Strategic objective
An e ective increase in the tree canopy, ensuring more contact with nature on street level and enhancing a more walkable pedestrian environment.
Expected outcomes
-The increase of greenery will contribute to mitigating UHIE, providing shading, cooling, contact for pedestrians
-The improved quality of footpaths will encourage more walking than driving in the neighborhood.
-Driveway still maintains its existing width and the addition of new pavement in the secondary local streets will put pressure on driving speed which further enhances the safety of pedestrians.
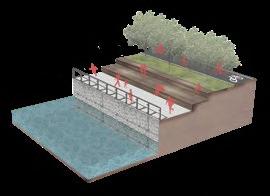
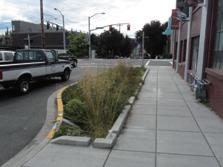
Case Study: Roadside raingarden in Portland, Oregon (source: nacto)
Guidelines
-All on-street parking must be removed
-Two options for road layout after on-street parking is removed:
1. Keep the exact existing road layout, parking spaces converted to raingardens
2. Maintain the existing number of lanes and rearrange road layout, an area reclaimed will be contributed to the wider footpath.
In both cases:
-footpaths >=3m wide must provide street trees in every 20m
-footpaths <3m wide must provide planter boxes on side close to driveway in every 4m.
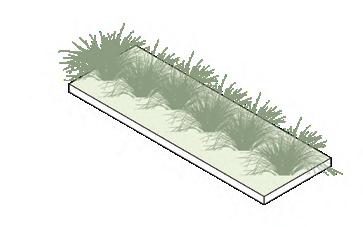
-for the arterial road (>=10m), the reclaimed spaces should be converted to at least 2m of cycling path in rst priority, raingarden in second priority.
-Native species are encouraged and should refer to Moreland Tree Planting Manual for Residential Zone (2014). planter boxes dimension:
-dead-end local roads must be converted to shared street
-must ensure a 20% of tree coverage of the whole street
-other green infrastructures such as edible farming boxes and planter boxes are encouraged and can be decided by residents.
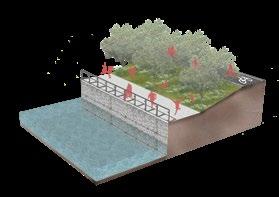
Shared Street in Madison, USA (source: CBC News)
-20% of the street area must be provided with street furniture such as benches and tables.

-20% of the restaurant’s outdoor dining area must be provided with planter boxes by the business.
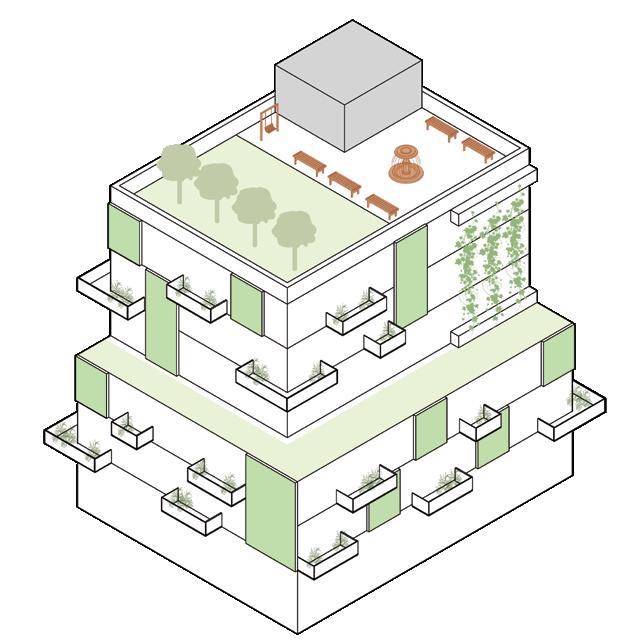
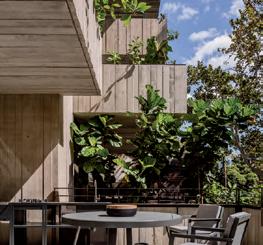
Code 2 vertical & roof landscaping
Strategic objective
To enhance contact with nature for people within their living spaces, especially for those in higher density residential buildings.
Expected outcomes
-The neighborhood will be cooler with the reduction of impervious surfaces, e ectively mitigating the urban heat island e ect.
-High level of greenery in all dimensions contributes to the aesthetic values of the city.
-Rooftop garden and private balconies will provide residents with proximal green and recreational spaces.
-Passive surveillance is enhanced through the activation of facades. -Green balconies and terrace plants could be very e ective in bu ering noise and dust according to Mladenovic et al. (2017).
Green
Extensive green roofs can reduce stormwater runo by up
65%, reduce
temperature by up to 18 °C
Guidelines
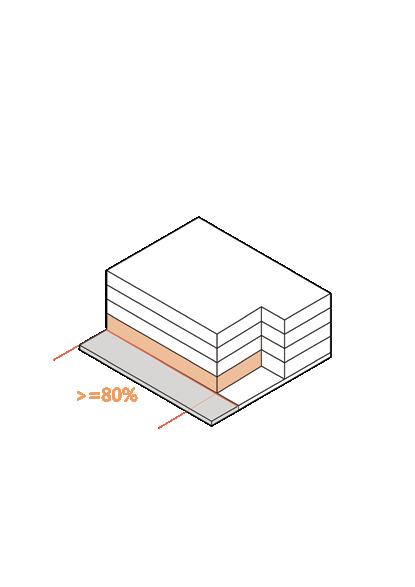
Green Setback
-building setback must provide at least 80% of green vegetation
-building setbacks requirements should refer to building and works overlay
Green Balcony
-Private balconies sized 10% of the residential dwelling area should be provided.
Green roof
-Rooftop garden must be provided and made accessible to residents
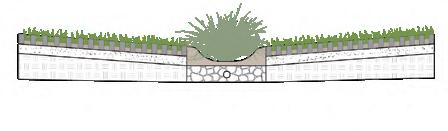
-At least 50% of rooftop area must be covered with green vegetation
-At least 20% of the rooftop area should provide recreational spaces for residents.
-Edible gardens are encouraged
Green Walls / Facades
-At least 25% of each detached facade should be incorporated with greenery
-Green walls or facades should be distributed in di erent oor levels except for the ground oor.
Case Study: Illura Apartments in West Melbourne (source: Fytogreen Australia, n.d.)
the urban temperature by up to 11.6 °C (source:tr.qld.gov.au; Koch et al., 2020)
Code 3 Greening Carpark
Strategic objective
To reduce the impact of impervious surface area in the neighborhood and regulate provisions of greenery in carpark.
Guidelines
-At least 20% of the site area must provide green coverage
-Planting areas location is not restricted but must be distributed throughout the site to ensure all people’s contact with nature
-bioswales system must be incorporated into the planting area
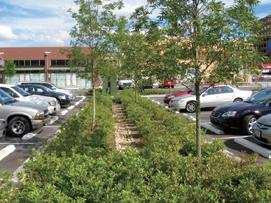
-Native species must be considered and layered landscaping consisting of trees, shrubs and grass is encouraged.
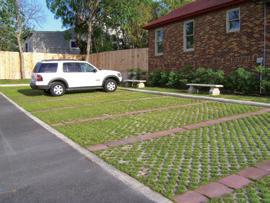
-Use one of the permeable pavements: grass paving blocks(a), interlocking system(b) or porous asphalt & concrete system(c).
Expected outcomes
-Essential parking spaces also contribute to cooling the neighborhood by reducing impervious surfaces, e ectively mitigating the urban heat island e ect.
-The evenly distributed vegetation can ensure a better contact with nature for people.
-Helps with water drainage in the area and enhances the blue landscape contributing to greater biodiversity.
-At least 30% of the balconies should include greenery, it can be in the form of climbers, urban farming units or large and small potted plants.
Short Lane in Surry Hills, Australia (source:Trevor Mein, n.d.)
-A variety of species with extensive and di erent owering times, textures and colors should be included.


-Aesthetic planting patterns should be considered with respect to street and neighborhood context.
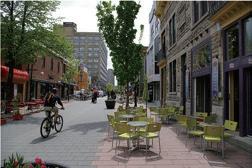
Code 4 Active Frontages
Strategic objective
To enhance streetlife intensity and attractiveness of street.
Guidelines
-All development over 500 sqm must provide commercial uses on the ground oor facing the street, occupying at least 80% of the development boundary.
-Height of the commercial oor must be 4-6m.
-Ground oor commercial frontages must have a minimum setback of 2m.
-The width of each premise frontage must be between 5-10m.
Facade character facing the street:
-All ground oor shops must have a translucency of at least 60%; garage must have at least 50% permeability
-All uses above the ground oor must have a translucency of at least 30%
Expected outcomes
-Passive surveillance is enhanced by having more eyes on the street through the highly translucent facade and the greater street life intensity enhanced by the shop frontages. -Commercial frontages will attract more people to walk in the street instead of driving, connecting people from the train station to the Sydney Road commercial strip.
-The ne-grained shop frontages are respectful of local character.
Yerrabingin Indigenous Rooftop Farm in South Eveleigh, Sydney (source: yerrabingin.com.au)
VISION Option2 Option1 Shared street
to
urban
walls can reduce
Bioswales in carpark in Millcreek Township, US (source: ywcacmlive) Grass locking pavement in Baltimore Annapolis, US (source: monash.vic.gov.au) Case Study: layered landscaping tree shrub grass (a) (b) (c) bioretention area2-5m grass blocks sand compact gravel base rainwater ltration soil mix Ground floor uses & setbacks
:
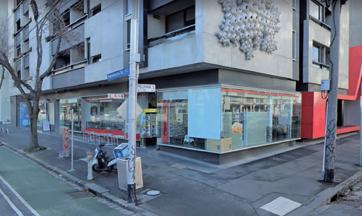
604 Swanston St in Carlton, Melbourne (source: Google Streetview)
ć ć ć ć 5 15
SCENARIOS
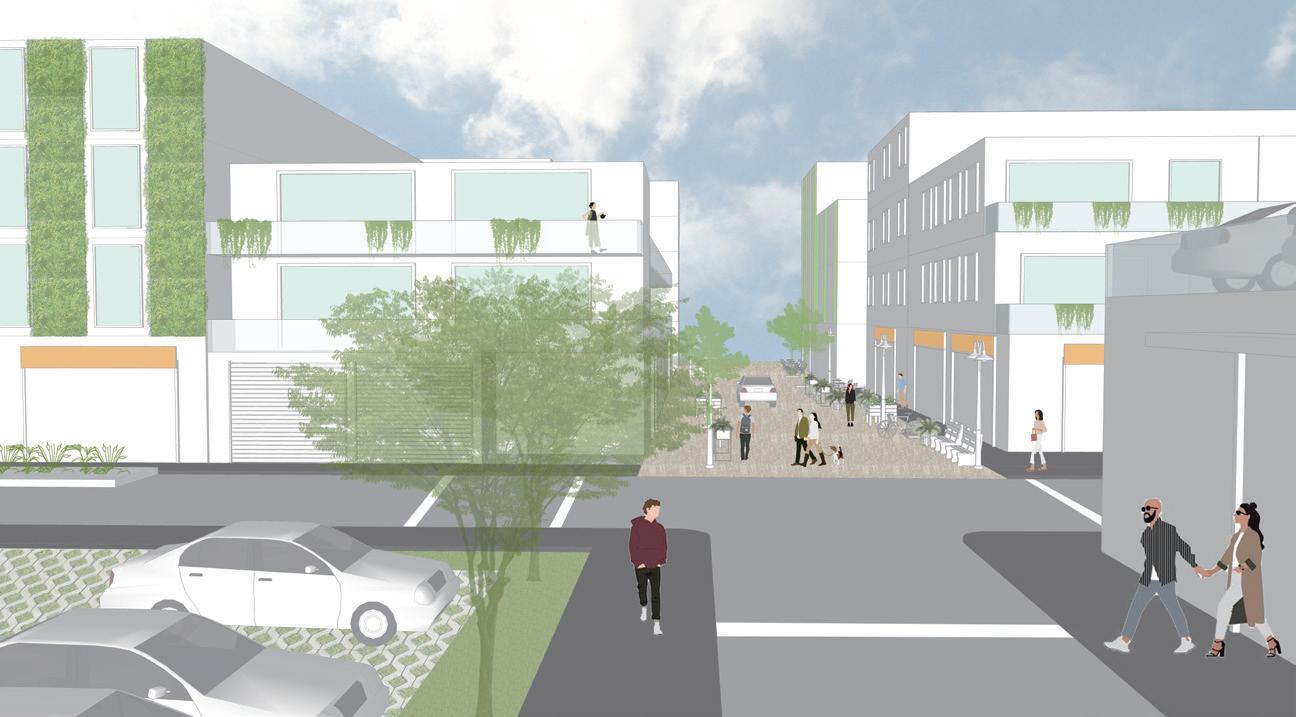
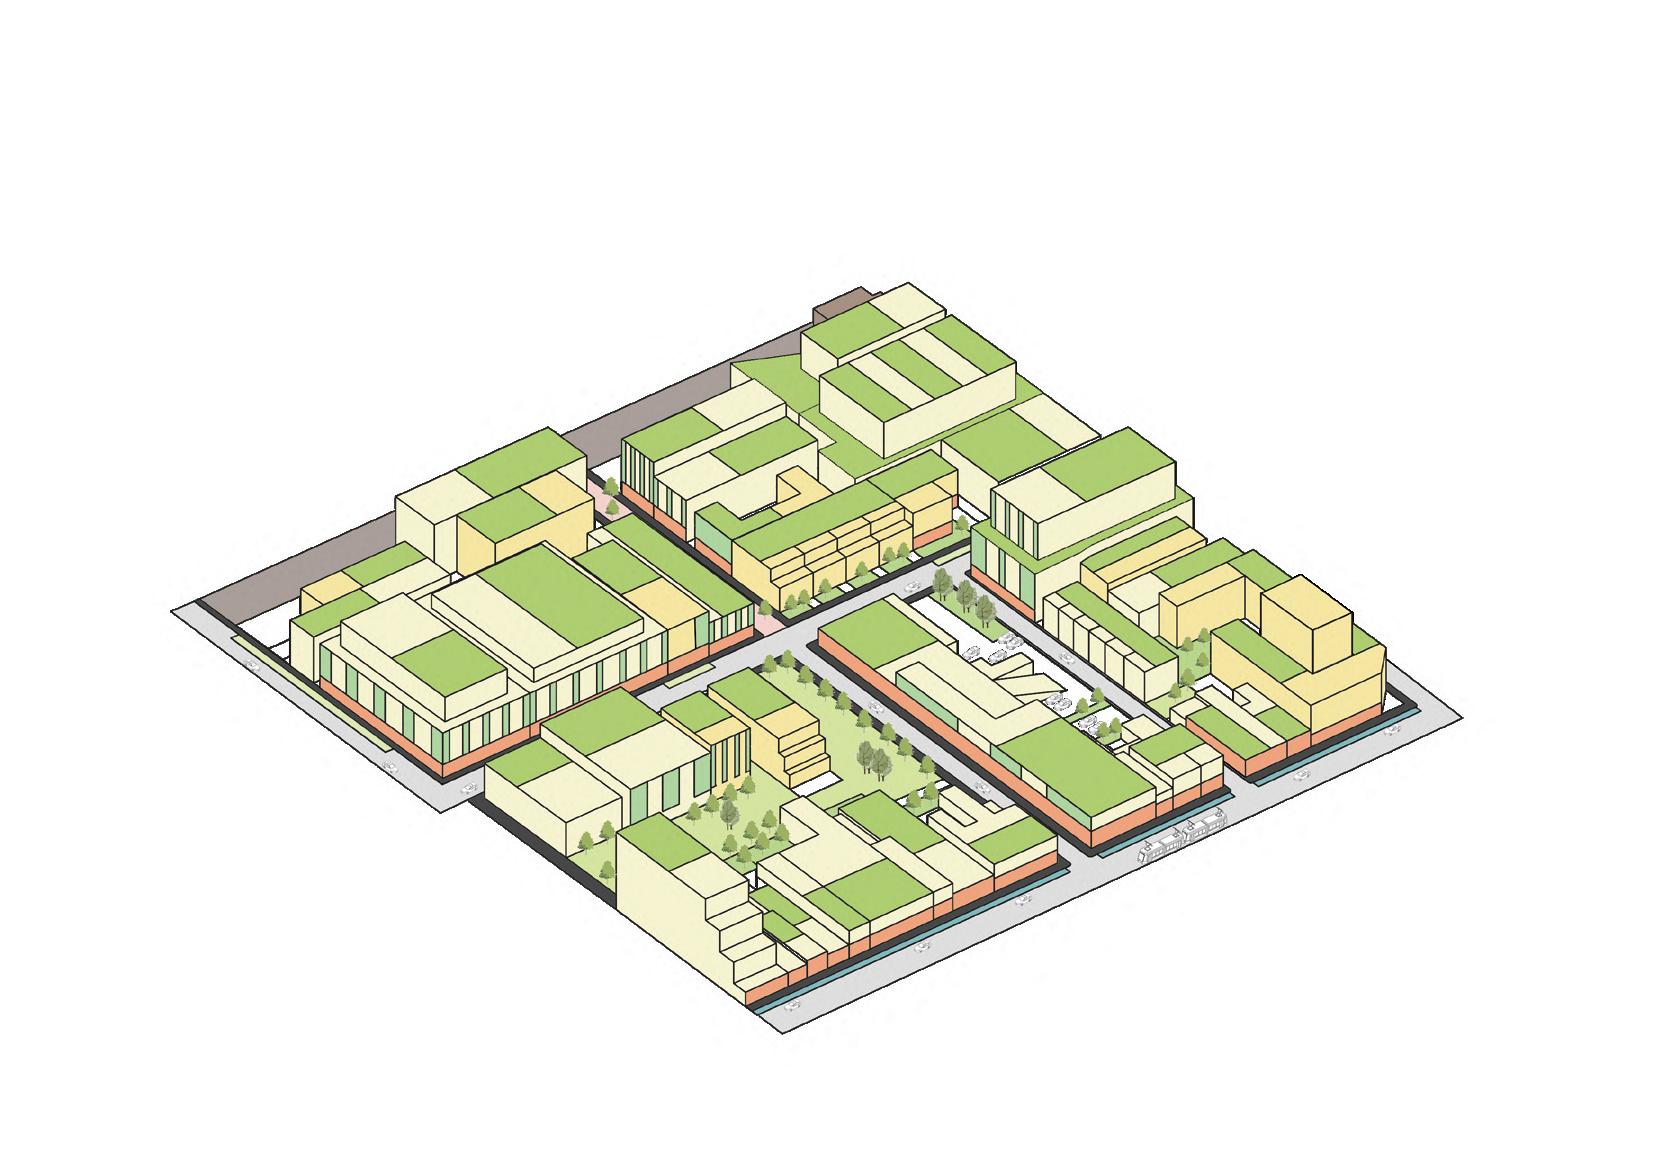
Intensification & use of codes 1 2 3 4 use of codes 1 2 3 4
use of codes 1 2 3 4 Balanced
Car
616
Scenario 1
Scenario 2 Urban Forest Scenario 3
Natural and Built Environment
Dependency