
Tonbridge and Malling Active Travel Strategy
October 2025
Appendix
Appendix
The preparation of this Active Travel Strategy has been funded through the Active Travel England Capability Fund 2024.


1 Foreword
Tonbridge & Malling Borough Council (TMBC) is ambitious for the future. We believe the borough is a great place to live and work, but we want it to be better. We want active travel to play a greater role in our daily lives, for walking, wheeling and cycling to be a natural choice for local journeys.
We also want to reduce our carbon emissions and changing the way we travel for local and longer journeys is a significant factor in working towards this aim. We are very dependent upon private vehicles that have negative implications for congestion and air quality.
A new Active Travel Strategy will assist the Council and its partners to deliver infrastructure and other improvements to achieve our ambition and is an important step towards the delivery of those measures that encourage walking, wheeling and cycling and are required to support both future growth and existing communities. Having an up-to-date Strategy allows the Council to take advantage of funding opportunities as these become available.
Recent high quality cycle infrastructure schemes demonstrate that people will use these routes where they are provided. Cycle routes provided alongside the A21 TonbridgePembury, the A228 West Malling Station-Kings Hill link and new routes connecting Peters Village and Aylesford have all been successful but require further links to become fully integrated.
Together we can change the way we travel for the benefit of our health, wellbeing, and prosperity.

CouncillorMattBoughton LeaderofTonbridgeandMallingBorough Council

CouncillorAdemMehmet
CabinetMemberforInfrastructureand TonbridgeRegeneration
2 Context
2.1.1 What is an Active Travel Strategy?
This Active Travel Strategy (ATS) sets out the priorities for encouraging active travel in the borough. ‘Active travel’ encompasses those journeys made by modes of transport that are fully or partially people-powered and can be summarised as ‘walking, wheeling and cycling’
2.1.2 Objectives
Make active travel the natural choice for local and multi-modal journeys.
Active forms of transport are convenient, inexpensive options for local journeys or for longer journeys that include public transport. Many people enjoy the freedom, social interaction and interest that walking, wheeling and cycling provide. Work and travel patterns have changed since the Covid-19 pandemic, with more people being locally based throughout the week, meaning that commuting trips have decreased.
Reduce the impacts of climate change.
TMBC has declared a climate emergency and has prepared a Climate Change Strategy –mode shift is part of the solution to reduce carbon and nitrogen emissions from vehicles and improve the air quality of the borough.
Integrate active travel into planning.
Definitions

Walking–foot/pedestrianmobility thatmayincorporatethesupportof aidstomobilitysuchassticks,canes crutchesetc.
Wheeling–wheeledmobilitiessuch asmanualorassistantpropelled wheelchairs,mobilityscootersand non-assistedscootersata pedestrianpace.
Cycling–widerangeofpedalpoweredwheeledtransportthat maybepoweredwithhandsand/or feet,maytransportoneormore persons,mayormaynotinclude electricassistance.

New development in the Borough will be required to maximise opportunities for sustainable travel; strategic development sites present a particularly clear opportunity to achieve this. The ATS will help to facilitate future housing and employment targets and provide alternative mode choice for existing and future residents, businesses and visitors. Streets and public rights of way can be designed to make walking, wheeling and cycling safe and attractive, and a mix of houses, shops and employment can reduce journey lengths and make active travel a viable option.
Improve health through increased physical activity.
Physical activity is associated with many improvements in health and wellbeing; inactivity directly contributes to one in six deaths in the UK. All adults should do at least 150 mins/week of moderate intensity activity, walking, wheeling and cycling for local journeys can make this a part of everyday life for residents and visitors.
Increase economic activity in urban centres.
Town centres that encourage safe pedestrian movement can provide economic benefits to local shops, restaurants and businesses. Measures that support wheeling and cycling can also discourage car use and help create attractive and pleasant areas to shop, eat, drink and socialise.
Reduce social inequality.
Residents of deprived communities travel less than residents in more affluent areas but feel the impact of other people’s travel primarily due to related noise and poor air quality. In short, increasing car dependency has led to increasing unfairness.
2.1.3 Scope of the Active Travel Strategy
The DfT’s Local Cycling and Walking Infrastructure Plan (LCWIP) guidance1 for authorities sets out a methodical approach to the planning and delivery of cycling and walking infrastructure. It breaks down the process into six steps, as shown below. This ATS has been prepared in accordance with this guidance and once adopted, will replace the current borough Cycling Strategy.
1 Determining Scope
Establish the geographical extent of the LCWIP, and arrangements for governing and preparing the plan.
2 Gathering Information
Identify existing patterns of walking and cycling and potential new journeys.
Review existing conditions and identify barriers to cycling and walking.
Review related transport and land use policies and programmes.
3 Network Planning for Cycling Identify origin and destination points and cycle flows. Convert flows into a network of routes and determine the type of improvements required.
4 Network Planning for Walking
Identify key trip generators, core walking zones and routes, audit existing provision and determine the type of improvements required.
5 Prioritising Improvements Prioritise improvements to develop a phased programme for future investment.
6 Integration and Application Integrate outputs into local planning and transport policies, strategies, and delivery plans.
Table 2-1: LCWIP Stages (source: DfT Local Cycling and Walking Infrastructure Plan Guidance)
The ATS is a high-level assessment and prioritisation of walking, wheeling and cycling routes in the borough, and whilst the feasibility of infrastructure improvements has been considered
in drawing up the route options, more detailed scheme assessments to inform value for money and deliverability will take place at a later stage.
2.1.4 Governance and Engagement
The development of the ATS has been led by the planning policy team of TMBC, reporting to the Director of Planning, Housing and Environmental Health, with support from DHA Transport Consultants. The political steer has been provided by the relevant Cabinet Member. The project has also been informed by an officer steering group, and KCC teams. The steering group has informed the opportunities identified, and discussed cross-boundary connectivity to ensure potential is maximised.
Having held workshop sessions with TMBC and KCC members in 2021 to discuss cycle route options, officers have kept TMBC members updated on progress through formal committees. TMBC carried out a cycle route priorities public consultation between 7th March 2022 and 18th April 2022, the feedback was presented to the TMBC Housing and Planning Scrutiny Select Committee (December 2023) and has been taken into consider in the preparation of this strategy.
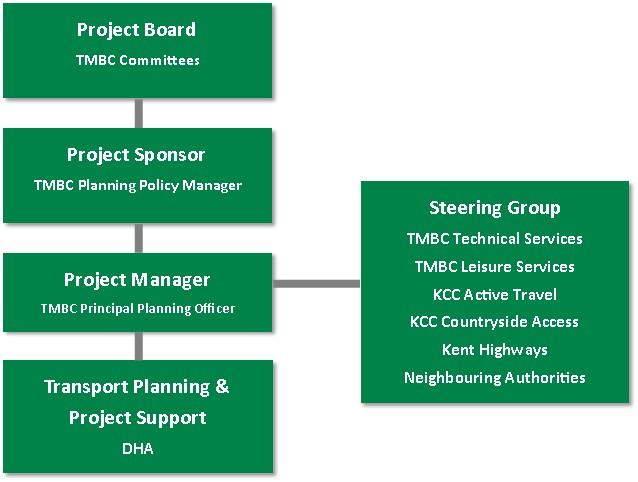
Figure 2-1: Project Governance Structure
3 Evidence Base
3.1.1
Policy Context
National Policy
National Planning Policy Framework 2024 (NPPF) – the NPPF sets out the Government’s planning policies for England and how these should be applied to provide sustainable development. Achieving sustainable development needs to meet economic, social and environmental objectives and plans should be prepared with the objective of achieving sustainable development. The NPPF is clear that walking and cycling are integral to the achievement of healthy, inclusive and safe places, Local Plans should therefore identify opportunities to promote these modes (para 109 e).
The NPPF requires that planning policies should “provide for attractive and well-designed walking and cycling networks with supporting facilities such as secure cycle parking (drawing on Local Cycling and Walking Infrastructure Plans)” (para 111 d).
Gear Change2 - In July 2020, the government published ‘Gear Change; a bold vision for cycling and walking for 2020-25’. Their vision is for a country that ‘will be a great walking and cycling nation’; that ‘places will be truly walkable. A travel revolution in our streets, towns and communities will have made cycling a mass form of transit. Cycling and walking will be the natural choice for many journeys with half of all journeys in towns and cities being cycled or walked by 2030’. The government announcement included £2bn ringfenced funding for walking and cycling overseen by Active Travel England, a new inspectorate.
Cycle Infrastructure Design LTN 1/203 – this Local Transport Note, published by the DfT, sets standards for the quality of cycling infrastructure. It reflects current best practice, standards and legal requirements, and considers cyclists of all ages and abilities. The Government’s intention is that cycling infrastructure that requires Government funding will be consistent with the guidance.
County Policy
Kent Cycling and Walking Infrastructure Plan (KCWIP) – after public consultation, Kent County Council (KCC) approved its KCWIP in November 2024. The key outcomes of the KCWIP are:
A network plan for walking, wheeling and cycling, which identifies preferred routes and core walking and wheeling zones;
A plan for integrating the KCWIP into active travel planning policies, strategies, and delivery plans;
A prioritised list of routes and zones for future investigation and investment; and
A robust, evidence-based document which sets out the underlying analysis conducted and provides a narrative which supports the identified improvements and network.
The KCWIP identifies a primary cycling desire line between Sevenoaks town and Tonbridge, with a tertiary desire line between Tonbridge and Hadlow and between Paddock Wood and Cranbrook. 25 primary desire lines were taken forward for further evaluation and from this, 15 cycling routes were selected for advancement. The primary desire line route between Sevenoaks town and Tonbridge was not selected for advancement though there are
proposals for enhancing the ‘walking and wheeling’ zone in Tonbridge. It is the intention that the priorities presented in this ATS will be integrated into the KCC 10-year plan.
Local Transport Plan 5 – Striking the Balance4 - KCC published their fifth Local Transport Plan (LTP5) in December 2024. The challenges identified in LTP5 include the negative impacts of traffic on congestion, air quality and Kent’s economy, worsening public health such as obesity and life expectancy and emission forecasts are unlikely to contribute towards reducing the worst effects of climate change.
Policy Outcome 9 states that ‘Health, air quality, public transport use, congestion and the prosperity of Kent’s high streets and communities will be improved by supporting increasing numbers of people to use a growing network of dedicated walking and cycling routes.
The associated Policy Objective 9 is that ‘We will aim to deliver walking and cycling improvements at prioritised locations in Kent to increase activity levels and support Kent’s diverse economy, presented in a Kent Cycling and Walking Infrastructure Plan’.
Active Travel Strategy5 (2017) - Kent County Council’s Active Travel Strategy sets out their vision for making cycling and walking the preferred option for residents taking short journeys, or as part of longer journeys that include public transport. The strategy contains an action plan to deliver its ambitions and objectives. It also sets a direction for partnership working across the county. An update to KCC’s Active Travel Strategy is currently being prepared.
Rights of Way Improvement Plan (2018-2028)6 - Kent County Council - The current Rights of Way Improvement Plan (RoWIP) has a vision to…
“provide a high quality, well-maintained Public Rights of Way network, that is well used and enjoyed. The use of the network will support the Kent economy, encourage active lifestyles and sustainable travel choices that support health and wellbeing, and contribute to making Kent a great place to live, work and visit”.
It recognises that the network is a key contributor to getting people out of their cars for everyday journeys and Active lifestyles is a key theme of the Plan. Part of KCC’s work in encouraging active lifestyles has been to identify improvements, linking schools to the wider PROW and cycle network.
Borough Policy
TMBC Local Plan (2024-2042) – The emerging Local Plan vision identifies that “Transport and infrastructure improvements alongside initiatives to reduce the need to travel and the provision of active and sustainable travel choices will have enhanced community health and well-being and contributed towards reduced harmful emissions”.
The following Local Plan objectives are also relevant.
Objective 1: Ensure development makes a significant contribution towards meeting long term emissions reduction goals of net zero by 2050, utilising land and materials efficiently and mitigating against and improving resilience to climate change in the borough.
Objective 2: Prioritise sustainable transport and active travel options alongside the timely delivery of required physical and digital infrastructure to support growth.
Climate Change Strategy (2020 to 2030) – The Council’s Climate Change Strategy sets out aspirations for a carbon neutral borough and the steps the Council will take in areas including transport. This identifies that the Council is working with Kent County Council and transport
operators to provide an integrated transport system that promotes lower carbon and healthy transport choices within the borough.
3.1.2 Existing Behaviour
The main source of data on people’s travel behaviour is the National Census. It is generally recognised that since the 2021 Census data was taken during the Covid-19 pandemic when national restrictions on travel were in force, the data relating to travel behaviour is considered to be skewed and therefore 2011 Census data provides a more robust basis for assessment. The 2021 Census data on Car or Van availability is unaffected by the Covid-19 lockdown and is considered suitable evidence.
Travel to Work (Census 2011) - The 2011 Census data shows that Tonbridge & Malling has a lower percentage of journeys to work by bicycle and foot at 10.7%, compared to the Kent figure of 13.7%. The Tonbridge Built-Up area has the highest levels of journeys to work by bicycle and on foot at 16%, and rural areas have the lowest percentage at 7.6%.
Car or Van Availability (Census 2021) - The Tonbridge & Malling area has a lower percentage of households with no car or van at 12.3% compared to the Kent figure of 17.5%. Tonbridge & Malling also has a higher percentage of households with 3 or more cars or vans at 13.6%, compared to the Kent average of 11.7%. The Tonbridge Town MSOA1 area has the highest percentage of households with no car or van (22.3%) and the Kings Hill and Wateringbury MSOA area has the lowest percentage at 5.4%.
Distance Travelled to Work (Census 2011) - Looking at distance travelled to work, only 30.6% of journeys in Tonbridge & Malling are less than 5km, compared to the Kent average of 39.1%. The Tonbridge built-up area has the highest percentage at 37.7%, and the lowest is in the Ightham built-up area at 17.2%. For those journeys to work that are less than 5km, 29.8% are taken on foot and by bicycle in Tonbridge & Malling, compared to 32.1% in Kent. Tonbridge & Malling also has a higher proportion of these journeys taken by a car or van, compared to the Kent average.
Sport and Physical Activity Levels - Sport England Active carries out two surveys on the activity levels of adults, children and young people across England.
Active Lives Adult (ages 16+)
The most recent survey data covers the period from mid-November 2023 to mid-November 2024 and shows that activity levels in England have bounced back to pre-Covid-19 levels, and while there is no reportable change in the proportion reported as either active or fairly active compared to November 2022-23, the proportion who are inactive has fallen by 121,000 (0.5%). The percentage of adults who are ‘fairly active: 30-149 minutes per week’ in the borough has slightly increased since Nov 22-23 and at 13.4% is higher than the Kent average. Unfortunately, the percentage of adults who are ‘active: at least 150 minutes a week’ has decreased from 68.6% in Nov 22-23 to 59.8%, bringing it below the Kent average of 62.9%. This has seen a corresponding increase in the no. of residents who are ‘inactive: less than 30
1 MSOA – Middle Super Output Area – output areas are the lowest level of geographical area for census statistics. An MSOA usually comprises 2,000 to 6,000 households with a resident population of 5,000 to 15,000 persons. A Lower Super Output Area LSOA comprises between 400 and 1,200 households, with a resident population of between 1,000 and 3,000 persons.
minutes per week’ which has increased from 18.9% to 26.8% over the same period.
Active Lives Children and Young People (ages 5-16)
The latest update on the Active Lives Children and Young People Survey is for the academic year 2023-24 and was published in December 2024. The report is based on responses from, and on behalf of, more than 100,000 children and young people aged 5-16 in England and highlights that there has been little movement in overall activity levels of children and young people in the UK over the previous two years. Insufficient schools in the Tonbridge & Malling area responded in 2022-23 and therefore the data was suppressed, and no results were published for this period. The latest results for 2023-24 show that there is a slightly higher percentage of children and young people in the borough who are classed as ‘fairly active: an average of 30-59 minutes a day’ compared to Kent (25.6% compared to 23.0%) while the percentage of ‘less active: less than an average of 30 minutes per day’ and ‘active: an average of 60+ minutes a day’ children and young people are very slightly lower than the Kent average.
Looking at the Tonbridge & Malling area between 2023-24 and 2021-22, it shows a dramatic increase in the percentage of children and young people who are classified as ‘active’ for an average of 60+ minutes a day from 36.6% to 50.1%. For those who are classed as ‘less active’; the figure has fallen from 37.4% to 24.4%. The percentage of those who are classed as ‘fairly active’ has changed little in the same period; 25.6% in 2023-24 compared to 26.0% in 202122.
3.1.3 Air Quality
There is an obligation on all local authorities to regularly review and assess air quality in their areas, and to determine whether or not air quality objectives, as set out in the Air Quality Strategy for England, Scotland, Wales and Northern Ireland (2007), are being exceeded. Where an exceedance is considered likely, the local authority must declare an Air Quality Management Area (AQMA). The Council has declared six AQMAs where the annual NO2 nitrogen dioxide objective is being exceeded. All of these are related to motor vehicle exhaust emissions and are therefore located on the road network at the following locations:
M20 - between New Hythe Lane, Larkfield and Hall Road, Aylesford
Tonbridge High Street (south) between Botany and the High Street/Vale Road roundabout
A26 - Red Hill/Tonbridge Road junction, Wateringbury
A20 Larkfield - London Road/New Hythe Lane junction and London Road (A20) towards Ditton
A20 Aylesford - London Road/Hall Road junction and London Road (A20)
Borough Green - incorporates the triangle area of Western Road, High Street and Sevenoaks Road (A25)
The latest Air Quality Annual Status Report (2025) shows that no exceedances were identified for nitrogen dioxide in or outside of AQMA areas in the borough. Overall, most of the AQMAs and site locations across the borough were only slightly down on the previous year’s results by between 1 or 2 µg/m3. The Council is proposing to revoke all its remaining AQMAs except for Wateringbury (AQMA 4) in 2025.
The priority measures that will be worked on to address air quality for the coming year will be to expand the anti-idling campaign across the borough through signage around most schools, to complete the roll-out of EV charging points in car parks and to explore the viability of a car club for Tonbridge town centre7 .
4 Network Planning for Cycling
4.1.1
Route Selection
The selection of potential routes has been carried out in accordance with the DfT Guidance, using the Propensity to Cycle (PCT) Tool8 which is a freely available online interactive map that shows the current and potential distribution of commuter cycling trips using the journey to work data from the 2011 Census.
The ‘cycling potential’ is calculated using a function based on trip distance and hilliness to show the potential number of people travelling to work by bike under one of four future scenarios:
‘Government Target’ scenario based on doubling cycling set out in the draft Cycling Delivery Plan;
‘Go Dutch’ scenario that uses Dutch propensities to cycle trips of particular length and hilliness;
‘E-Bike’ scenario that builds on the Go Dutch assumptions but also takes account of the role that electrically assisted cycles can play in facilitating longer distances and hillier routes; and
‘Gender Equality’ scenario in which women are as likely as men to cycle.
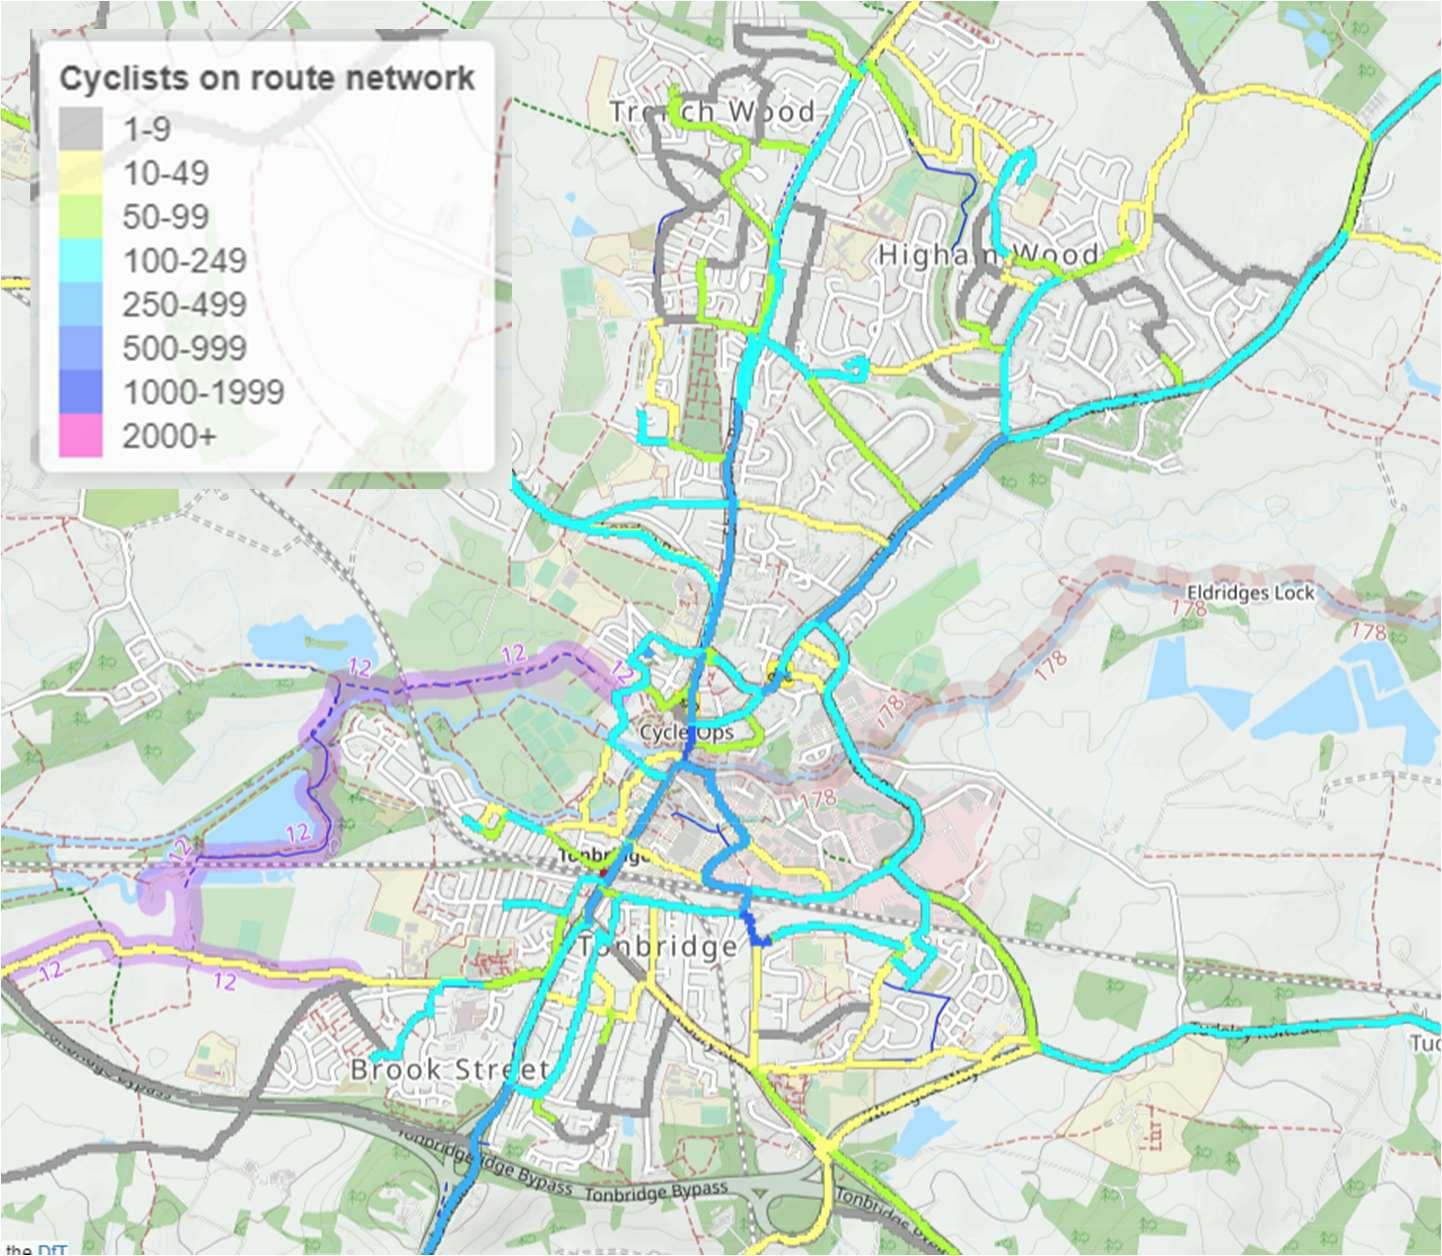
The forecast commuter cycle flows per day under the ‘Go Dutch’ scenario are shown in Figure 4-2 to Figure 4-4. The predicted level of cycling is shown as lines of various colours on the map, which correlate to the number of people cycling to work per day. The flows have been calculated at the LSOA network level, which provides more accurate forecast cycle flows compared to the MSOA level.
Borough Green
The geographic scope for the area was based on local knowledge of cycle movements within the area.
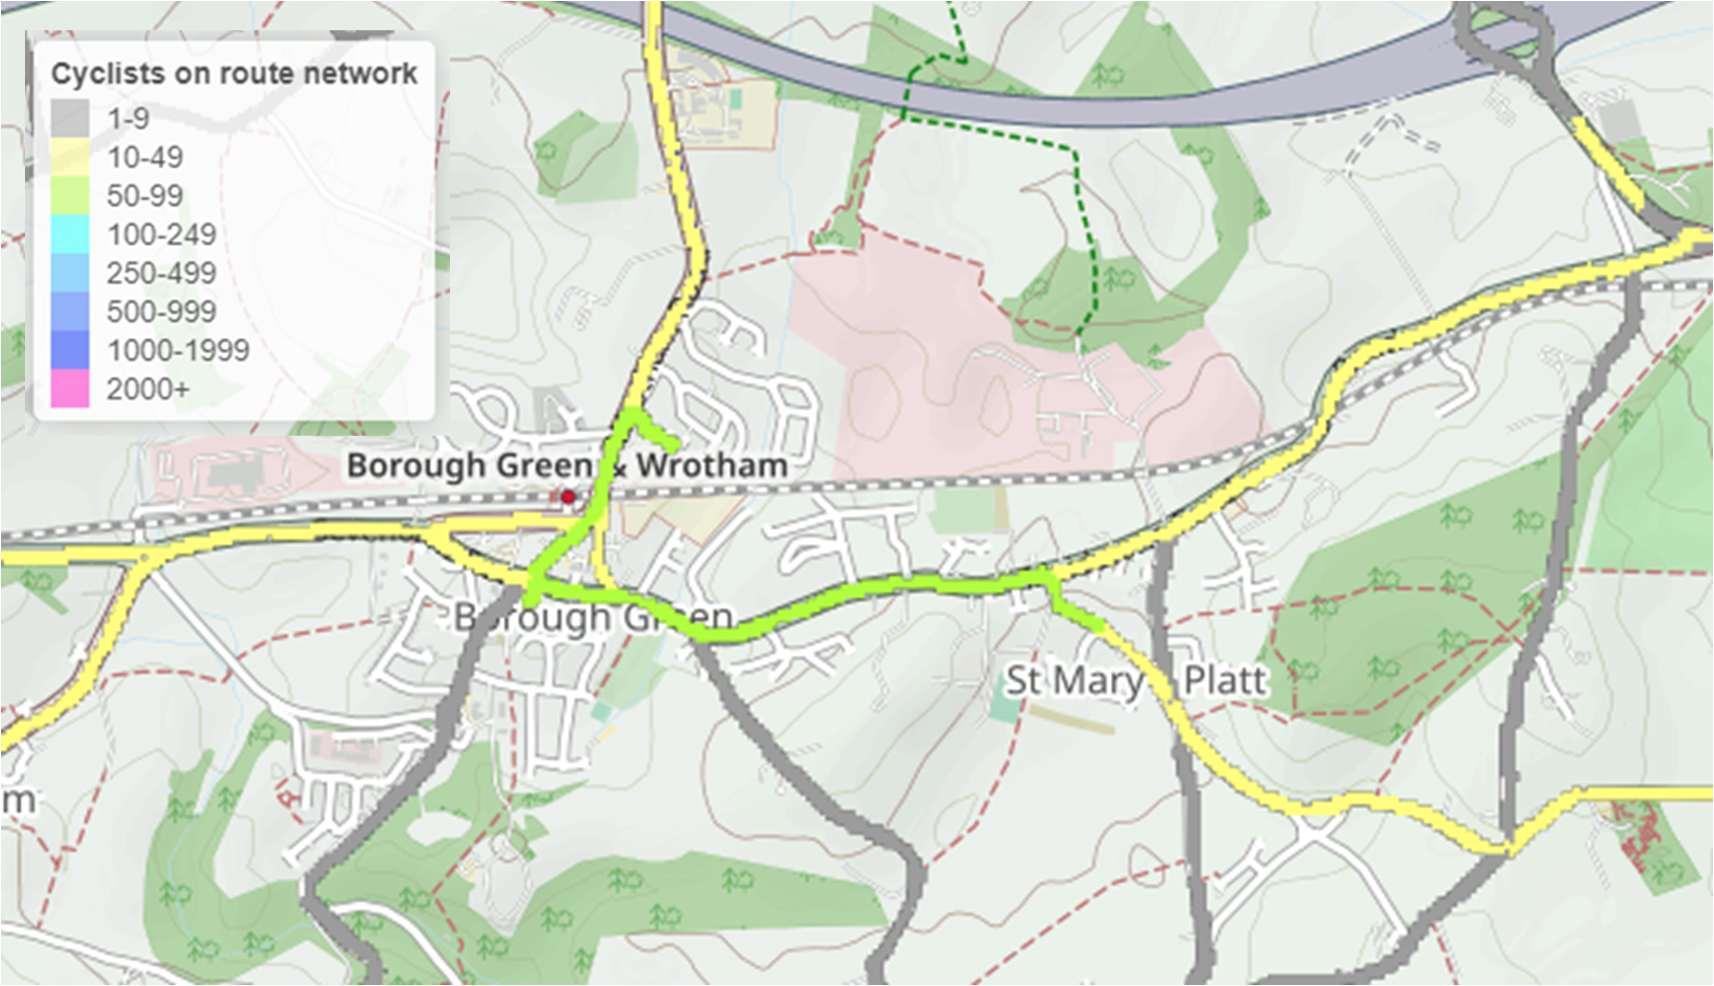
Figure 4-1: Borough Green - Cycling Potential for the ‘Go Dutch’ Scenario
Tonbridge
The geographic scope for the area was based on a 3km radius (12-min bike ride) from Tonbridge Railway Station.
Kings Hill & West Malling
The geographic scope for the area was based on local knowledge of cycle movements within and between the various urban centres, villages and train stations.
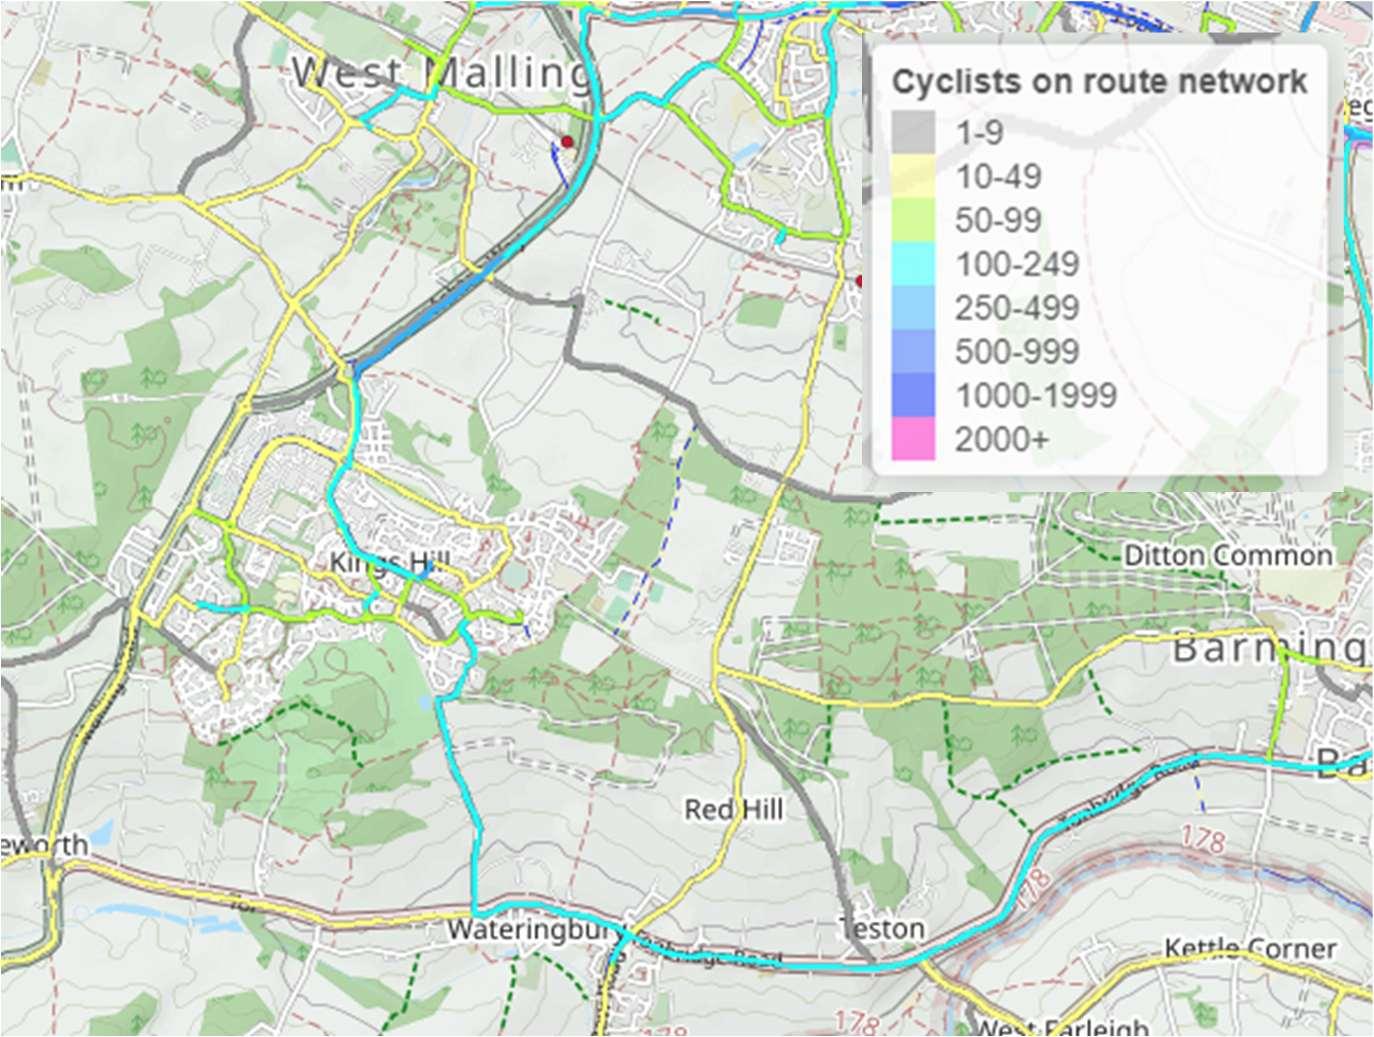
Figure 4-2: Tonbridge - Cycling Potential for the ‘Go Dutch’ Scenario
Figure 4-3: Kings Hill & West Malling - Cycling Potential for the ‘Go Dutch’ Scenario
Medway Gap
The geographic scope for the area was identified by local knowledge of cycle movements within and between the various urban centres, villages and train stations.
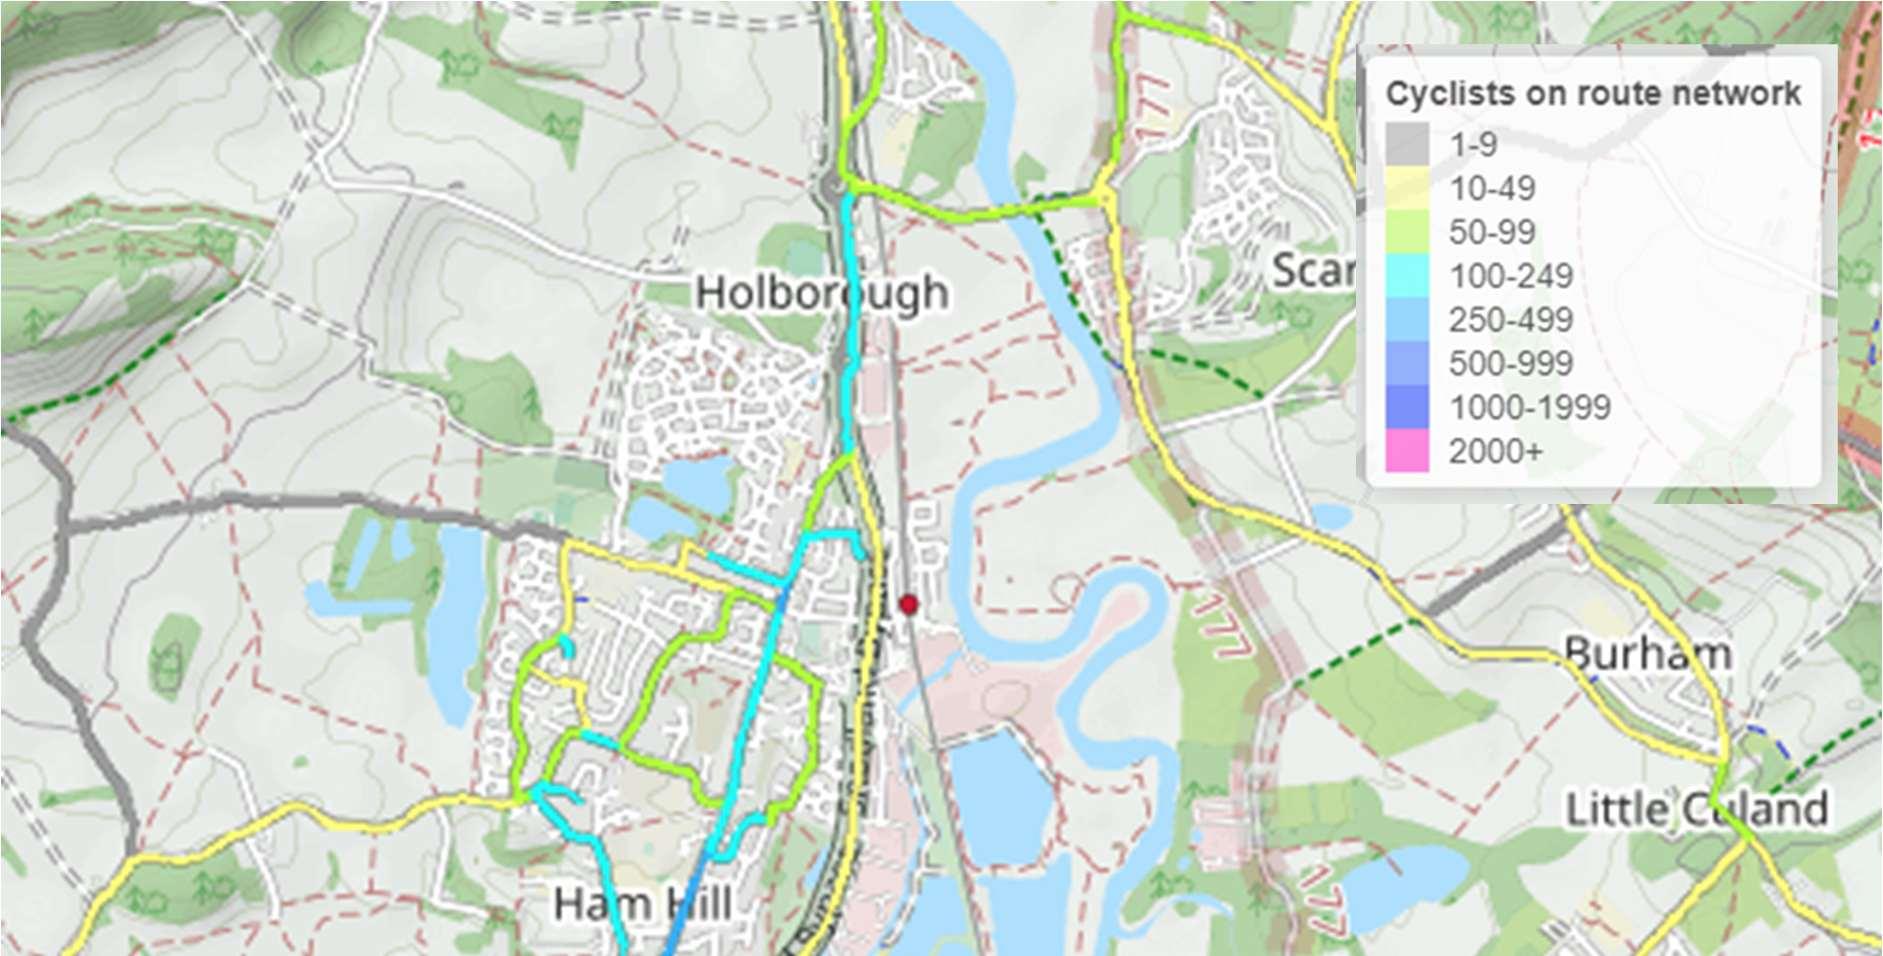
The mapping shows that there is significant potential to increase the number of local journeys undertaken by bicycle with Go Dutch scenario forecasting numbers of cyclists into the 500999 category on key routes/desire lines. The PCT tool demonstrates that there is substantial
Figure 4-4: Medway Gap - Cycling Potential for the ‘Go Dutch’ Scenario
unmet demand, and that the improvement and provision of a network of high-quality connected cycle routes could help to meet this.
4.1.2 Mapping Trip Origin and Destination Points
The next step was to map the main origin and destination points onto the PCT desire line maps across each of the four urban areas to include:
town and other urban centres.
employment areas or large individual employers.
educational establishments, including primary and secondary schools and colleges.
healthcare establishments, including hospitals and doctors’ surgeries.
retail facilities, including local retail centres, supermarkets and retail parks.
community facilities including libraries, visitor attractions, leisure centres.
transport interchange facilities, including bus stops and rail stations.
Once mapped, further desire lines were identified to account for recreational cycling. The proposed routes set out in the previous Cycling Strategy9 were also considered and added if still relevant. Potential cycling routes connecting site allocations in the emerging Local Plan were added to the network. These routes were then ‘sense-checked’ by officers applying local knowledge of available highway and PRoW opportunities in the context of draft Local Plan site allocations, as well as an understanding of the existing and potential future demand shown on the PCT desire line maps. The desire lines were then classified into the following categories:
Primary: High flows of cyclists are forecast along desire lines that link large residential areas to trip attractors such as a town or city centre.
Secondary: Medium flows of cyclists are forecast along desire lines that link to trip attractors such as schools, colleges and employment sites.
Local: Lower flows of cyclists are forecast along desire lines that cater for local cycle trips, often providing links to primary or secondary desire lines.
Following this classification, many of the longer distance routes between villages were discounted due to the low levels of cyclists these would attract for everyday journeys, it is acknowledged that these often-quieter routes are popular for recreational cycling. The final networks that were progressed for route assessment in each area are shown in Appendix A, the full route audits are available separately.
4.1.3
Route Assessment
Consultants DHA initially undertook the cycling route audits in late 2020/early 2021 with supplementary audits in 2025, in accordance with Stage 3 of the Department for Transport (DfT)’s Local Cycling and Walking Infrastructure Plans (LCWIP) process. The network of desire lines was divided into sections, and each section was assessed against the core design outcomes of directness, gradient, safety, connectivity and comfort, to produce one of the following viability scores:
An example of the background data collected for a typical section is included in Appendix B.
Where the most direct route was found to be unsuitable; mainly due to engineering and land ownership constraints, improvements were considered and failing that, an alternative route was considered where possible. Supplementary sections were added to the audit scope during summer 2021, in response to the findings from the initial audits and opportunities and issues that had arisen in the interim. Further revisions were made following the cycle routes prioritisation consultation, and in response to the spatial strategy and draft site allocations in the emerging Local Plan. The ‘preferred cycle routes’ which have been taken forward for prioritisation are shown in Figure 4-5 to Figure 4-8.
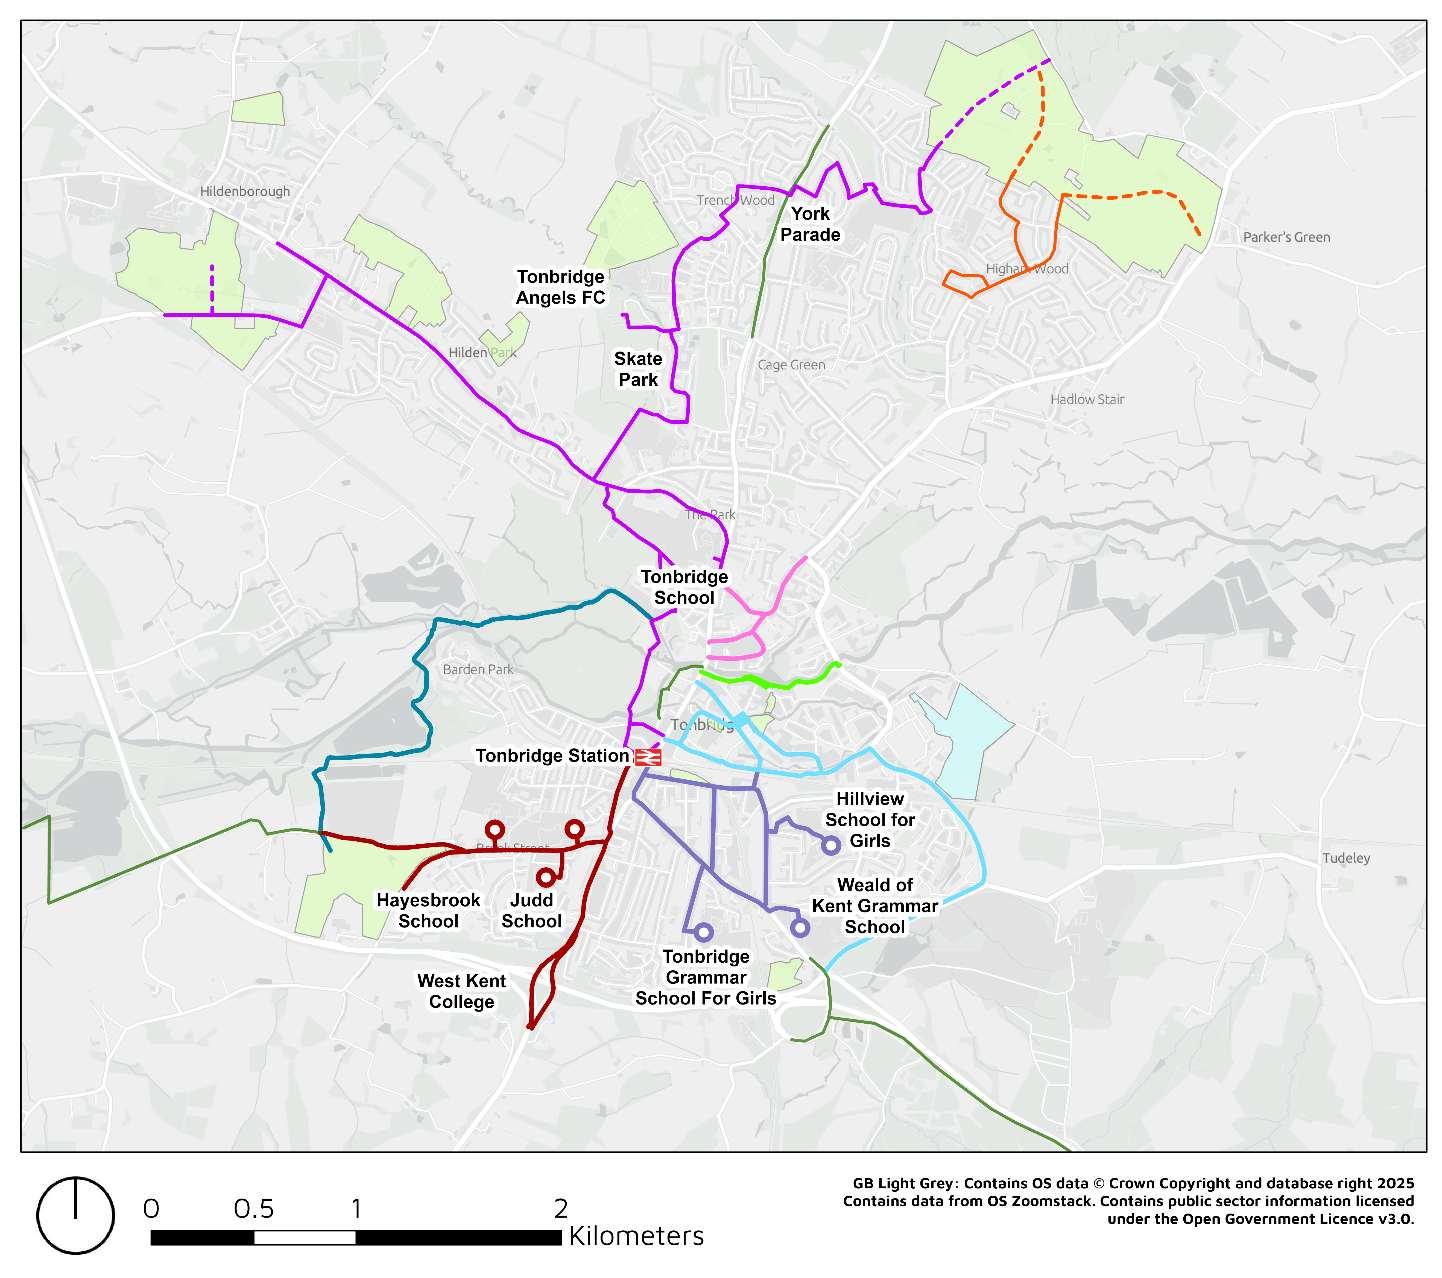
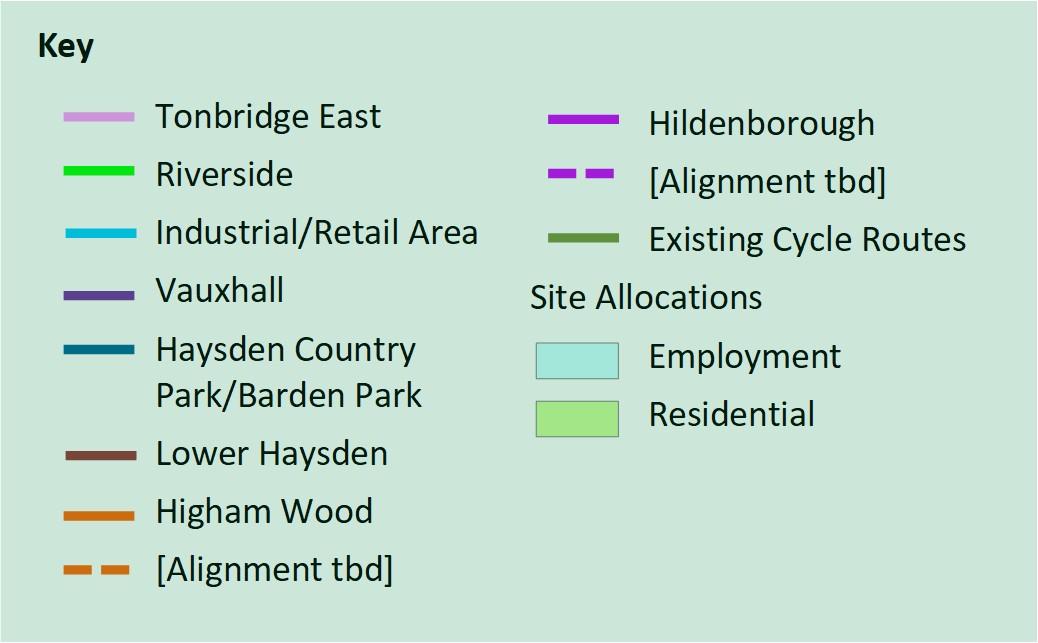
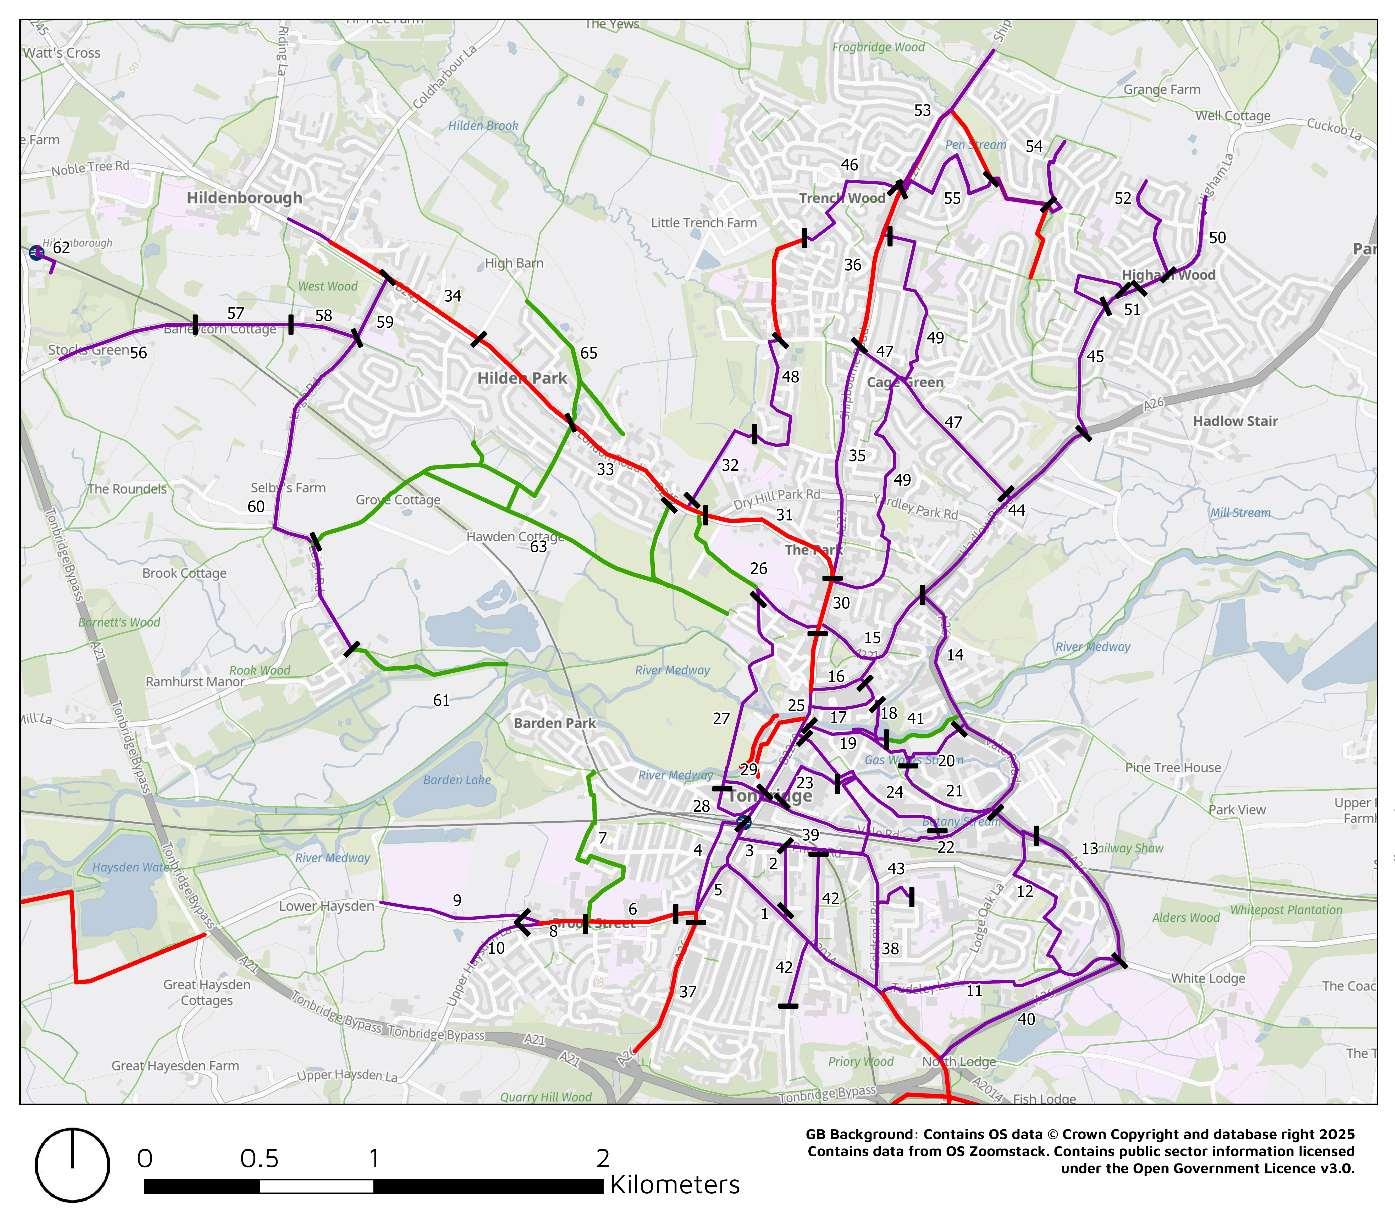
Figure 4-5: Tonbridge – Preferred Cycling Routes
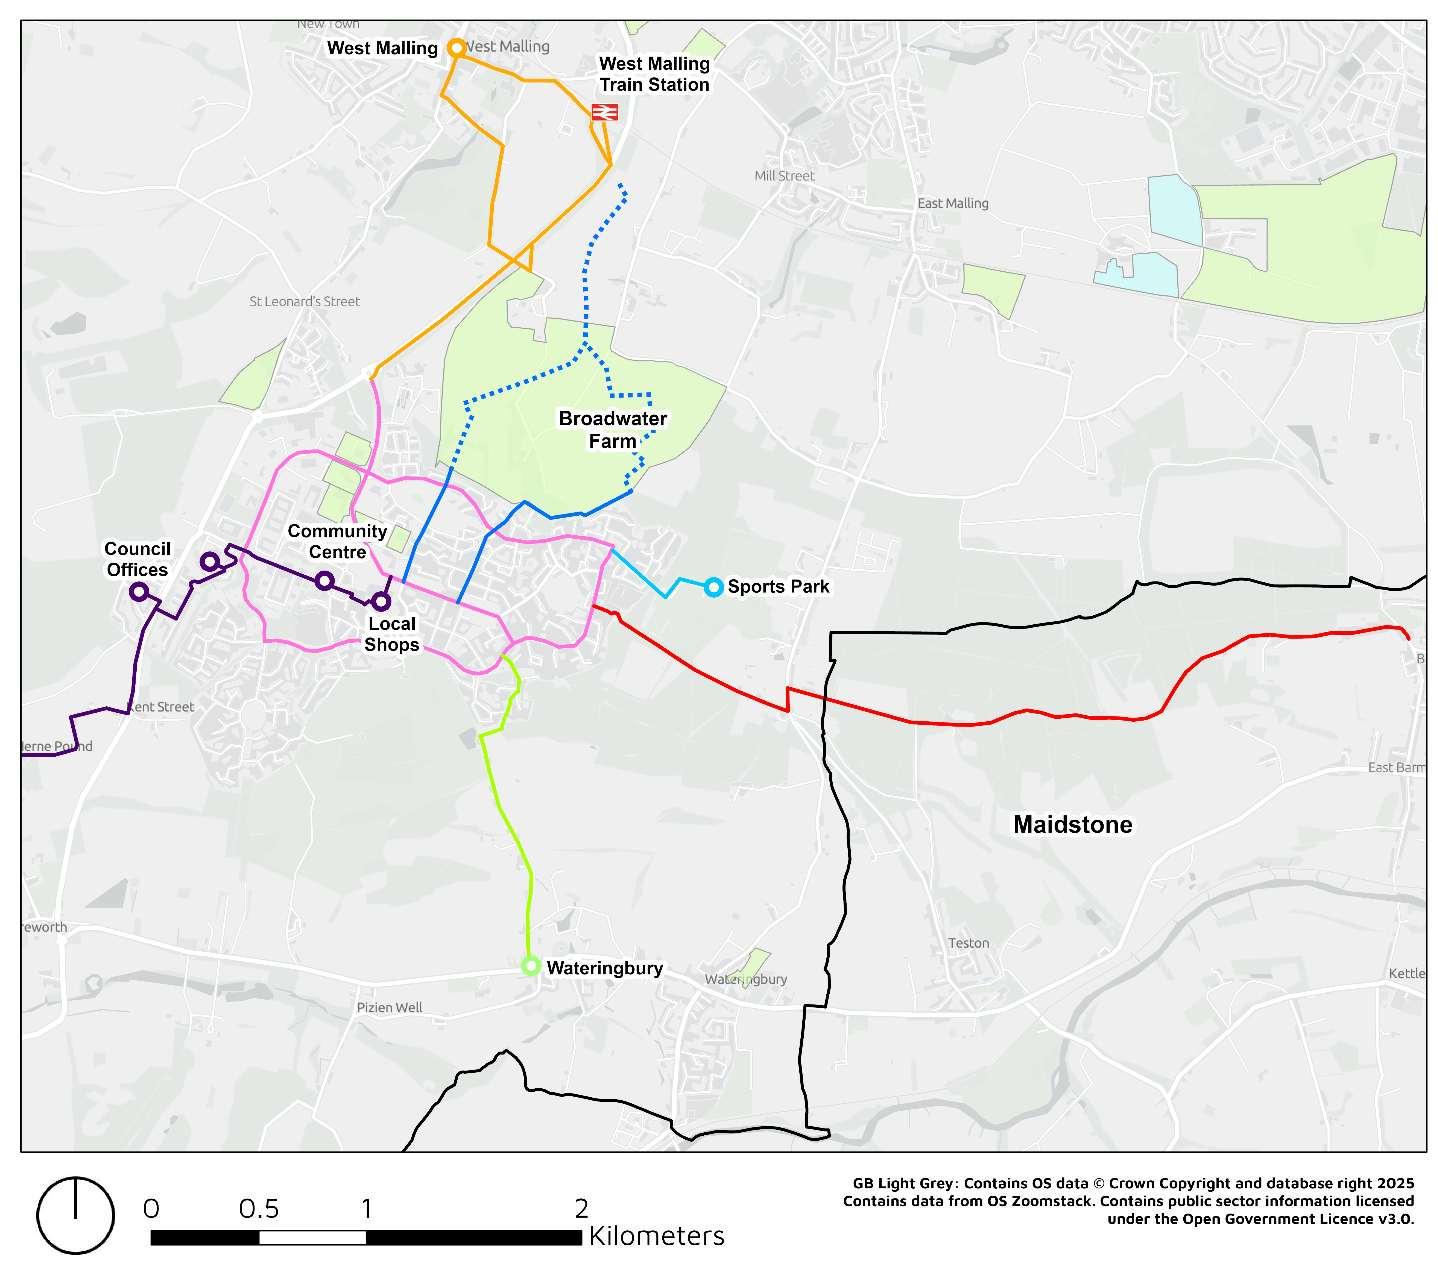

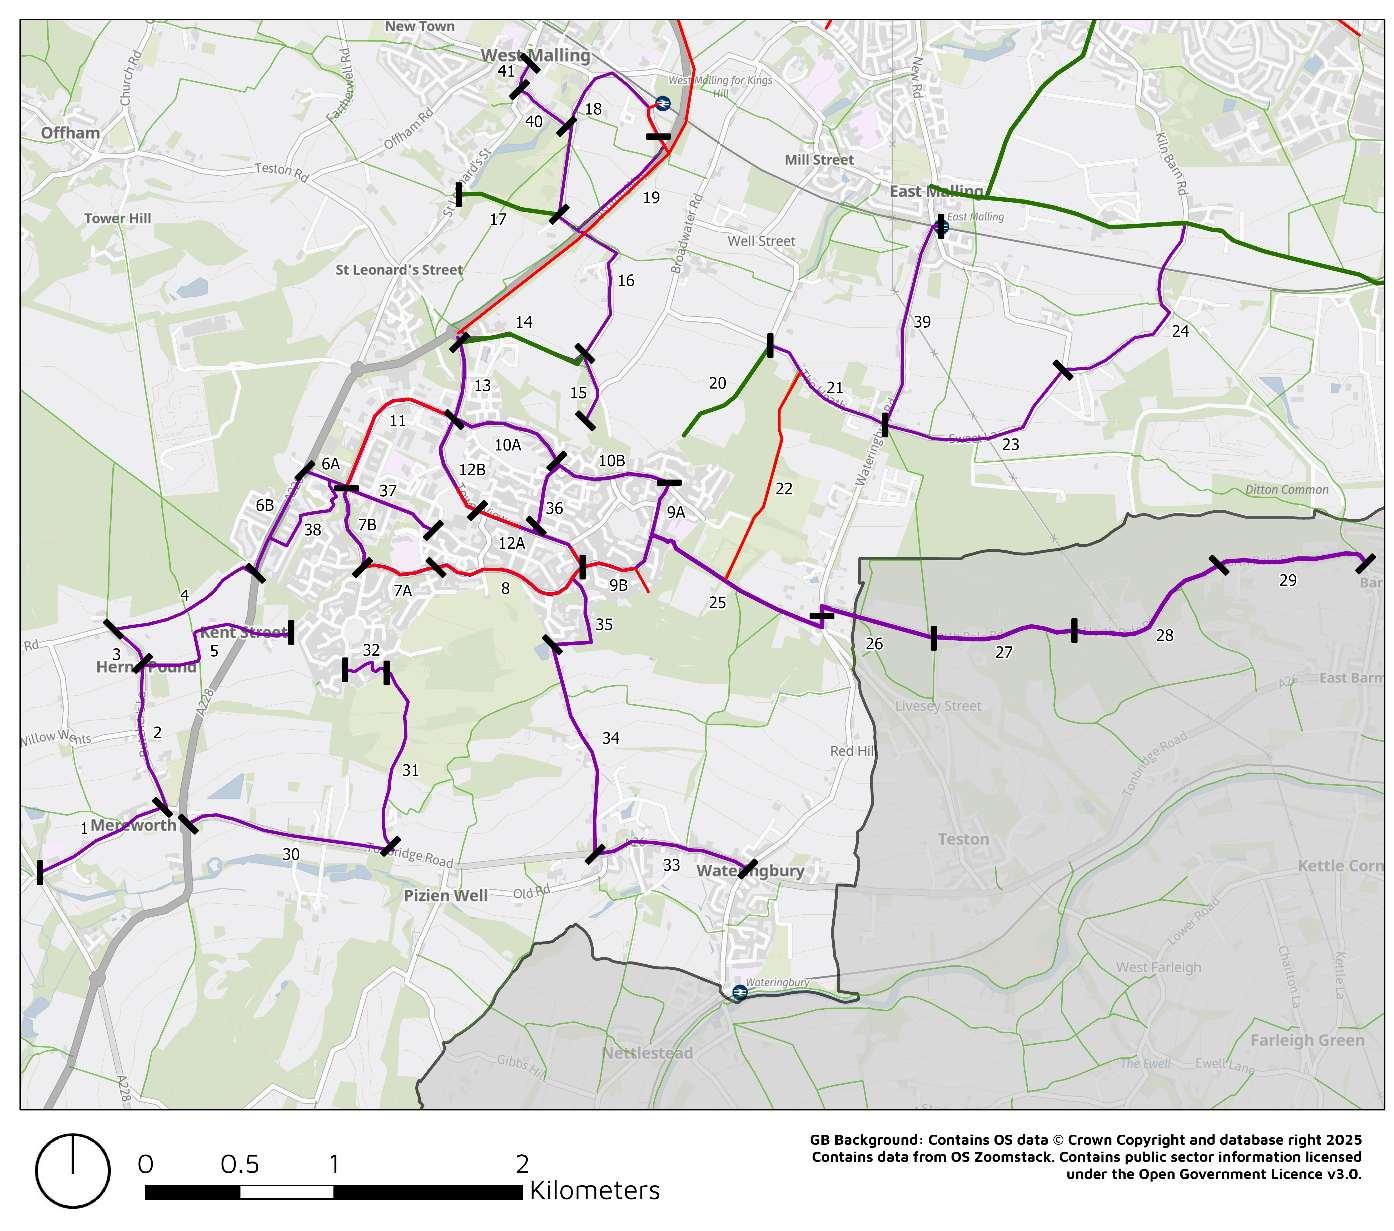
Figure 4-6: Kings Hill & West Malling – Preferred Cycling Routes
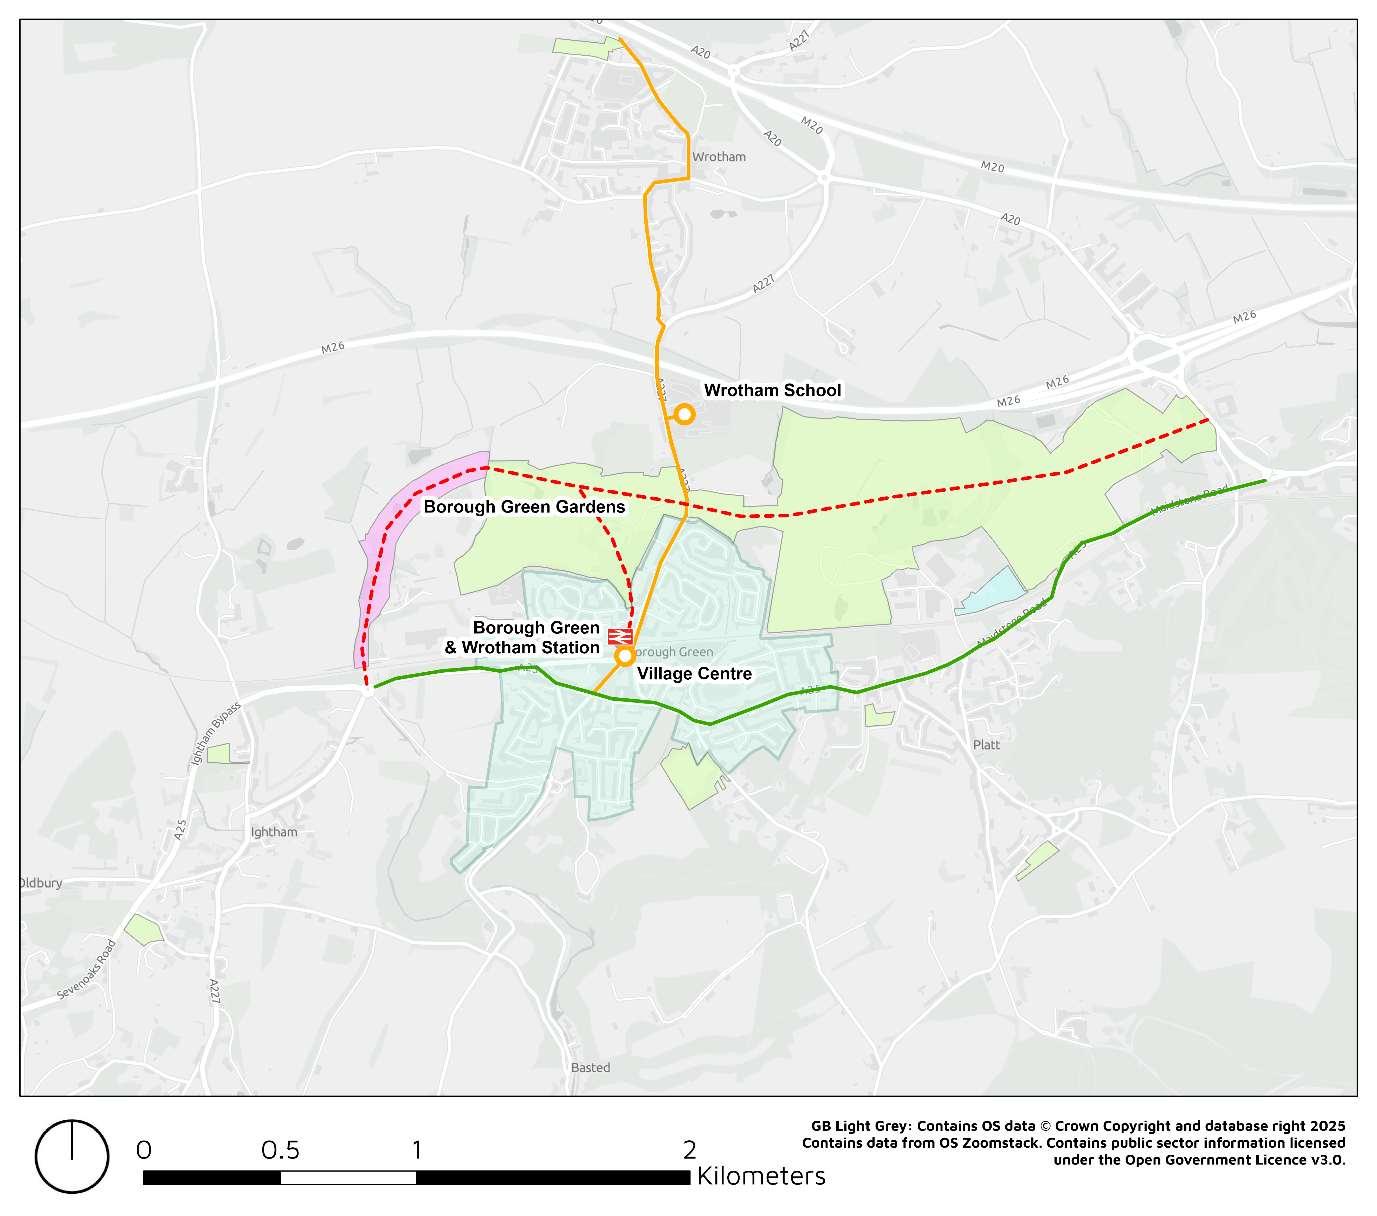
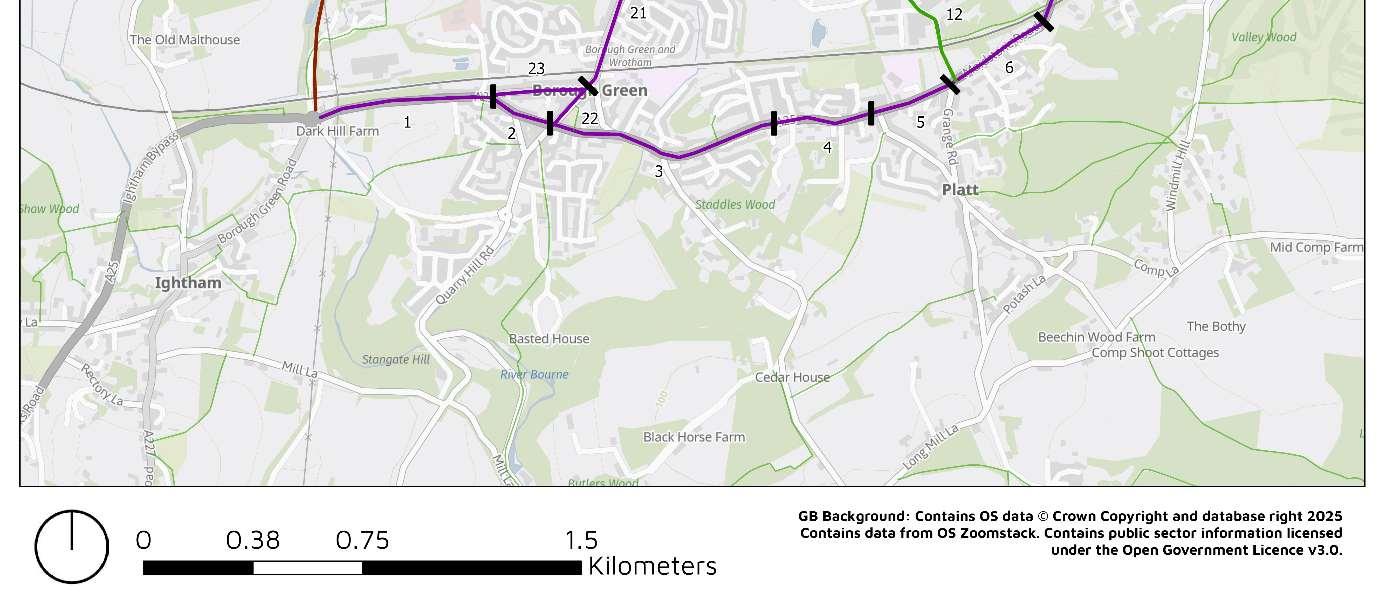
Figure 4-7: Borough Green – Preferred Cycling Routes
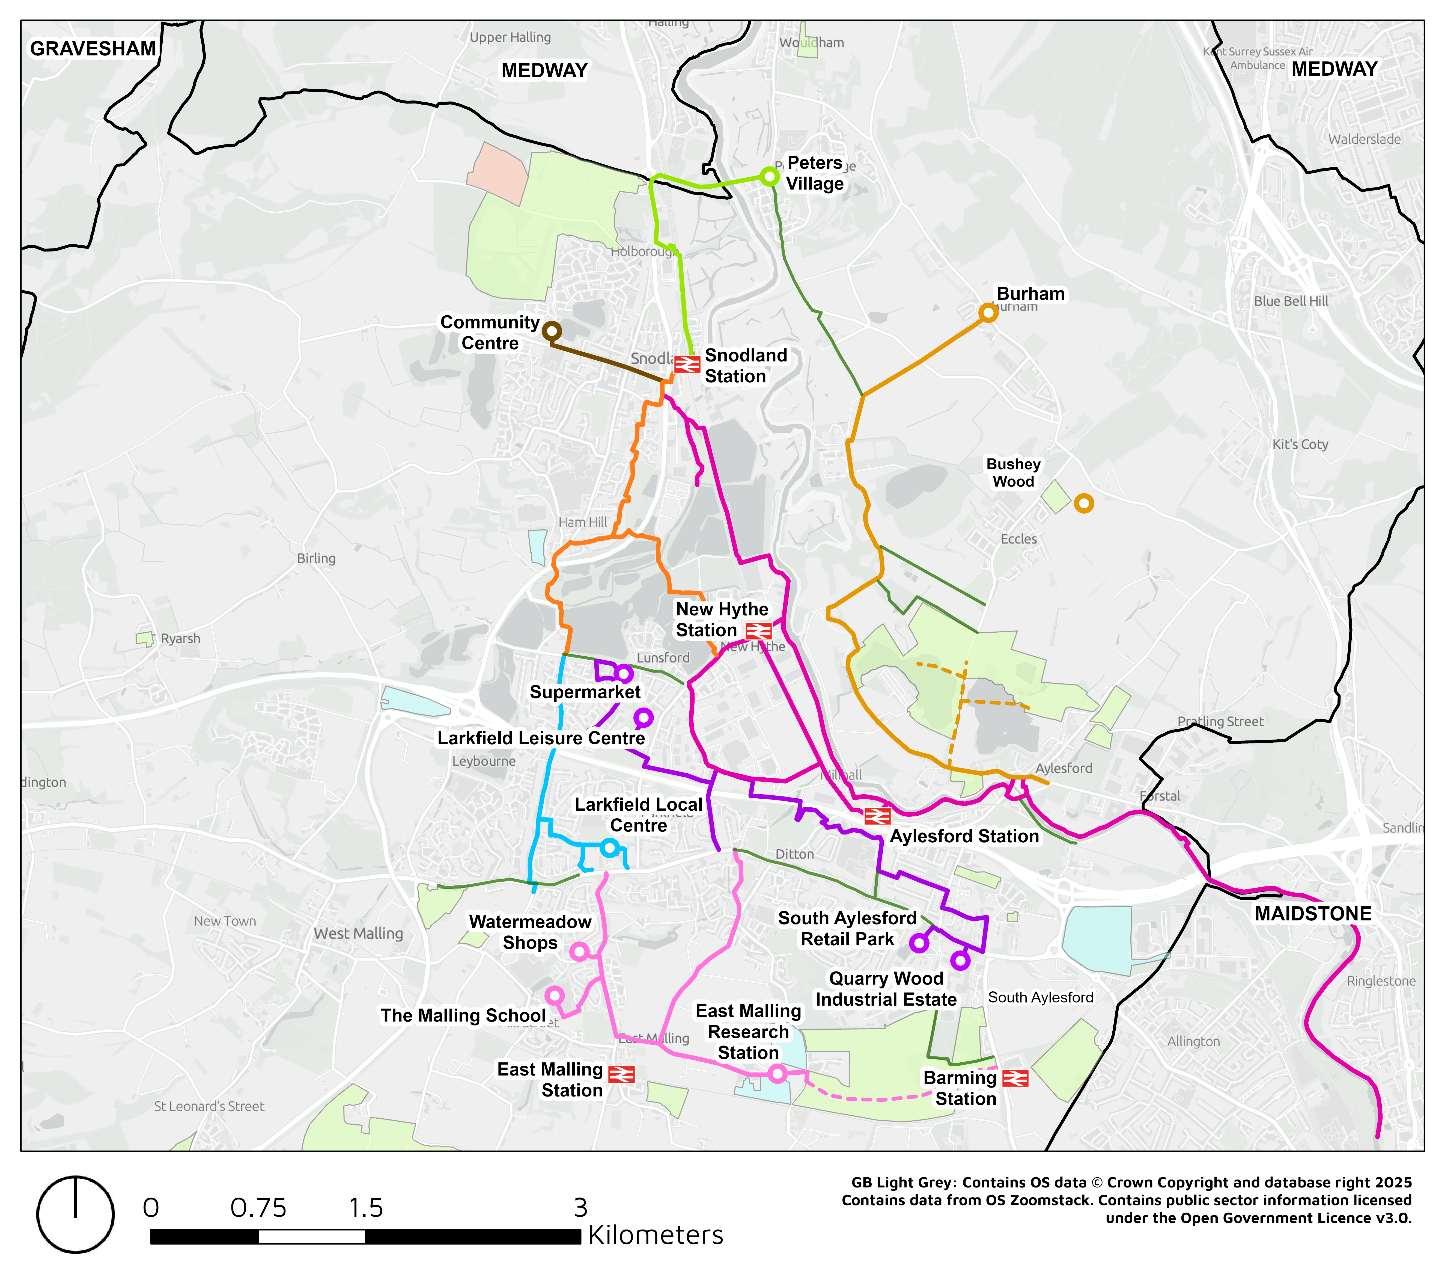
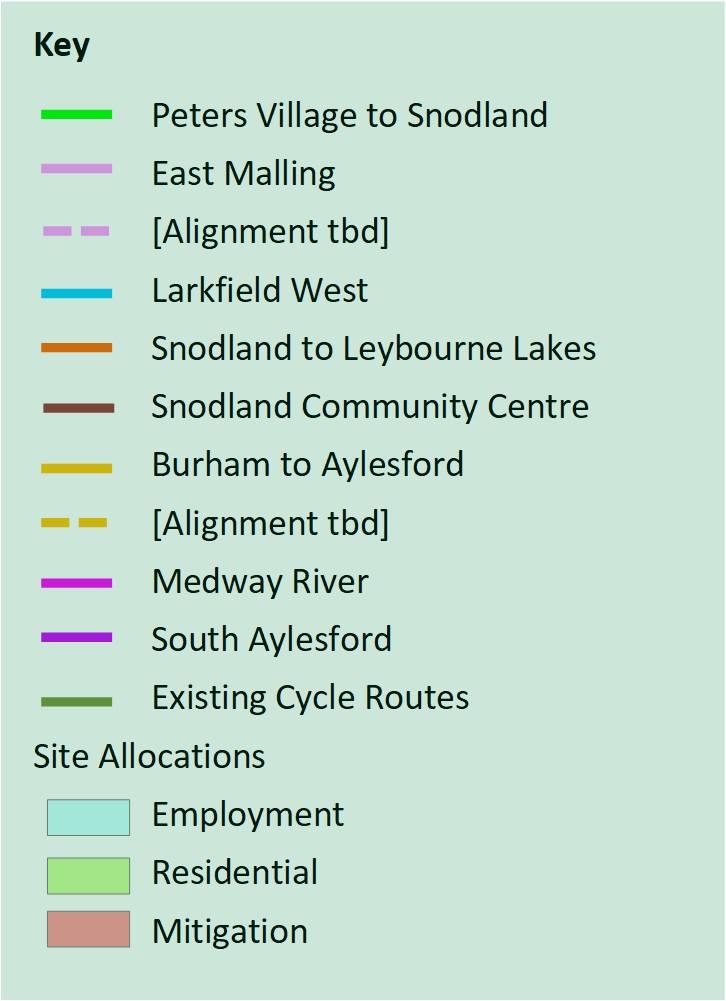
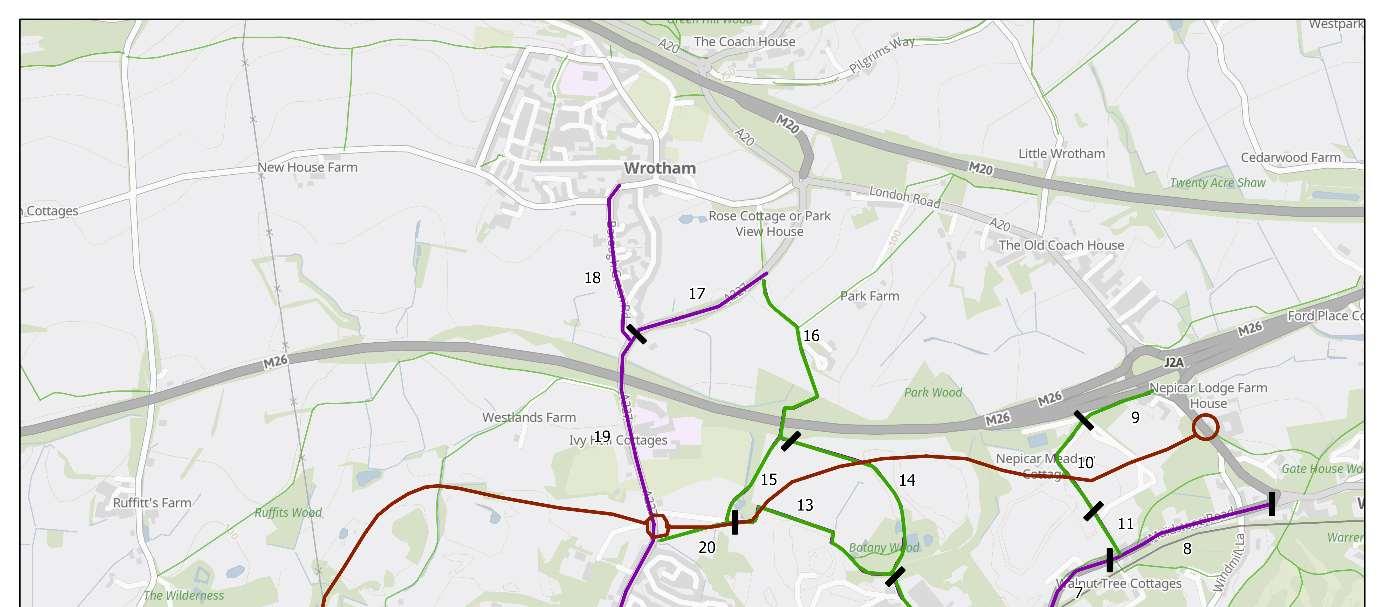
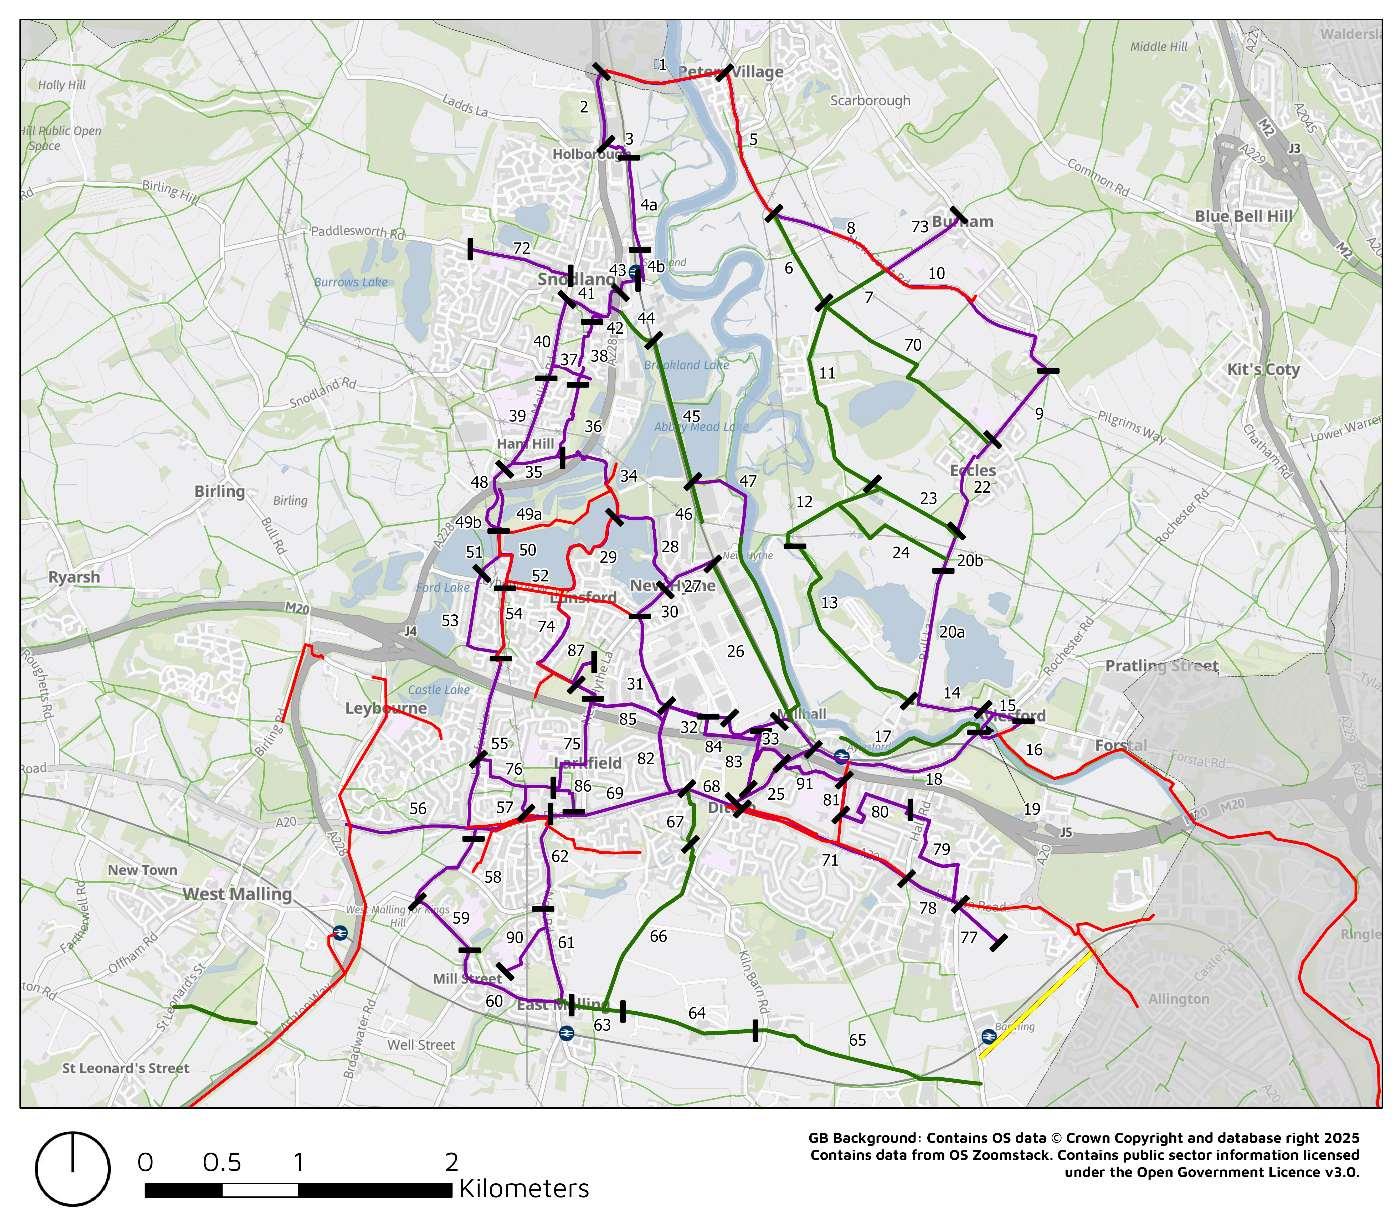
Figure 4-8: Medway Gap – Preferred Cycling Routes
5 Network Planning for Walking
5.1.1
Route Selection
A comprehensive network of footways, urban paths and public rights of way already exist in the borough, and most able-bodied pedestrians will choose the most direct route, particularly since walking is the slowest mode and longer routes have a greater time penalty, and most walking routes are generally safe, being separate to the carriageway. This means that the walking network in urban areas forms a denser network of potential walking routes.
In response, walking zones have been audited rather than routes, covering the main urban centres. The pedestrian facilities in these zones have been audited using the DfT’s Walking Route Audit Tool (WRAT). An example of a completed WRAT form is included at Appendix C. The walking audits covered the following areas as shown in Figures 5-1 to 5-6.
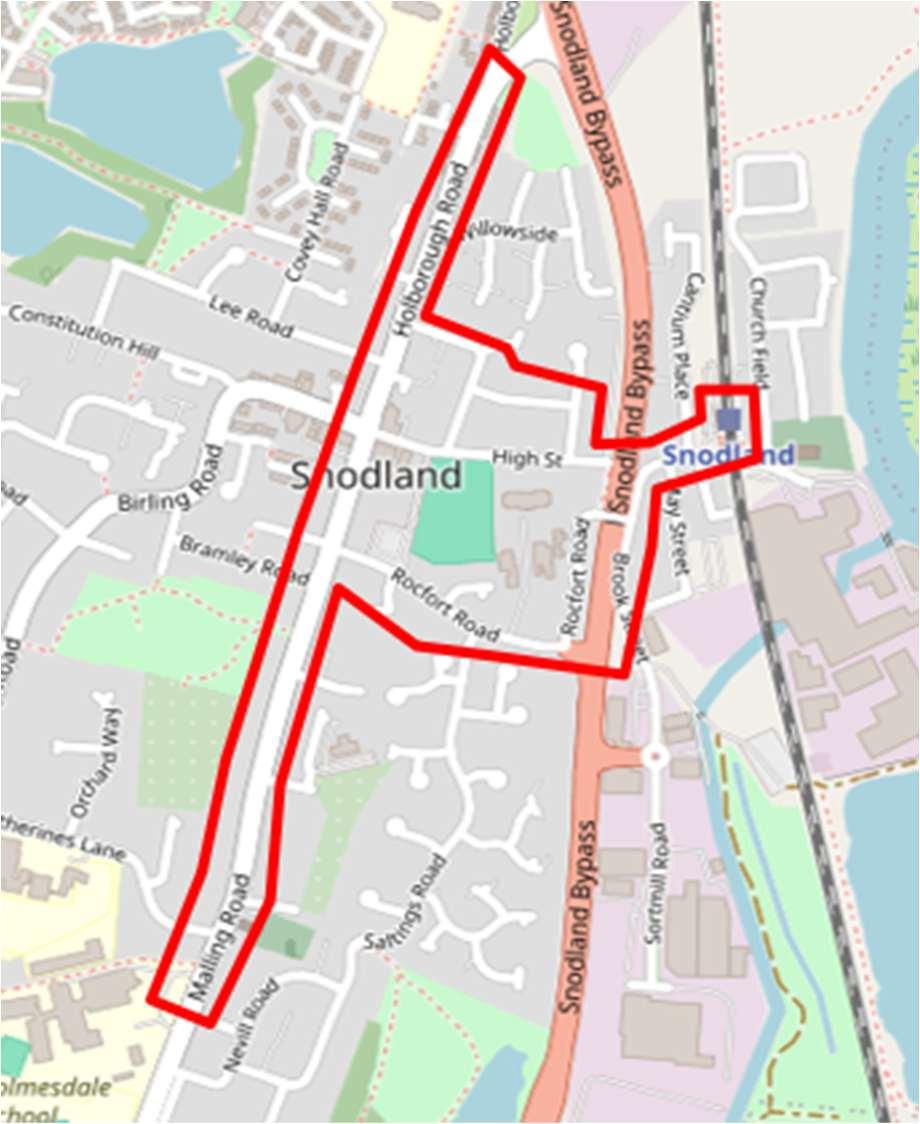
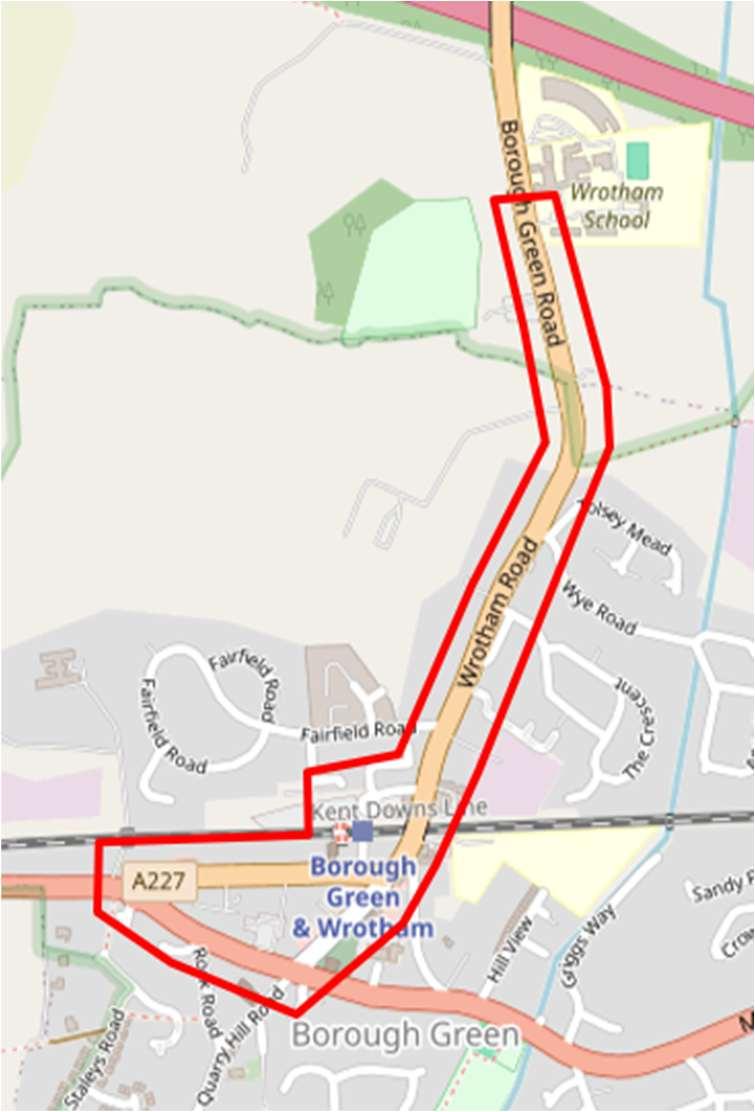
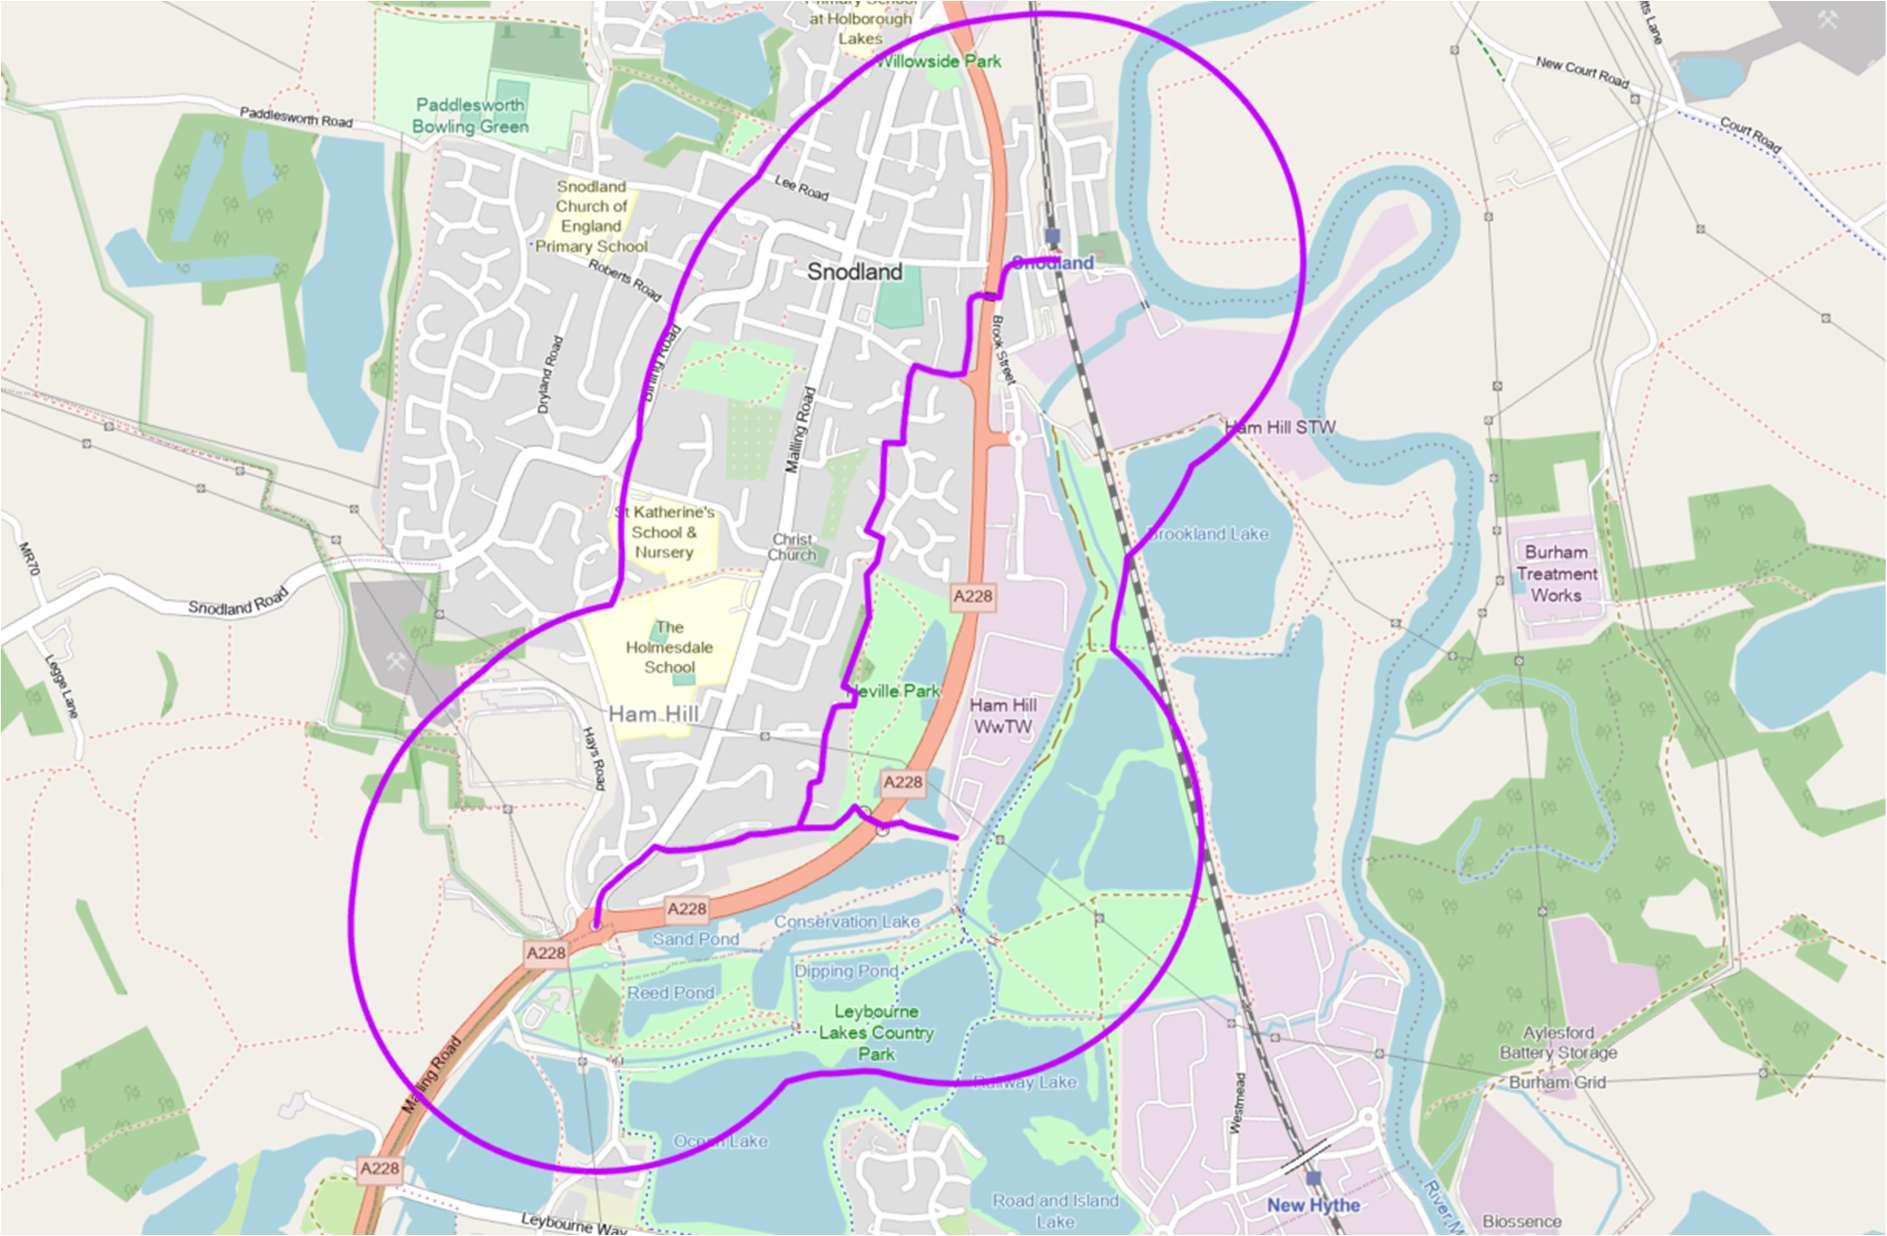
Figure 5-1: Snodland –Extent of Walking Audit (courtesy of OpenStreetMap)
Figure 5-2: Borough Green –Extent of Walking Audit (courtesy of OpenStreetMap)
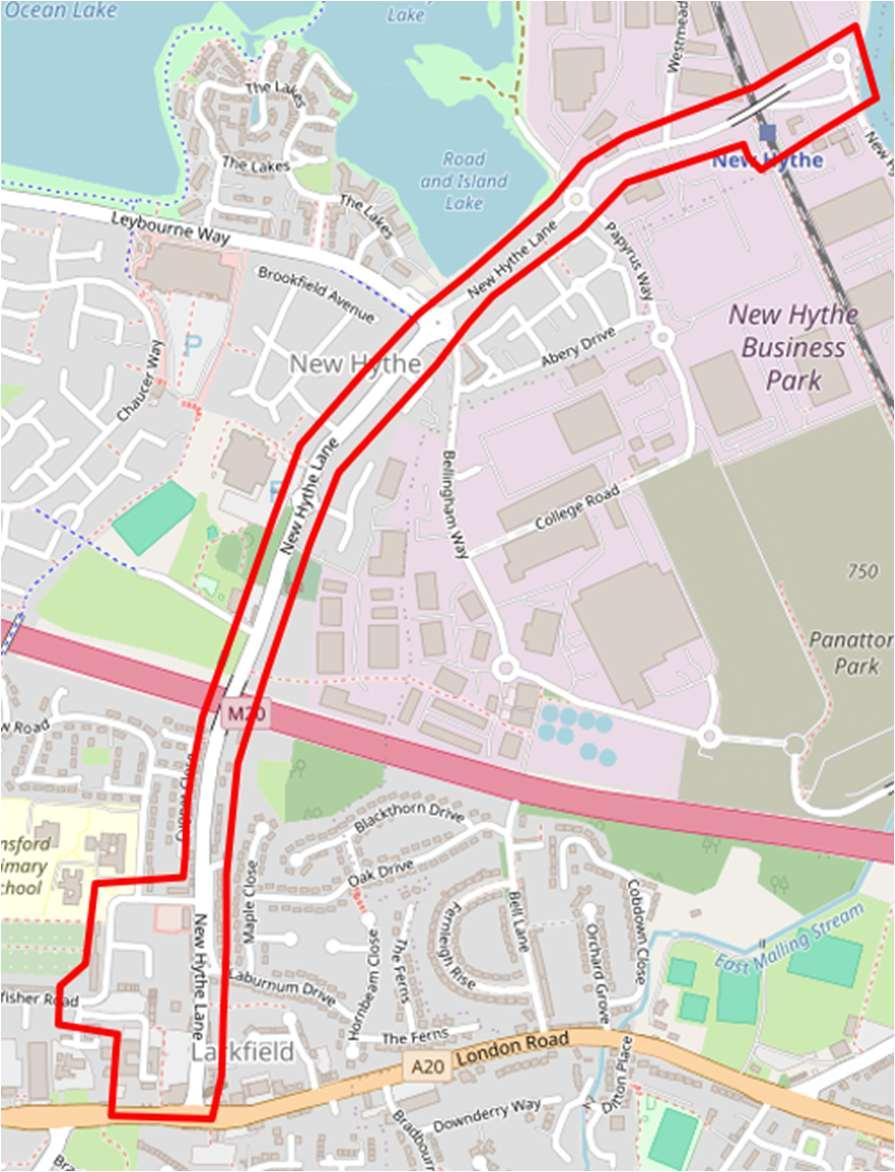
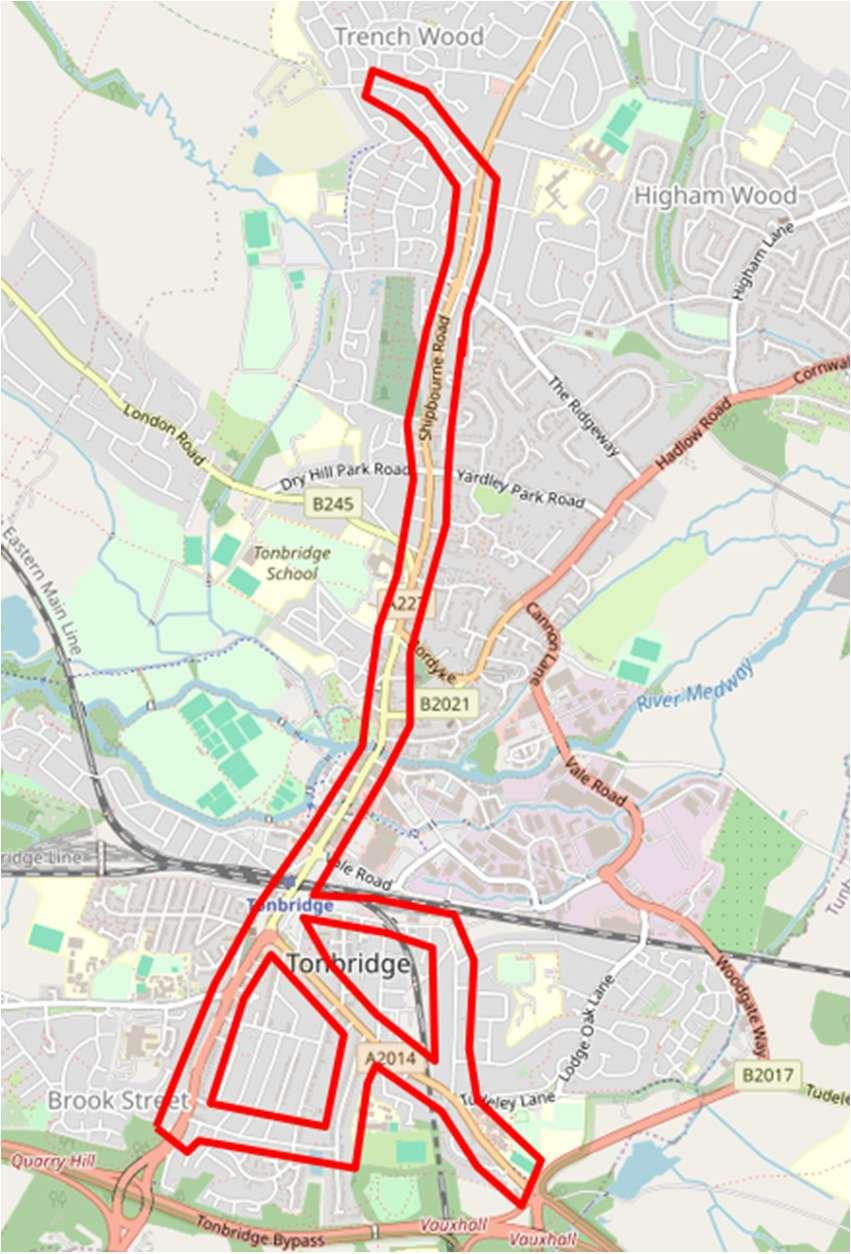
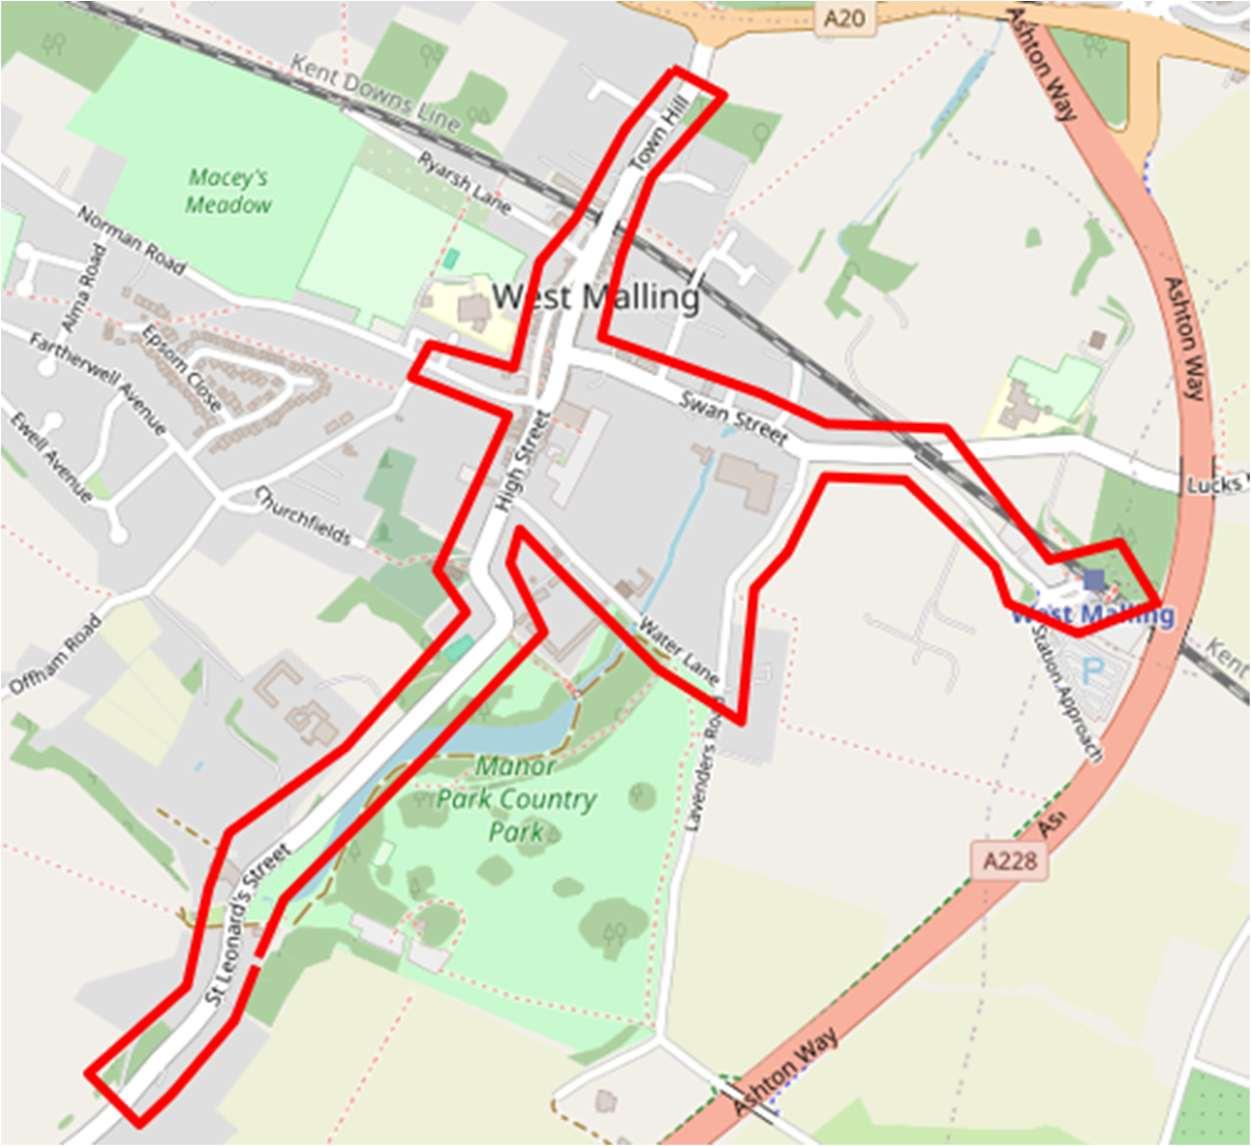
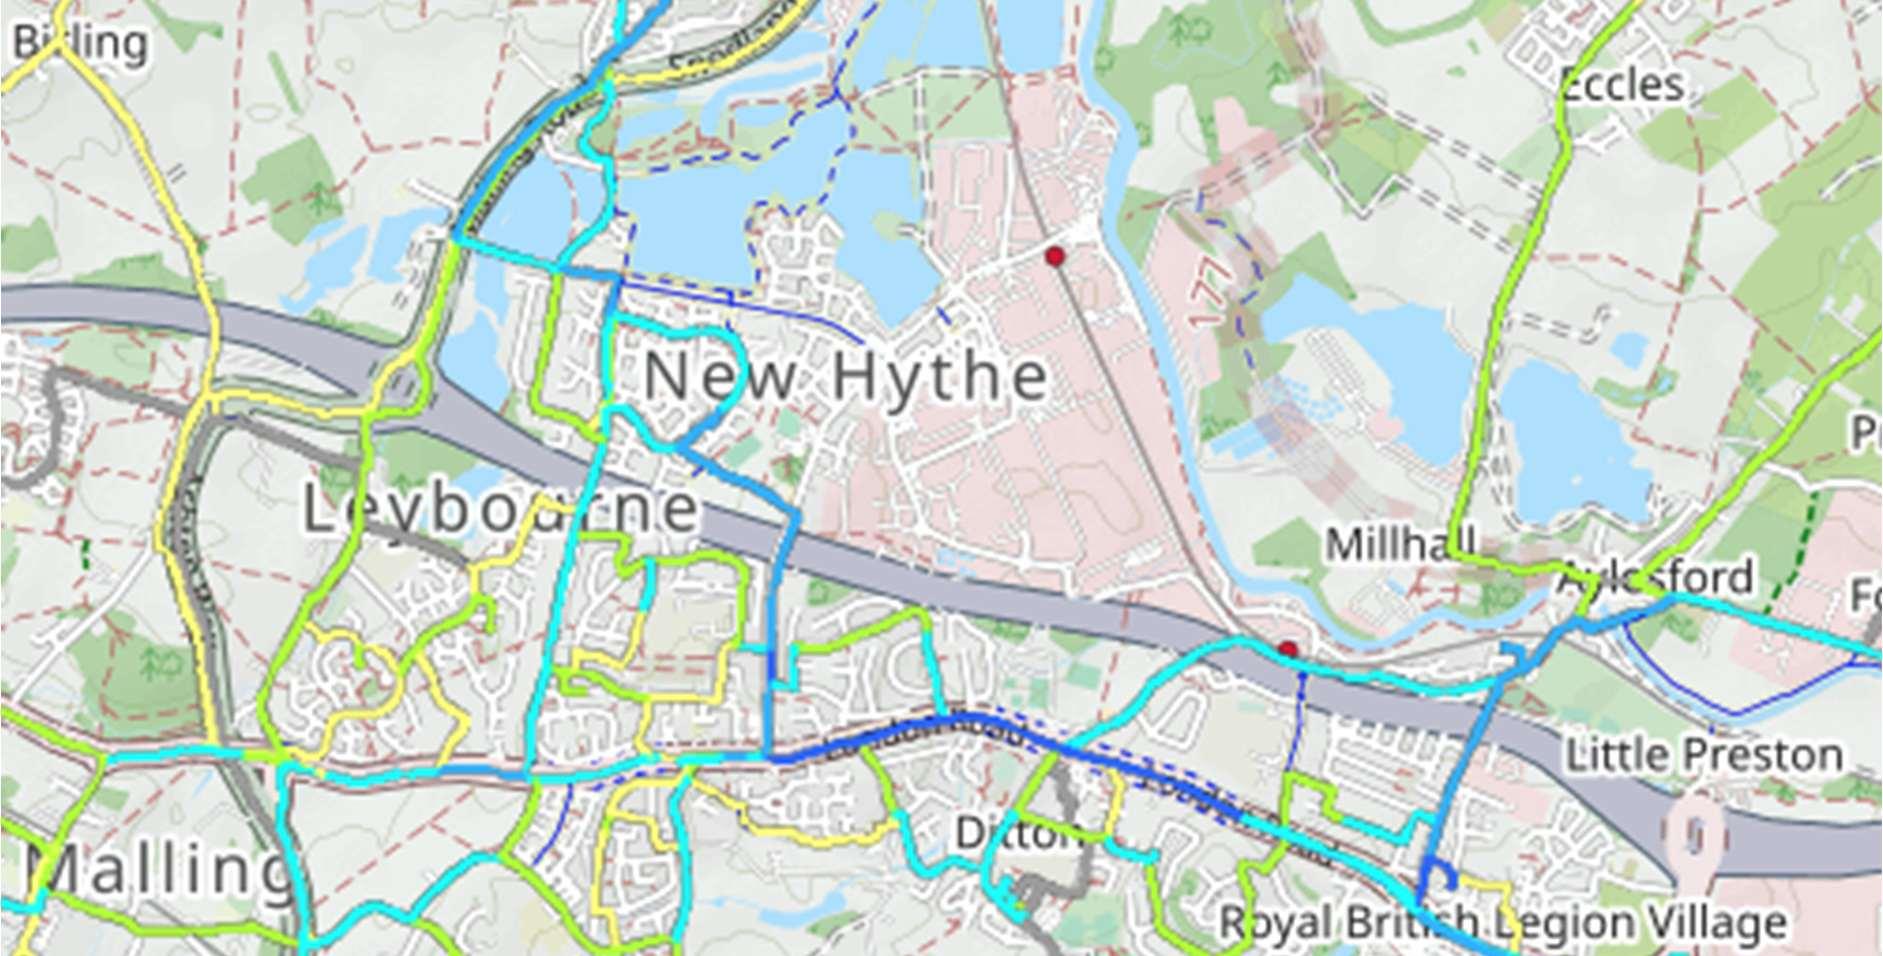
Figure 5-3: Martin Square and New Hythe Lane Corridor – Extent of Walking Audit (courtesy of OpenStreetMap)
Figure 5-4: Tonbridge (centre) –Extent of Walking Audit (courtesy of OpenStreetMap)
Figure 5-5: West Malling (centre) – Extent of Walking Audit (courtesy of OpenStreetMap)
5.1.2
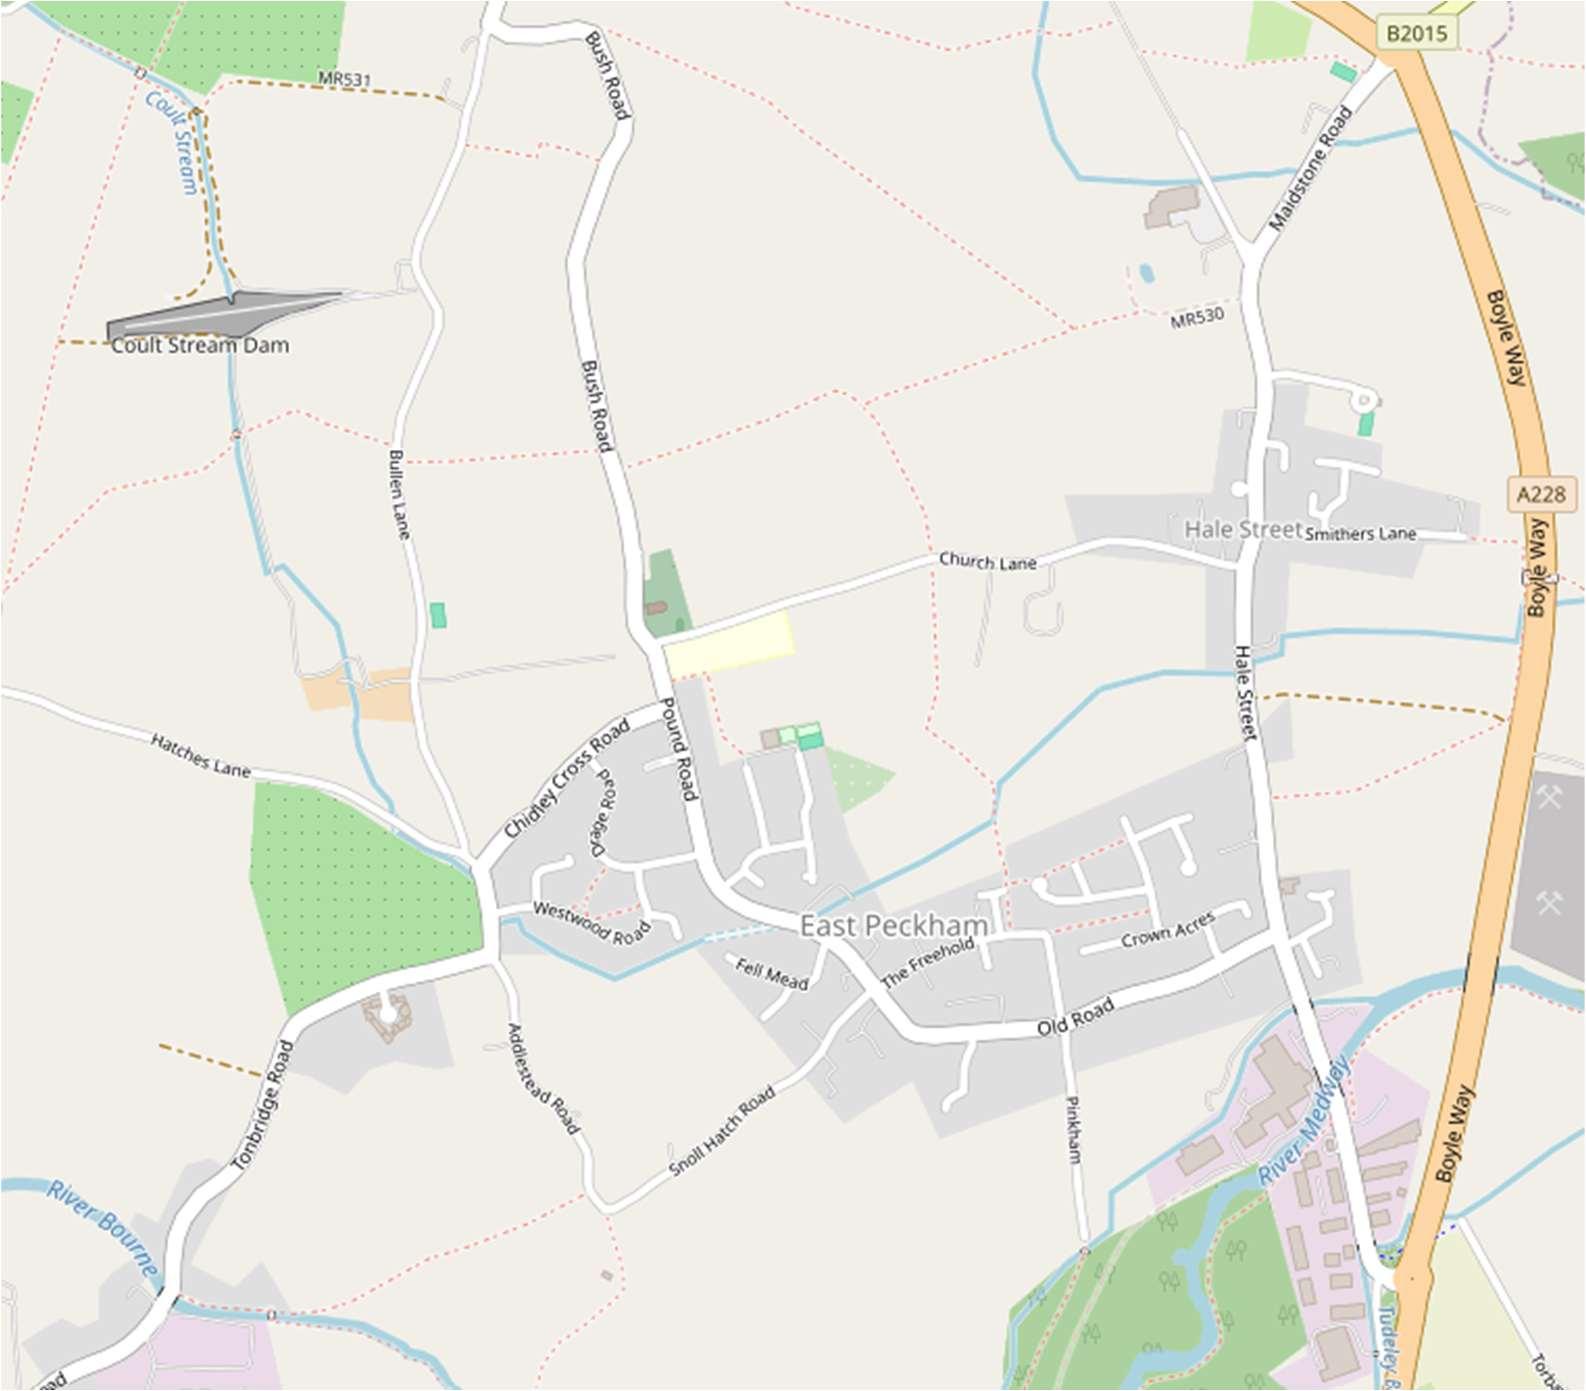
Figure 5-6: East Peckham – Extent of Walking Audit (courtesy of OpenStreetMap)
The WRAT advice is that a score of 70% should normally be regarded as a minimum level of provision, and this percentage rating takes into account those categories that may not be applicable e.g. there are no controlled crossings present on the route. All routes in Borough Green, West Malling, Tonbridge and Snodland scored 70% or greater. Table 5 1 shows those routes that scored less than 70%.
Church Lane 69%
PRoW MR534 & MR535 65%
Hale Street 56%
New Hythe Lane (leisure centre to Laburnum Way) 69%
New Hythe Lane (M20 bridge to leisure centre) 69%
New Hythe Lane (Papyrus Way to New Hythe station) 61%
New Hythe Lane (Laburnum Way to Papyrus Way) 61%
New Hythe Lane (Kingfisher Road to A20 London Road) 50%
Table 5-1: Walking Routes Scoring Less Than 70%
Summary of Findings
West Malling – the Train Station Approach, Swan Street and the High Street are all rated the best at 94% and St Leonards Street the worst at 79%. The key deficiency on St Leonards Street is the lack of a pedestrian crossing near the country park entrance. Some of the other key deficiencies observed were narrow footways with street furniture, forcing pedestrians to give way or step out into the carriageway on West Street, a lack of tactile paving at some crossing points, footways ending with no dropped crossing to reach the opposite footway, narrow
EastPeckham
Larkfield
5.1.3
footways less than 1.5m, limited crossing points on some sections of carriageway and no crossing point to St. Mary’s Abbey or at the Lavenders Road/Swan Street junction.
Snodland – Queen’s Avenue is rated the best with 100% and Rocfort Road the worse with 92%. The key deficiency on Rocfort road is the lack of a dropped crossing at the junction with Brook Street. Other issues observed in Snodland were narrow footways at 0.7m wide and steep gradients on the footpath link to Rocfort Road.
Tonbridge – Priory Street and Goldsmid Road rated the best with 97% and Baltic Road the worse with 72%. The key deficiencies on Baltic Road were a lack of dropped kerbs and tactile paving on side road crossings, restricted visibility at crossing points due to parked vehicles and steep gradients making access difficult for wheelchair users. Other issues observed in Tonbridge were overgrown vegetation and street furniture reducing the usable footway width, poor surfaces, a lack of pedestrian crossings at key locations, sloping footways and pedestrians in close proximity to traffic with high speeds and volume.
Martin Square and New Hythe Lane - the area around the shopping square rated the best at 94% and New Hythe Lane between the A20 London Road and Kingfisher Way rated the worse at 50%. The key deficiency on New Hythe Lane, north of the junction with the A20 London Road is a narrow footway on the western side that ends near no.49, with no corresponding crossing point. Pedestrians are also in close proximity to busy and queuing traffic during the peak periods. Other issues observed along the New Hythe Lane corridor were narrow footways less than 1m wide with a steep crossfall into the carriageway, a section of footway to south-west of the junction with Papyrus Way that is set back within secluded woodland with evidence of fly tipping. The general condition of the footways and access to the station, with a lack of step-free access between station platforms resulting in a long detour.
Borough Green - the High Street is rated the best with 97% and the A25 between Western Road and the High Street rated worst at 80%. Issues observed were sections of narrow footway along the A227 where higher traffic levels can also cause delays to pedestrians at informal crossing points, pinch points on the western footway on the High Street, and high levels of traffic and HGVs on the A25 with narrow footways making this an unpleasant environment for walking.
East Peckham – Old Road and Pound Road scored the highest at 79% and 75% respectively due to the wide footways, natural surveillance and separation from moving vehicles through the presence of verges, generally wider footways and on-street parking. Hale Street scored the lowest at 56% due to sections of narrow footway and pinch points and locations where the footway was discontinued with no corresponding crossing point. Hale Street also sees a level of larger vehicles accessing the industrial areas to the south. There is a useful footpath network within the centre of the village which offers direct walking routes though these footpaths tend to run to the rear of properties and users can feel isolated.
Recommendations
The scoring from the Walking Audits is a useful method of ranking the quality of the walking environment in urban areas. It is clear that the improvements recommended such as the installation of tactile paving and review of street furniture are fairly low-cost interventions compared to the introduction of cycling and wheeling schemes. Therefore, it is not proposed to prioritise the walking routes audited in this ATS, rather the findings will be used to inform decision-making on public realm expenditure, street maintenance and any related funding secured from developers and public sources, in partnership with Kent County Council.
6 Route Prioritisation
The LCWIP guidance refers to prioritising improvements considering effectiveness, cost and deliverability and that infrastructure improvements are prioritised into short term (<3 years), medium term (3-5 years) and long term (> 5 years). Priority should normally be given to improvements that are most likely to have the greatest impact on increasing the number of people who choose to walk and cycle and therefore provide the greatest return on investment.
The ATS has an important role in supporting the implementation of the Local Plan. Potential infrastructure improvements were identified in preparing the cycle route assessments. The assessments provide a high-level feasibility of each route; therefore, the prioritisation method does not take account of any more detailed feasibility work where this is available.
6.1.1
Appraisal Criteria
The appraisal framework is shown in Table 6-1 below, listing the various criteria, the metric applied to each, and the data source used.
CommunityBenefit Population
RoadSafety
Integration
AccesstoDevelopmentSites
AccesstoEducation
AccesstoHealthServices
AccesstoEmployment
AccesstoPublicTransport Interchange
AccesstoRetail
AccesstoLeisureandRecreation
PhysicalActivityLevels
DeprivationIndex
CarsorVansOwnedorAvailablein Household
LikelihoodthatEnvironmental ConstraintscanbeOvercome
Number of casualties along route. Crashmap
Supports delivery of scheme objective. KCC/TMBC Infrastructure Needs Forecast
Proximity of development sites. TMBC
Proximity of schools and colleges. GIS mapping
Proximity of hospitals, health centres and GP surgeries. GIS mapping
Proximity of employment sites and large employers. GIS mapping
Proximity of train stations and bus interchange. GIS mapping
Proximity of urban centres, retail parks and local shops. GIS mapping
Proximity of leisure centres, sports grounds, parks and playgrounds. GIS mapping
Level of physical inactivity of population within 500m of the route.
Deprivation index of population within 500m of the route.
Car or van availability of population within 500m of the route.
SSSI, conservation area, nature reserve, wildlife site etc.
Sport England Estimates 2023-24
Indices of Deprivation 2019
Census 2021 Data
GIS mapping
6.1.2
Scoring Method
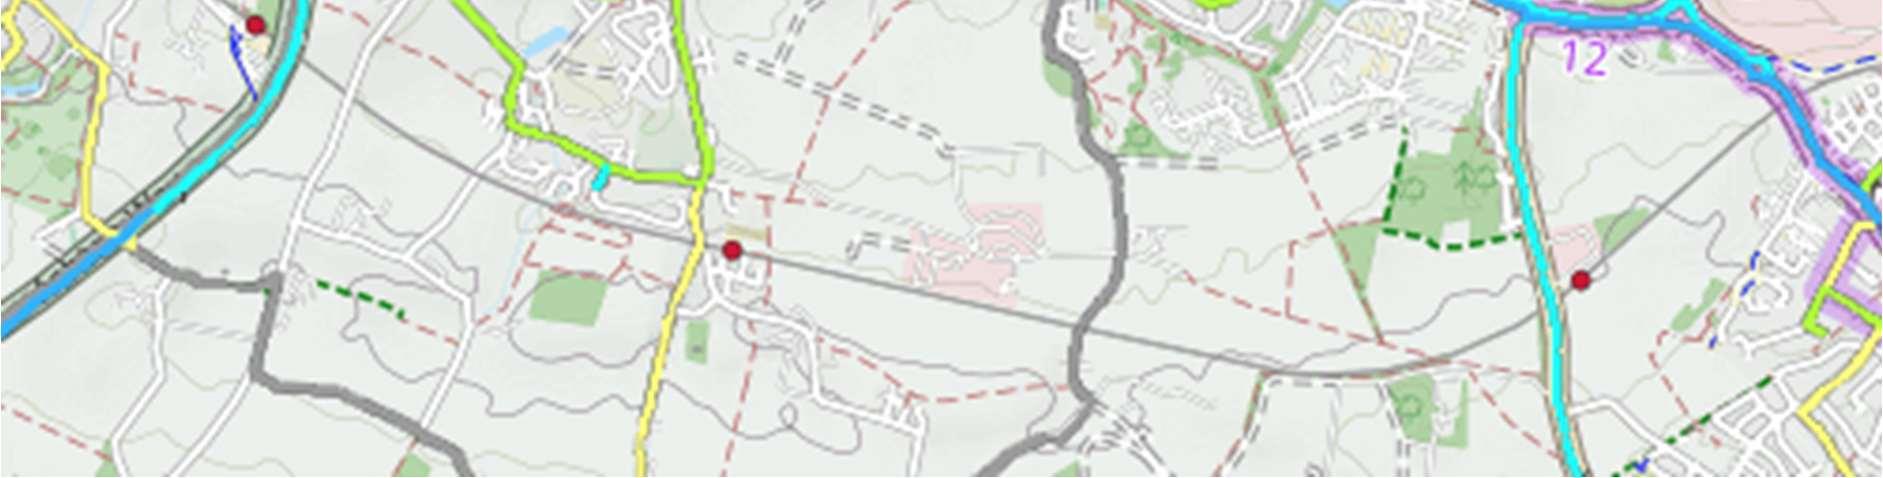
The method of scoring has considered both the route alignment and the local area surrounding the route by applying a 500m buffer from the route to create a local corridor. An example of the local corridor within 500m of a route is shown in Figure 6-1 below.
For those metrics that are population-based, such as activity levels, car ownership, deprivation etc., a spatial average for the local corridor can be calculated and the corridor areas ranked accordingly. The scoring has then been applied as follows:
Rank 1-7 = points

Rank 8-14 = points

Rank 15-21 = point

Rank 22-26 = points

For those metrics that relate to the proximity of local services, a simple scoring matrix has been used, that considers both the route alignment, the route corridor and the level of services within the corridor. Metrics such as the number of casualties along the route and environmental constraints are only relevant to the route alignment and therefore do not consider the impacts on the local corridor. These scoring matrices are shown in Table 6-2 overleaf. A score of 0 points was awarded where there was no impact within the route corridor.
Figure 6-1: Example of Route Corridor
IntegrationWithOtherSchemes
IDP Critical
IDP Essential
RoadSafety
Pedal Cyclist Casualties
Crash Cluster
Casualty
AccesstoEducation
Academy/College
Junior/Primary School
AccesstoHealthServices
Hospital
Health Centre/GP Surgery
AccesstoEmployment
Employment Site
Large Employer
AccesstoPublicTransportInterchange
Train Station
Bus Hub
AccesstoRetail
Urban Centre & Retail Park
Local Shops
AccesstoLeisure&Recreation
Leisure Centre /Sporting Centre
Local Park/Open Space
EnvironmentalConstraints
None
Local Wildlife Site/SINC/Green Corridor/Conservation Area
NNR/LNR/SRA/NNR/SSSI/Ramsar Site
N/A
N/A
N/A
6.1.3
Results of the Scoring
The results of the appraisal and scoring of the routes in each of the four audit areas by ranked priority order, are shown in Table 6-3 below. It is acknowledged that routes and cycle infrastructure schemes will be delivered as opportunities and funding allows, the ranking will assist the Council in prioritising these where possible.
Table 6-2: Cycling Network Scoring Matrices
Routes ranked 1 will be prioritised in the short term (<3 years) following adoption of the strategy. Routes ranked 2 will be prioritised in the medium term (3-5 years), and routes ranked 3-7 will be prioritised in the longer term (> 5 years), as opportunities, resources and funding allow.
7 Integration and Application
7.1.1 Links to Wider Strategies and Complementary Measures
This ATS is designed to be integrated into local planning and transport policies, strategies, and delivery plans. It is a live document which will be regularly reviewed and updated. As KCC and neighbouring Councils publish or update their LCWIPs and walking, wheeling and cycling improvements are made to the network, the ATS will be updated to take account of these as relevant.
Recommendations
Identified improvement schemes to be included in future Infrastructure Delivery Plans (IDP).
To consult on the ATS and promote its adoption by elected members as supporting evidence to the Development Plan.
Linking the ATS to the Council’s Climate Change Strategy 2020 to 2030.
Linking the ATS to the Corporate Plan objectives.
The ATS is reviewed every five years.
7.1.2 Funding and Implementation
The Council will pursue external funding to support the delivery of infrastructure schemes, the following potential sources of funding will be explored, or alternatives as these become known.
DfT/Active Travel England - Capability Fund
S106 contributions from developers
7.1.3 Next Steps
Following consultation on and subsequent adoption of the ATS, the Council will work with Kent County Council and other partners and stakeholders, to progress the feasibility and delivery of the walking, wheeling and cycling routes identified.
Appendix A: Route Assessment Maps
Tonbridge Key
Local Cycle Routes
Assessed PRoW
Assessed Links
Key
Local Cycle Routes Assessed PRoW Assessed Links
Infrastructure
Assessed PRoW
Assessed Links
Key
Local Cycle Routes
Potential Future Infrastructure
Assessed PRoW
Assessed Links
Appendix B: Example of Cycling Route Assessment Data Collection
Data Item
Section No. 17
Section Lyons Crescent
Section Start/End Point East Street/High Street
Section Length (km) 0.4 km
Motor Traffic Speed (mph) 20 mph
Motor Traffic Volume (AADT10) <2,500 vehicles
Total Connections11 (no.) 2 no.
Connections per km (no.) 5 no. per km
Surface Type Smooth bituminous or similar
Available Width (m) Road – 6.0m (4.0m where parking) Footway – 1.5m to 1.8m footways both sides
During the on-site audit, the following items were noted:
Section No. 17
Location Lyons Crescent
Existing Provision Road (two-way movements) plus footway
Width of Provision Road - 6.0m (4.0m where parking is noted) footway - 1.5 to 1.8m footways on both sides
Street Lighting Y
Observations
Subject to 20mph speed limit trial and is relatively lightly trafficked. Some on-street parking present within designated bays.
Viability Medium
Form of Cycle Route Signposted route? Permanent 20mph limit?
Works/Improvements A signposted, on-carriageway route is considered suitable.
Appendix C: Example of Walking Route Audit Assessment
Monday4thSeptember2023-15:10commence-weatherhot&sunny28degC
1.ATTRACTIVENESS -maintenance Footwayswellmaintained,withno significantissuesnoted.
2.ATTRACTIVENESS
-fearofcrime Noevidenceofvandalismwith appropriatenaturalsurveillance.
3.ATTRACTIVENESS -trafficnoiseand pollution
4.ATTRACTIVENESS -other
ATTRACTIVENESS
5.COMFORT -condition
6.COMFORT -footwaywidth
7.COMFORT -widthonstaggered crossings/ pedestrian islands/refuges
8.COMFORT -footwayparking
Trafficnoiseandpollutiondonot affecttheattractiveness
9.COMFORT -gradient
10.COMFORT -other
Minorlittering.Overgrownvegetation. Streetfurniturefallingintominor disrepair(forexample,peelingpaint).
Minorvandalism.Lackofactive frontageandnaturalsurveillance(e.g. housessetbackorbackontostreet).
Litteringand/ordogmessprevalent. Seriouslyovergrownvegetation, includinglowbranches.Street furniturefallingintomajordisrepair.
Majororprevalentvandalism. Evidenceofcriminal/antisocial activity.Routeisisolated,notsubject tonaturalsurveillance(including wheresightlinesareinadequate).
Levelsoftrafficnoiseand/orpollution couldbeimproved
Severetrafficpollutionand/orsevere trafficnoise
Examplesof‘other’attractivenessissuesinclude: -Evidencethatlightingisnotpresent,orisdeficient; -Temporaryfeaturesaffectingtheattractivenessofroutes(e.g.refusesacks). -Excessiveuseofguardrailorbollards
Footwayslevelandingoodcondition, withnotriphazards.
Somedefectsnoted,typicallyisolated (suchastrenchingorpatching)or minor(suchascracked,butlevel pavers).Defectsunlikelytoresultin tripsordifficultyforwheelchairs, pramsetc.Somefootwaycrossovers resultinginunevensurface.
Abletoaccommodateallusers without‘giveandtake’betweenusers orwalkingonroads. Footwaywidthsgenerallyinexcessof 2m.
Abletoaccommodateallusers without‘giveandtake’betweenusers orwalkingonroads.Widthsgenerally inexcessof2mtoaccommodate wheel-chairusers.
Noinstancesofvehiclesparkingon footwaysnoted.Clearancewidths generallyinexcessof2mbetween permanentobstructions.
Footwaywidthsofbetween approximately1.5mand2m. Occasionalneedfor‘giveandtake’ betweenusersandwalkingonroads.
Widthsofbetweenapproximately 1.5mand2m.Occasionalneedfor ‘giveandtake’betweenusersand walkingonroads.
Clearancewidthsbetween approximately1.5mand2m. Occasionalneedfor‘giveandtake’ betweenusersandwalkingonroads duetofootwayparking. Footwayparkingcausessome deviationfromdesirelines.
Therearenoslopesonfootway.Slopesexistbutgradientsdonot exceed8percent(1in12).
Largenumberoffootwaycrossovers resultinginunevensurface,subsided orfrettedpavement,orsignificant unevenpatchingortrenching.
Footwaywidthsoflessthan1.5m(i.e. standardwheelchairwidth).Limited footwaywidthrequiresusersto‘give andtake’frequently,walkonroads and/orresultsincrowding/delay.
WesternfootwayonNewHytheLane becomesnarrowastravelsouthwards being0.75manddiscontinuedatno. 49A,withpropertyboundaryadjacent tocarriageway.Pedestriansareable tocrossthecarriagewayvia crossoversatthispoint.
Widthsoflessthan1.5m(i.e. standardwheelchairwidth).Limited widthrequiresusersto‘giveandtake’ frequently,walkonroadsand/or resultsincrowding/delay.
Clearancewidthslessthan1.5m. Footwayparkingrequiresusersto ‘giveandtake’frequently,walkon roadsand/orresultsin crowding/delay.Footwayparking causessignificantdeviationfrom desirelines.
Gradientsexceed8percent(1in12).
Examplesof‘other’comfortissuesinclude: -Temporaryobstructionsrestrictingclearancewidthforpedestrians(e.g.drivewaygatesopenedintofootway); -Barriers/gatesrestrictingaccess;and -Bussheltersrestrictingclearancewidth. -Poorlydrainedfootwaysresultinginnoticeablepondingissues/slipperysurfaces
2Generallywellmaintained footways
1Frontagesonwesternsidebut sectionofeasternfootwayis adjacenttostonewalland overhangingvegetation makingusersfeelvulnerable
0Queuingtraffictowardsthe A20junctionwithpedestrians incloseproximity
1Therewerenoothernegative orpositivefactorsaffectingthe attractiveness
4
1Lackofdroppedkerbatfire stationaccess
0Footwaywidthoneasternside =1.5m
0N/A
2Nofootwayparkingwas observed;mostproperties haverearaccessforoff-street parking
1Cross-gradientsonfootways butnotexcessive
1Noissueswereobservedthat impactuponthecomfortofthe route
1 Local Cycling and Walking Infrastructure Plans – Technical Guidance for Local Authorities (2017), Department for Transport
2 https://assets.publishing.service.gov.uk/media/5f1f59458fa8f53d39c0def9/gear-change-a-bold-vision-for-cycling-and-walking.pdf
3 https://assets.publishing.service.gov.uk/media/5ffa1f96d3bf7f65d9e35825/cycle-infrastructure-design-ltn-1-20.pdf
4 https://www.kent.gov.uk/about-the-council/strategies-and-policies/service-specific-policies/roads-paths-and-transportpolicies/striking-the-balance-our-local-transport-plan
5 https://www.kent.gov.uk/about-the-council/strategies-and-policies/service-specific-policies/roads-paths-and-transportpolicies/active-travel-strategy
6 https://www.kent.gov.uk/about-the-council/strategies-and-policies/service-specific-policies/environment-and-wastepolicies/environmental-policies/countryside-policies-and-reports/public-rights-of-way-improvement-plan
7 Tonbridge and Malling Borough Council (2025), 2025 Air Quality Annual Status Report (ASR)
8 Lovelace, R., Goodman, A., Aldred, R., Berkoff, N., Abbas, A., Woodcock, J., (2017). The Propensity to Cycle Tool: An open-source online system for sustainable transport planning. Journal of Transport and Land Use. 10:1, 505–528
9 Tonbridge and Malling Borough Council, Sustrans, Kent County Council (2014), Tonbridge & Malling Cycling Strategy 2014-2019
10 AADT – Annual Average Daily Traffic – number of vehicles passing a point in both directions for a year divided by 365 days
11 Connections – number of points at which a route can be joined eg. towpath, side road etc.