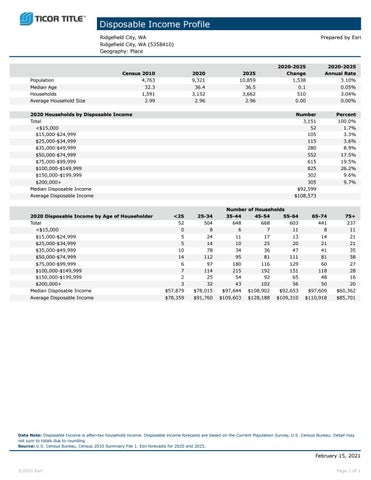
Disposable Income Profile Ridgefield City, WA Ridgefield City, WA (5358410) Geography: Place
Population Median Age Households Average Household Size
Census 2010 4,763 32.3 1,591 2.99
Prepared by Esri
2020 9,321 36.4 3,152 2.96
2020 Households by Disposable Income Total <$15,000 $15,000-$24,999 $25,000-$34,999 $35,000-$49,999 $50,000-$74,999 $75,000-$99,999 $100,000-$149,999 $150,000-$199,999 $200,000+ Median Disposable Income Average Disposable Income
2020 Disposable Income by Age of Householder Total <$15,000 $15,000-$24,999 $25,000-$34,999 $35,000-$49,999 $50,000-$74,999 $75,000-$99,999 $100,000-$149,999 $150,000-$199,999 $200,000+ Median Disposable Income Average Disposable Income
2025 10,859 36.5 3,662 2.96
2020-2025 Change 1,538 0.1 510 0.00
2020-2025 Annual Rate 3.10% 0.05% 3.04% 0.00%
Number 3,151 52 105 115 280 552 615 825 302 305 $92,599 $108,573
<25 52 0 5 5 10 14 6 7 2 3 $57,879 $78,359
25-34 504 8 24 14 78 112 97 114 25 32 $78,015 $91,760
Number of Households 35-44 45-54 55-64 648 668 603 6 7 11 11 17 13 10 25 20 34 36 47 95 81 111 180 116 129 215 192 151 54 92 65 43 102 56 $97,644 $108,902 $92,653 $109,603 $128,188 $109,310
65-74 441 8 14 21 41 81 60 118 48 50 $97,609 $110,918
Percent 100.0% 1.7% 3.3% 3.6% 8.9% 17.5% 19.5% 26.2% 9.6% 9.7%
75+ 237 11 21 21 35 58 27 28 16 20 $60,362 $85,701
Data Note: Disposable Income is after-tax household income. Disposable income forecasts are based on the Current Population Survey, U.S. Census Bureau. Detail may not sum to totals due to rounding Source: U.S. Census Bureau, Census 2010 Summary File 1. Esri forecasts for 2020 and 2025.
February 15, 2021 ©2021 Esri
Page 1 of 1