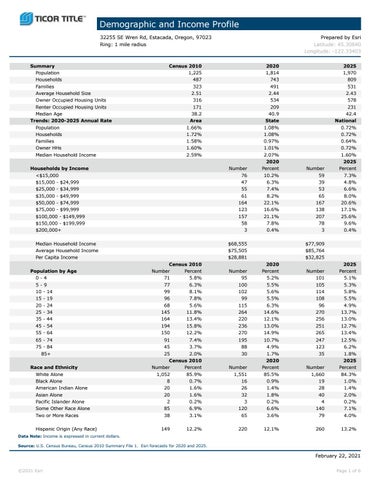
Demographic and Income Profile 32255 SE Wren Rd, Estacada, Oregon, 97023 Ring: 1 mile radius
Summary
Prepared by Esri Latitude: 45.30840 Longitude: -122.33403
Census 2010
2020
2025
1,225
1,814
1,970
Households
487
743
809
Families
323
491
531
2.51
2.44
2.43
Population
Average Household Size Owner Occupied Housing Units
316
534
578
Renter Occupied Housing Units
171
209
231
Median Age
38.2
40.9
42.4
Area
State
National
Population Households
1.66% 1.72%
1.08% 1.08%
0.72% 0.72%
Families Owner HHs
1.58% 1.60%
0.97% 1.01%
0.64% 0.72%
Median Household Income
2.59%
2.07% 2020
1.60% 2025
Trends: 2020-2025 Annual Rate
Households by Income
Number
Percent
Number
Percent
<$15,000
76
10.2%
59
7.3%
$15,000 - $24,999
47
6.3%
39
4.8%
$25,000 - $34,999
55
7.4%
53
6.6%
$35,000 - $49,999
61
8.2%
65
8.0%
$50,000 - $74,999
164
22.1%
167
20.6%
$75,000 - $99,999
123
16.6%
138
17.1%
$100,000 - $149,999
157
21.1%
207
25.6%
$150,000 - $199,999
58
7.8%
78
9.6%
3
0.4%
3
0.4%
$200,000+ Median Household Income Average Household Income Per Capita Income
$68,555 $75,505 $28,881 Census 2010
Population by Age
Number
Percent
$77,909 $85,764 $32,825 2020
Number
Percent
2025 Number
Percent
0-4
71
5.8%
95
5.2%
101
5.1%
5-9
77
6.3%
100
5.5%
105
5.3%
10 - 14
99
8.1%
102
5.6%
114
5.8%
15 - 19
96
7.8%
99
5.5%
108
5.5%
20 - 24
68
5.6%
115
6.3%
96
4.9%
25 - 34
145
11.8%
264
14.6%
270
13.7%
35 - 44
164
13.4%
220
12.1%
256
13.0%
45 - 54
194
15.8%
236
13.0%
251
12.7%
55 - 64
150
12.2%
270
14.9%
265
13.4%
65 - 74
91
7.4%
195
10.7%
247
12.5%
75 - 84
45
3.7%
88
4.9%
123
6.2%
25
2.0%
30
1.7%
35
1.8%
85+
Census 2010 Race and Ethnicity
2020
2025
Number
Percent
Number
Percent
Number
Percent
White Alone
1,052
85.9%
1,551
85.5%
1,660
84.3%
Black Alone
8
0.7%
16
0.9%
19
1.0%
American Indian Alone
20
1.6%
26
1.4%
28
1.4%
Asian Alone
20
1.6%
32
1.8%
40
2.0%
2
0.2%
3
0.2%
4
0.2%
Some Other Race Alone
85
6.9%
120
6.6%
140
7.1%
Two or More Races
38
3.1%
65
3.6%
79
4.0%
149
12.2%
220
12.1%
260
13.2%
Pacific Islander Alone
Hispanic Origin (Any Race) Data Note: Income is expressed in current dollars.
Source: U.S. Census Bureau, Census 2010 Summary File 1. Esri forecasts for 2020 and 2025.
February 22, 2021 ©2021 Esri
Page 1 of 6