Summary Profile
2010-2020 Census, 2023 Estimates with 2028 Projections
Calculated using Weighted Block Centroid from Block Groups

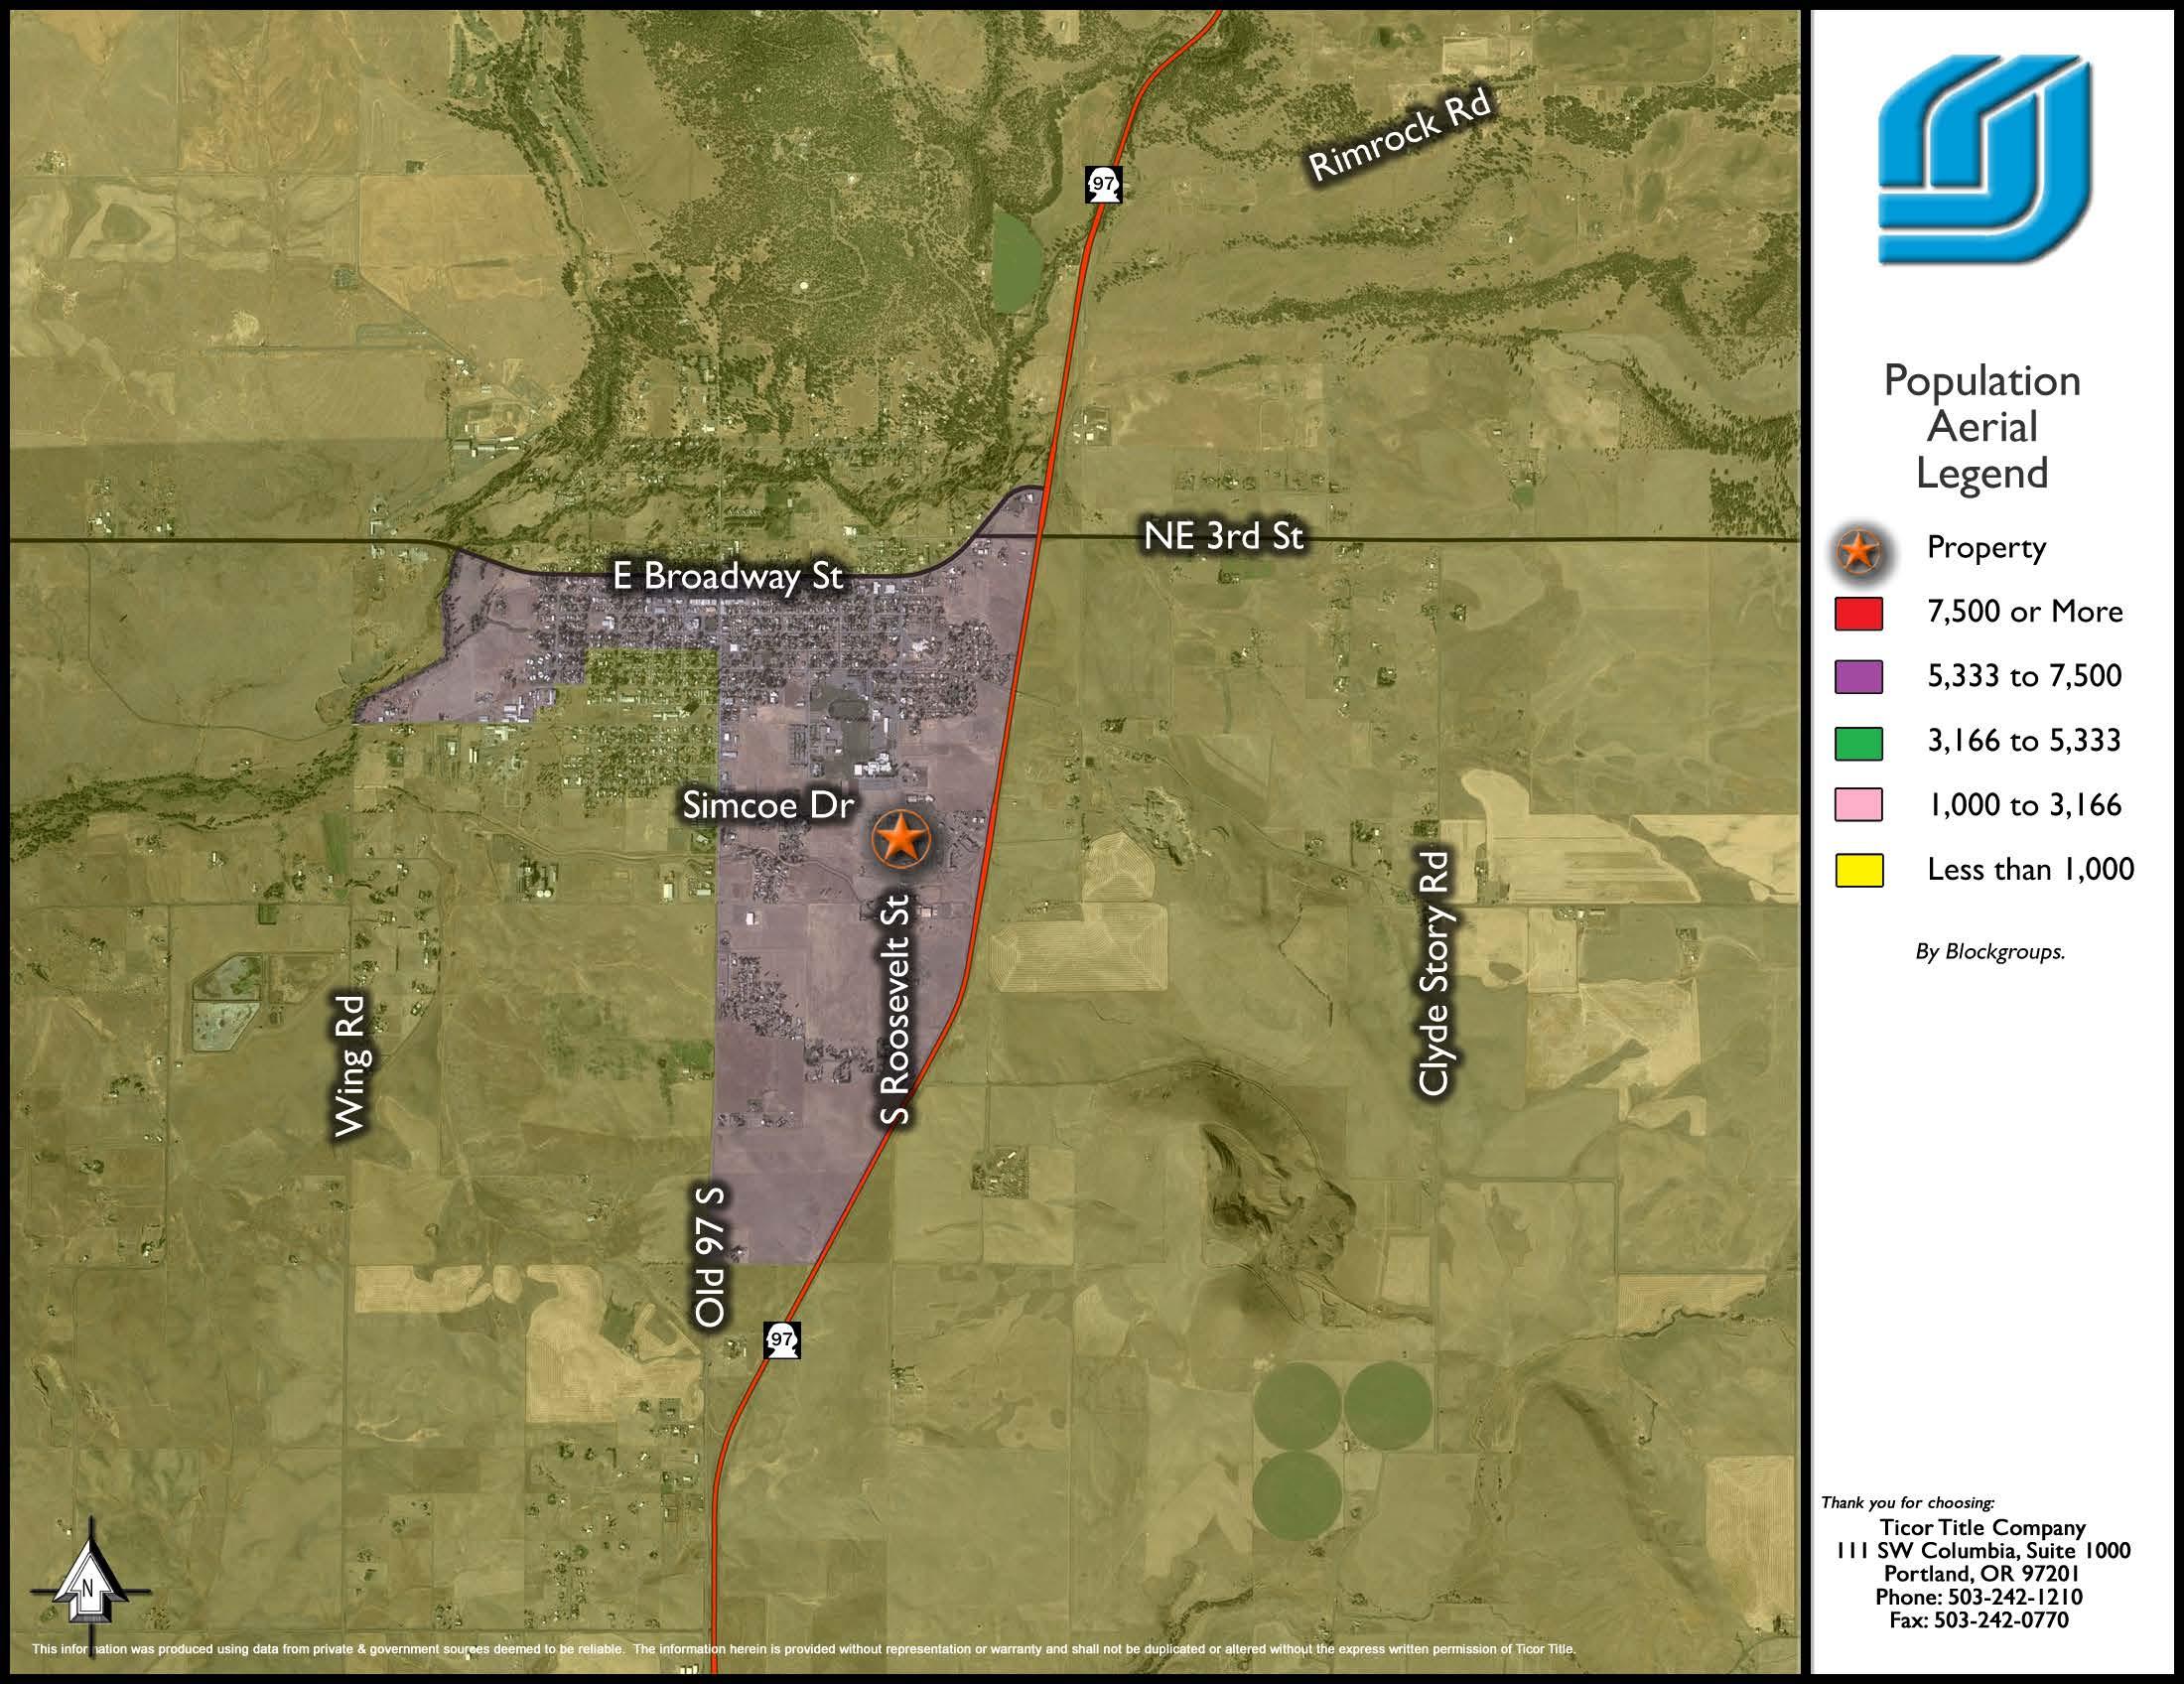
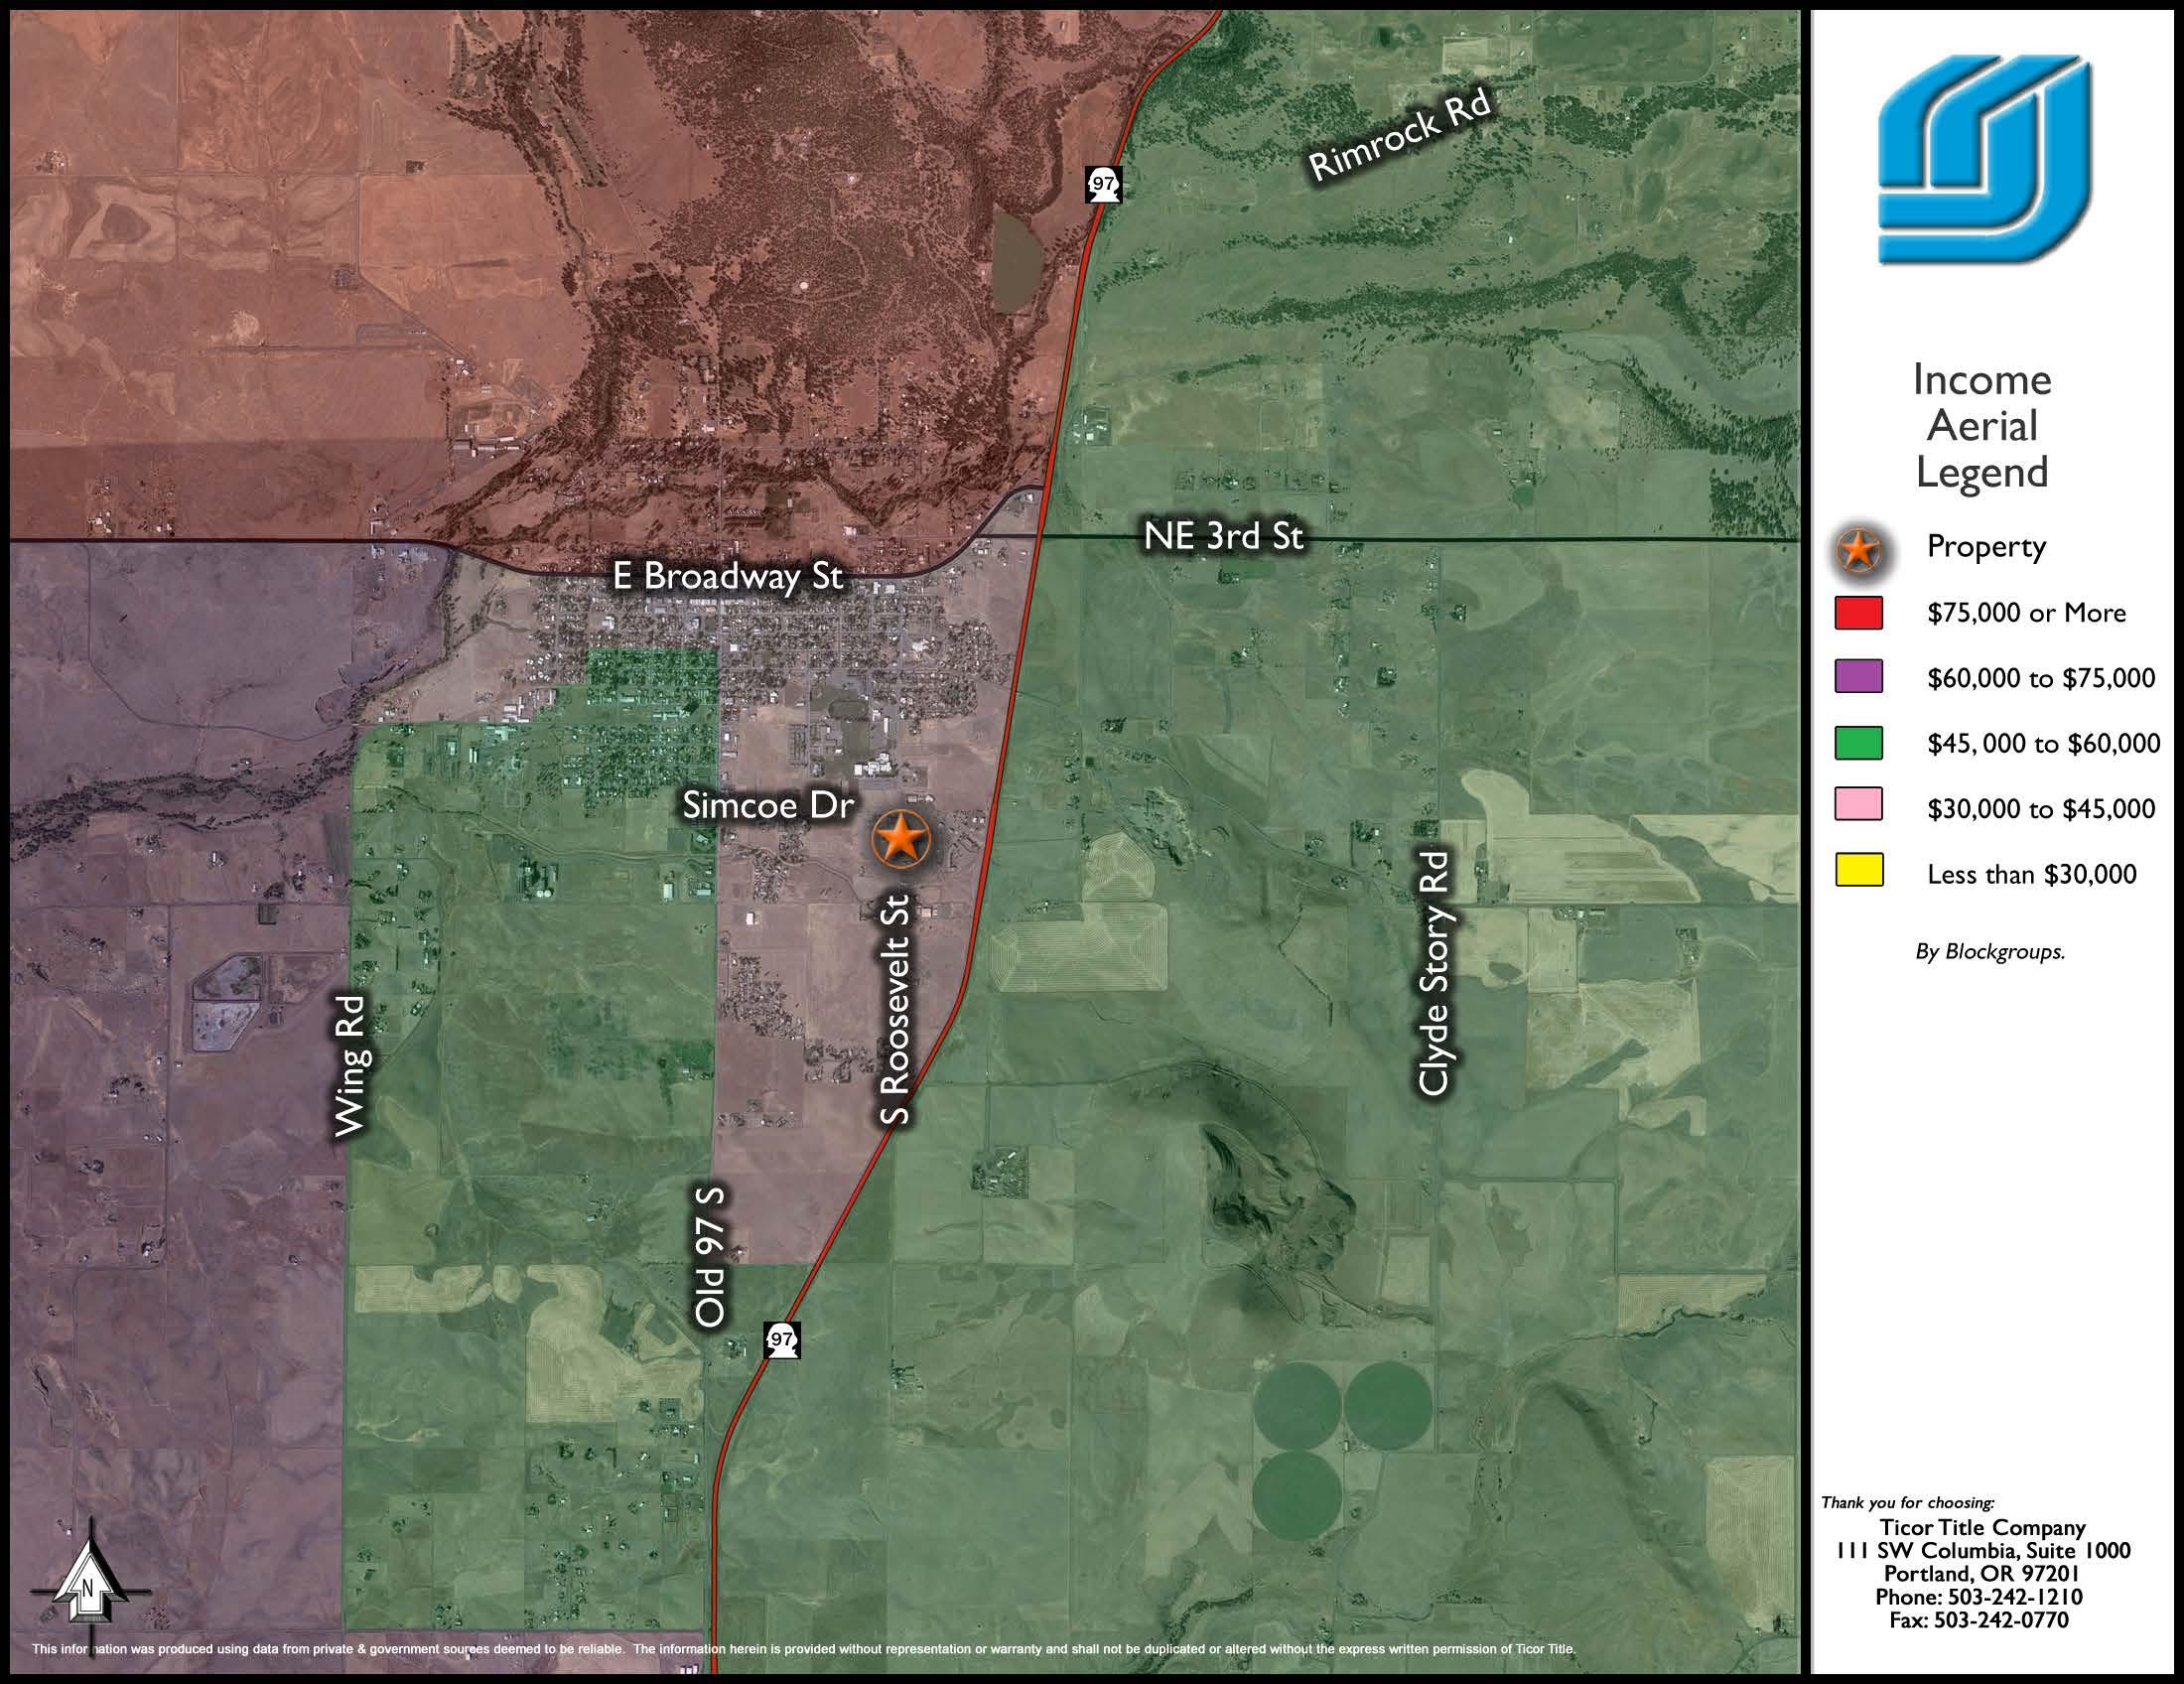
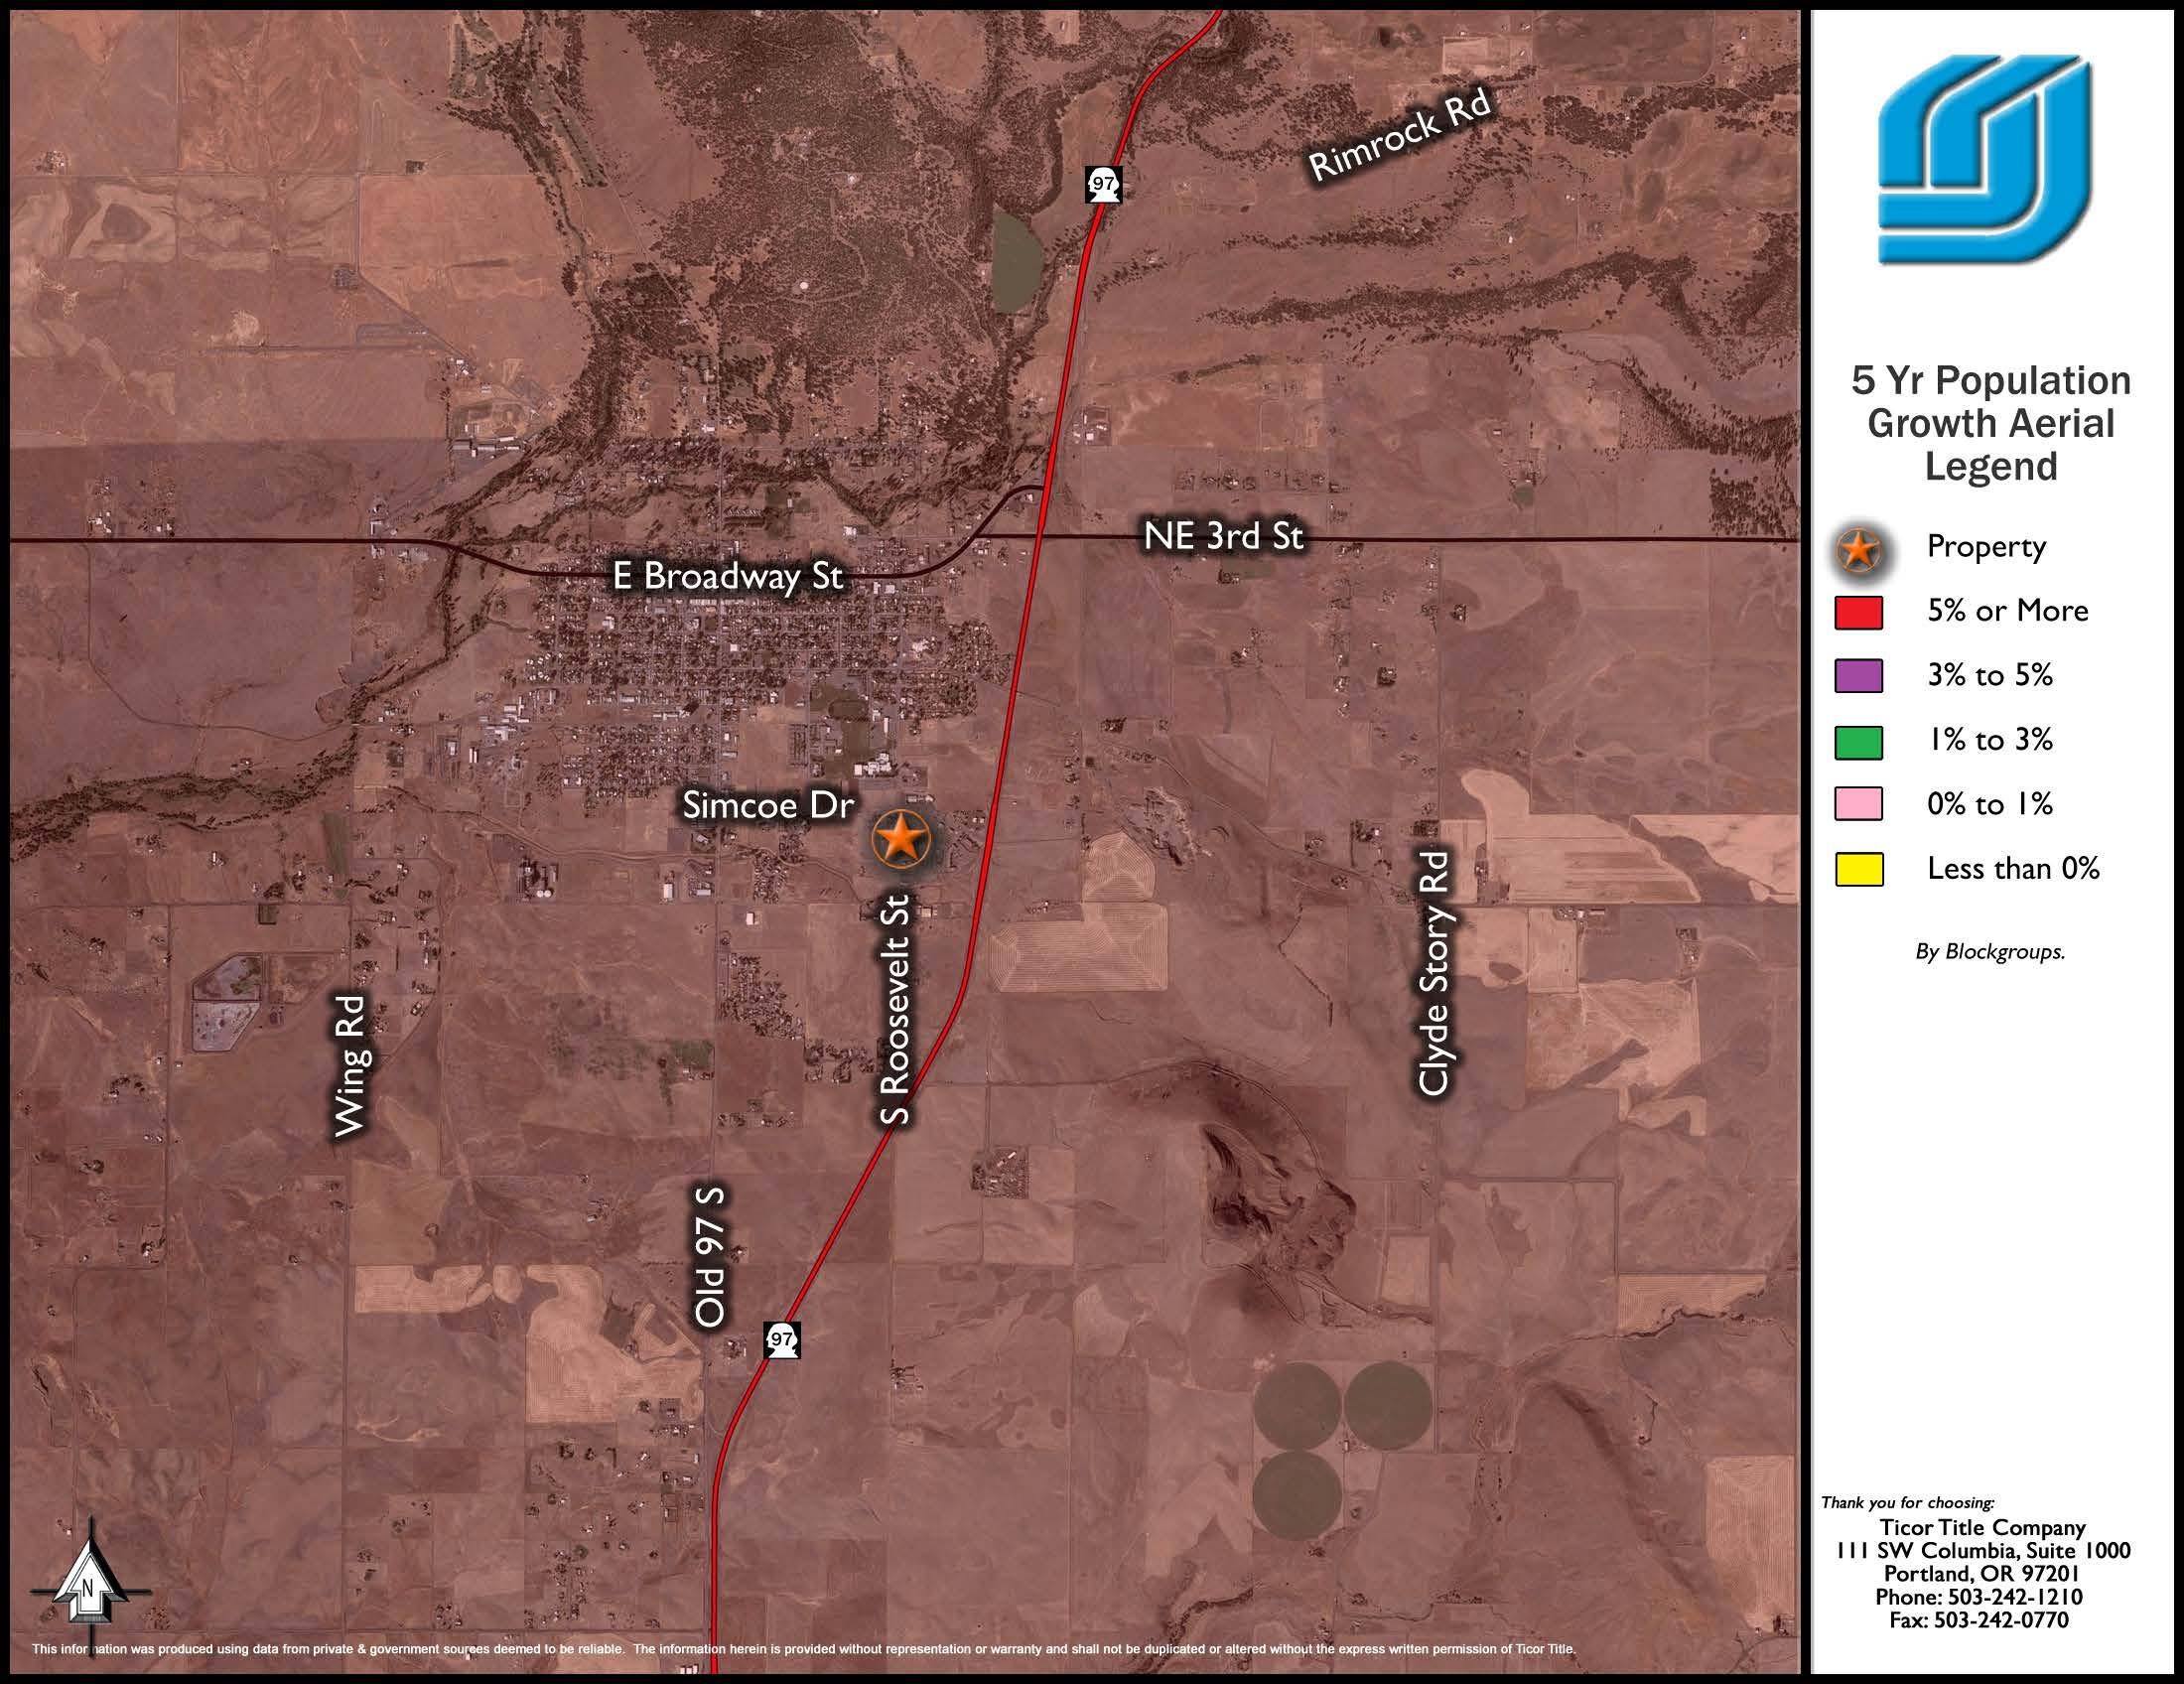
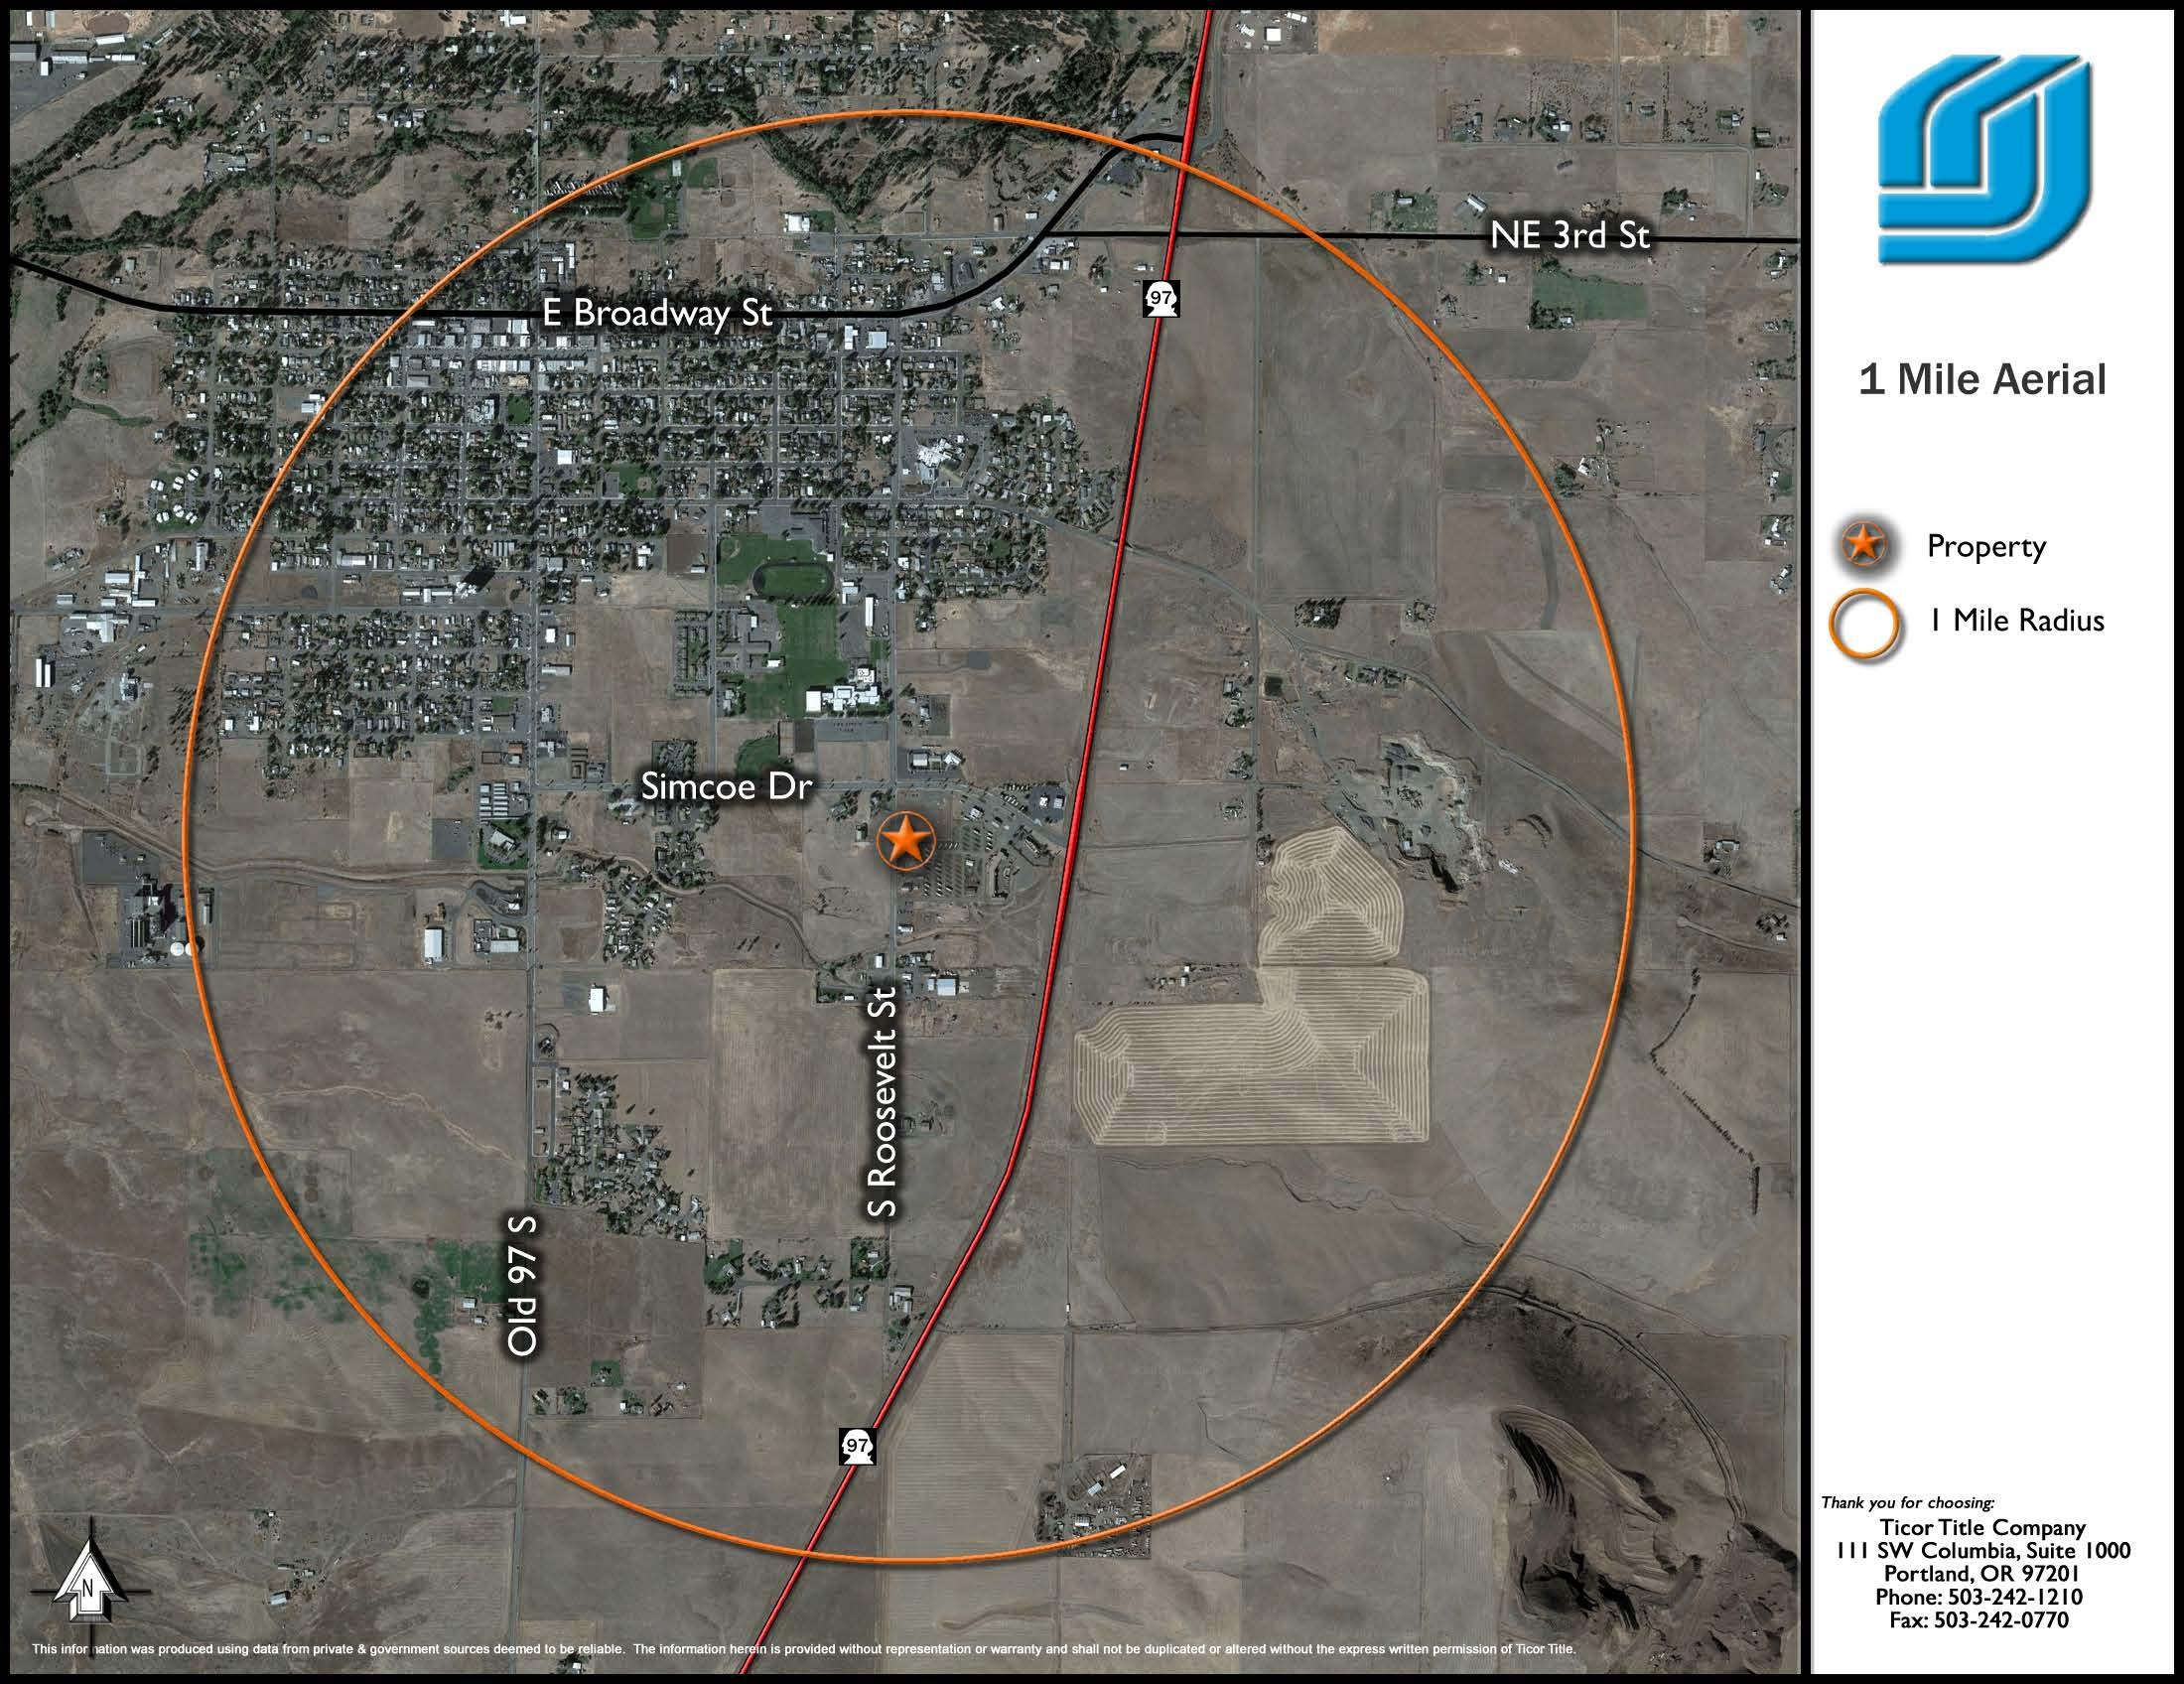
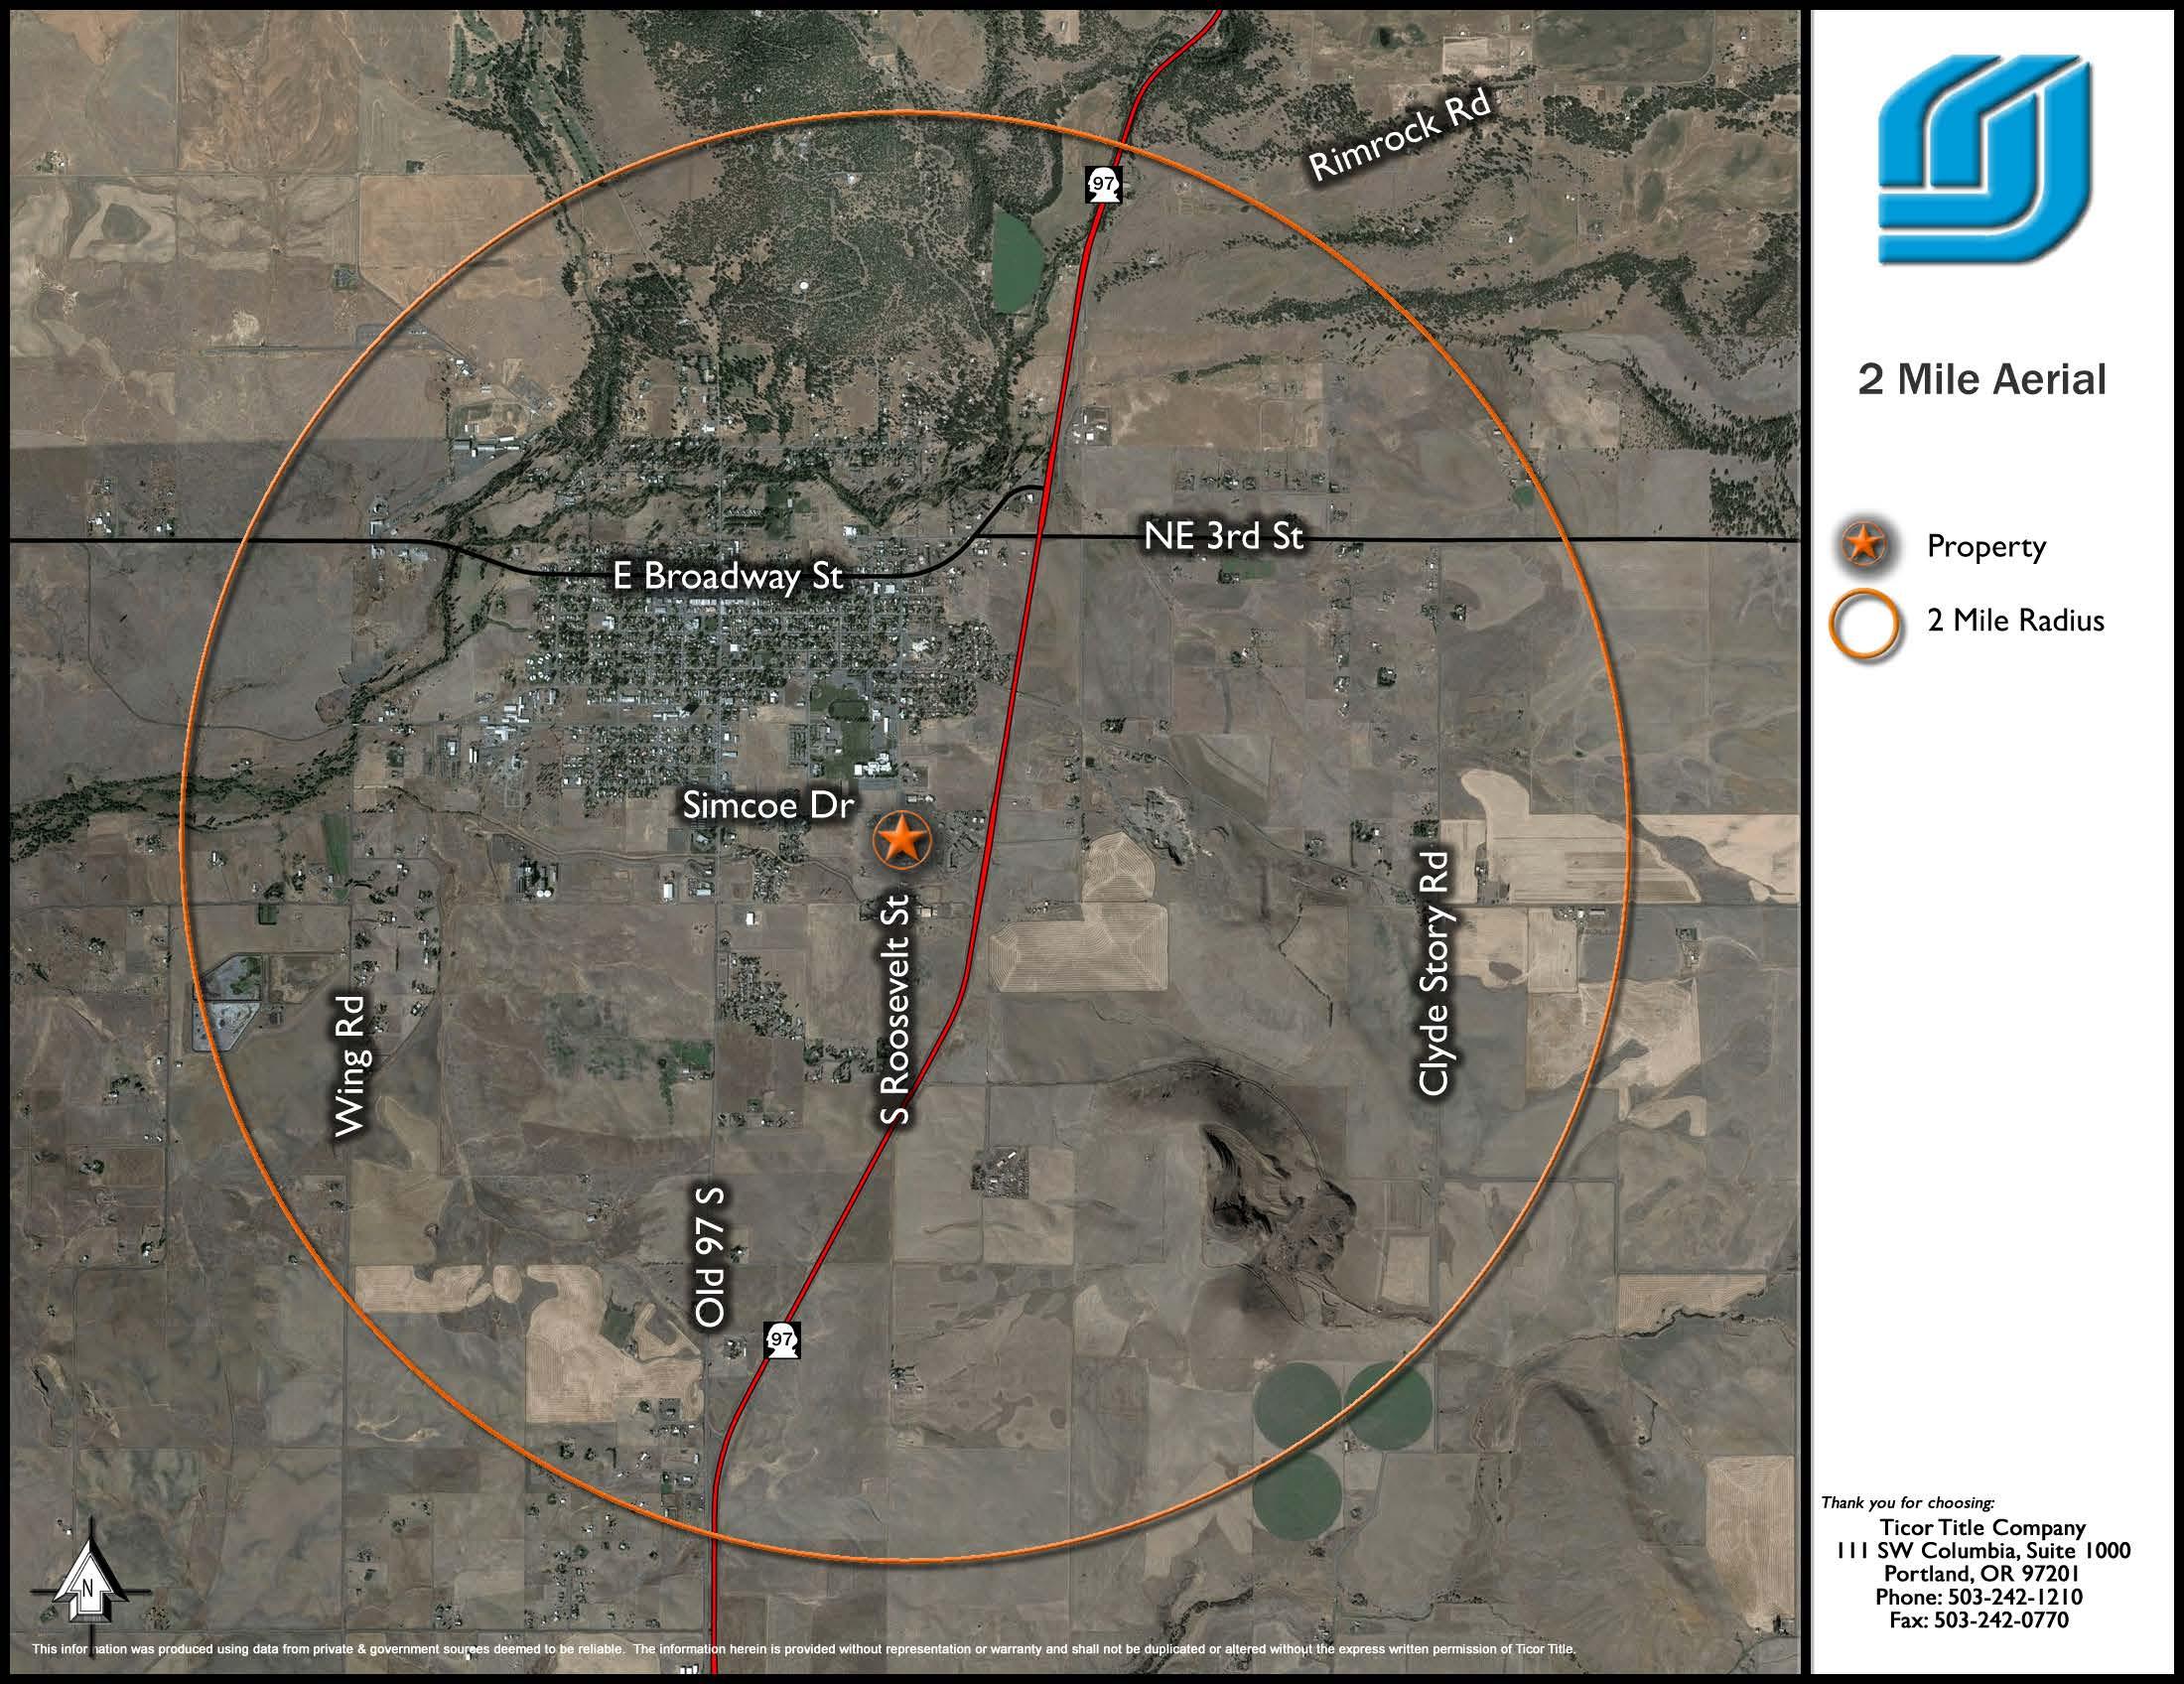
Lat/Lon: 45.8125/-120.8119 628 E Simcoe Dr 2 mi radius Goldendale, WA 98620 Population 2023 Estimated Population 0 T 0 T 0 T 4,105 2028 Projected Population 0 T 0 T 0 T 4,497 2020 Census Population 0 T 0 T 0 T 3,814 2010 Census Population 0 T 0 T 0 T 3,729 Projected Annual Growth 2023 to 2028 - - - 1.9% Historical Annual Growth 2010 to 2023 - - - 0.8% 2023 Median Age 46.6 Households 2023 Estimated Households 0 T 0 T 0 T 1,764 2028 Projected Households 0 T 0 T 0 T 1,880 2020 Census Households 0 T 0 T 0 T 1,684 2010 Census Households 0 T 0 T 0 T 1,586 Projected Annual Growth 2023 to 2028 - - - 1.3% Historical Annual Growth 2010 to 2023 - - - 0.9% Race and Ethnicity 2023 Estimated White - - - 87.0% 2023 Estimated Black or African American - - - 1.5% 2023 Estimated Asian or Pacific Islander - - - 0.7% 2023 Estimated American Indian or Native Alaskan - - - 1.7% 2023 Estimated Other Races - - - 9.1% 2023 Estimated Hispanic - - - 9.6% Income 2023 Estimated Average Household Income $0 T $0 T $0 T $80,288 2023 Estimated Median Household Income $0 T $0 T $0 T $49,342 2023 Estimated Per Capita Income $0 T $0 T $0 T $34,792 Education (Age 25+) 2023 Estimated Elementary (Grade Level 0 to 8) - - - 0.7% 2023 Estimated Some High School (Grade Level 9 to 11) - - - 3.9% 2023 Estimated High School Graduate - - - 30.9% 2023 Estimated Some College - - - 27.3% 2023 Estimated Associates Degree Only - - - 8.9% 2023 Estimated Bachelors Degree Only - - - 16.5% 2023 Estimated Graduate Degree - - - 11.8% Business 2023 Estimated Total Businesses 0 T 0 T 0 T 166 2023 Estimated Total Employees 0 T 0 T 0 T 1,610 2023 Estimated Employee Population per Business - - - 9.7 2023 Estimated Residential Population per Business - - - 24.8 ©2024, Sites USA, Chandler, Arizona, 480-491-1112 Demographic Source: Applied Geographic Solutions 11/2023, TIGER Geography - RS1 This report was produced using data from private and government sources deemed to be reliable. The information herein is provided without representation or warranty. page 1 of 1
Chapter 17.20
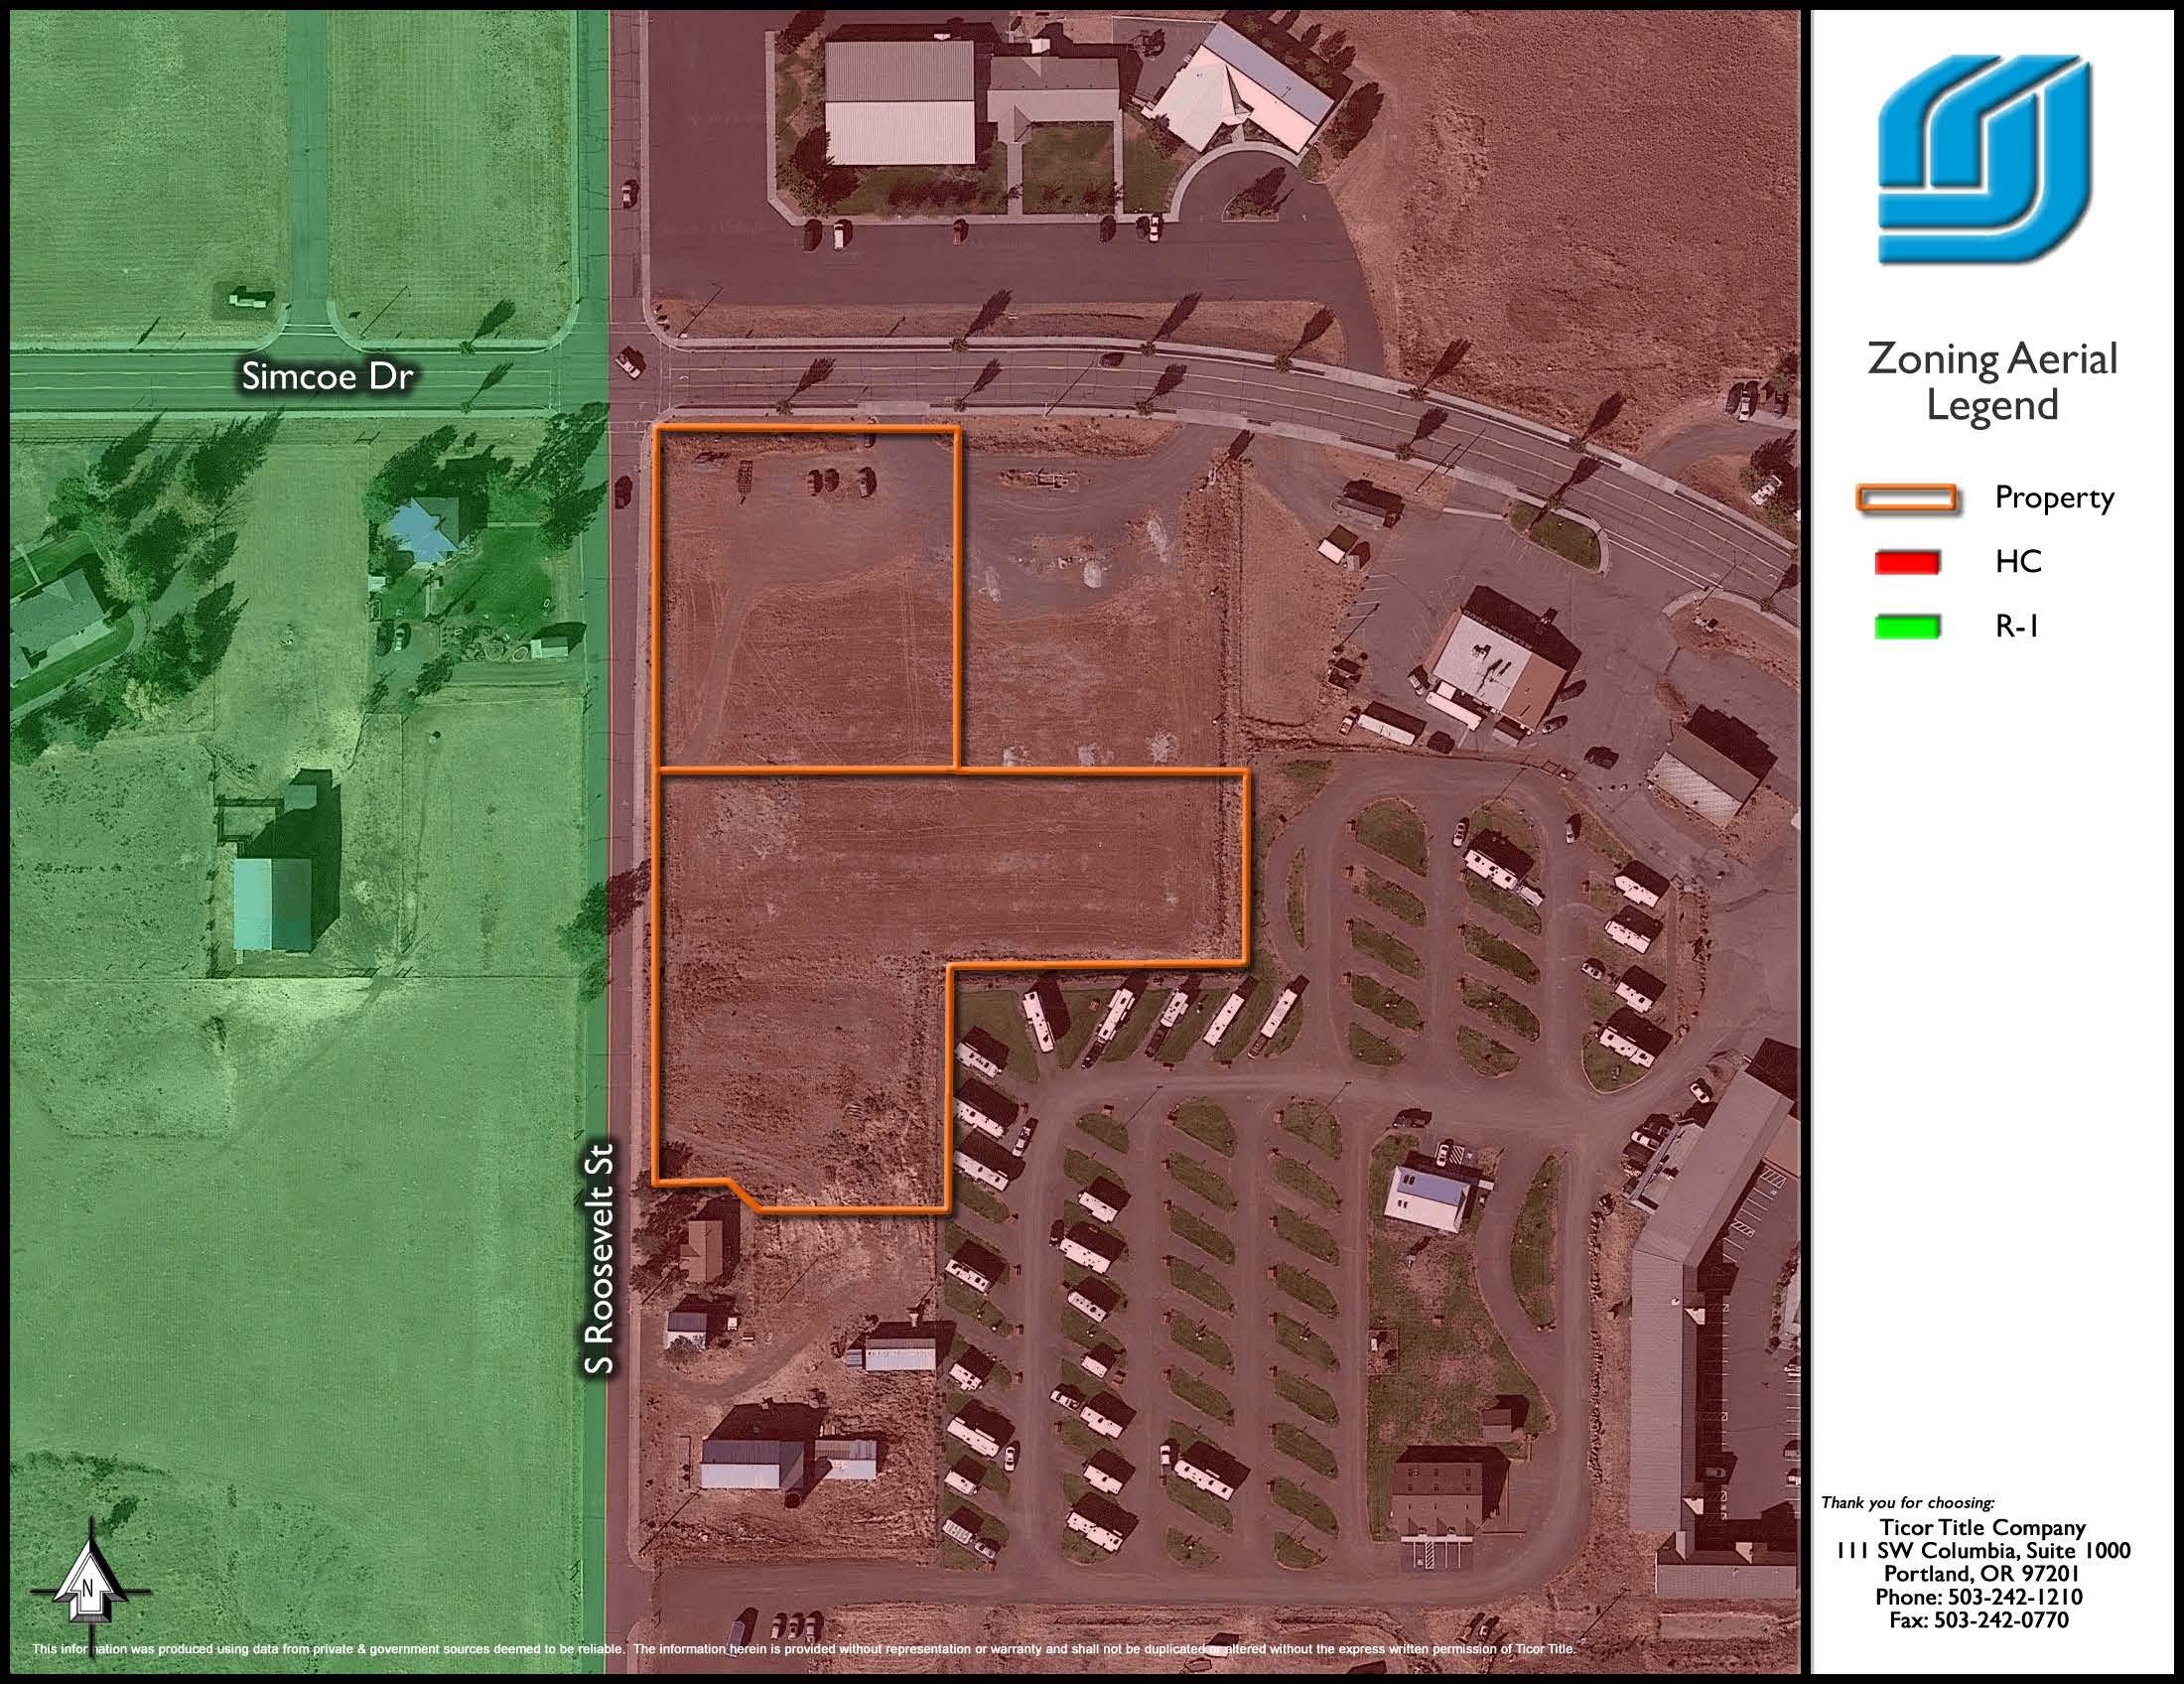
HIGHWAY COMMERCIAL DISTRICT (HC)
Sections:
17.20.010 Purpose.
17.20.020 Principal uses.
17.20.030 Accessory uses.
17.20.040 Conditional uses.
17.20.050 Development standards.
17.20.060 Parking.
17.20.070 Landscaping.
17.20.080 Site plan.
17.20.010 Purpose.
The purpose of this district is to provide services to the traveling public by providing related retail, lodging, auto, eating and other commercial services around access points to US 97. (Ord. 1438 §2(part), 2014)
17.20.020 Principal uses.
Principal uses permitted outright in highway commercial district shall include:
A. Overnight accommodations, eating and drinking and entertainment establishments;
B. Other commercial services, including auto-oriented services such as car washes, truck and auto sales and repair, recreational vehicle support and services, machinery, and gas stations;
C. Retail and wholesale goods, sales and service;
D. Offices and related business activity;
E. Governmental facilities;
F. Truck service and repair facilities;
G. Highway service facilities;
The Goldendale Municipal Code is current through Ordinance 1524, passed December 19, 2022.
Goldendale Municipal Code Chapter 17.20 HIGHWAY COMMERCIAL DISTRICT (HC) Page 1 of3
H. Breweries, brew pubs and wineries;
I. Recreational vehicle parks. (Ord. 1438 §2(part), 2014)
17.20.030 Accessory uses.
Accessory buildings shall not be permitted on a parcel prior to the existence of a principal use. Accessory uses permitted in highway commercial districts shall include:
A. All business, service, repair, processing, or storage shall be conducted wholly within an enclosed building, except for off-street parking;
B. Business signs in compliance with Chapter 17.42;
C. Accessory uses in the highway commercial district may be permitted which are customarily incidental and subordinate to the principal use. (Ord. 1438 §2(part), 2014)
17.20.040 Conditional uses.
Conditional uses permitted in highway commercial districts shall include:
A. Residential uses; provided, that all residential dwellings permitted in the multifamily residential district (R-3) meet the development standards of Section 17.12.050;
B. Any principal or conditional use in a general commercial district (Chapter 17.22) that is not listed as a principal use above.
C. Other uses deemed by the board of adjustment as similar to and consistent with the intent and purpose of the general commercial zoning district. (Ord. 1438 §2(part), 2014)
17.20.050 Development standards.
The following provisions shall apply in the highway commercial district, subject to other provisions of this title, except that where conflicts in regulation occur, the regulations specified in this section or on a development plan approved pursuant to this chapter shall apply:
A. Minimum lot area: not applicable;
B. Minimum lot width: fifty feet;
C. Minimum lot depth: fifty feet;
D. Maximum building height: two stories but not to exceed forty feet;
E. Maximum lot coverage: not applicable;
The Goldendale Municipal Code is current through Ordinance 1524, passed December 19, 2022.
Goldendale Municipal Code
17.20 HIGHWAY COMMERCIAL DISTRICT (HC) Page 2 of3
Chapter
Goldendale Municipal Code Chapter
17.20 HIGHWAY COMMERCIAL DISTRICT (HC)
F. Minimum front yard depth: twenty feet;
G. Minimum rear yard depth: zero feet (ten feet when abutting a residential district);
H. Minimum side yard width: zero feet (twenty feet when abutting a residential district);
I. All utilities shall be installed underground. (Ord. 1438 §2(part), 2014)
17.20.060 Parking.
Off-street parking shall be provided in accordance with the terms of Chapter 17.52. (Ord. 1438 §2(part), 2014)
17.20.070 Landscaping.
Landscaping shall be provided with the terms of Chapter 17.54. (Ord. 1438 §2(part), 2014)
17.20.080 Site plan.
A site plan shall be approved in accordance with the terms of Chapter 17.46. (Ord. 1438 §2(part), 2014) The Goldendale Municipal Code is current through Ordinance 1524, passed December 19, 2022. Page 3 of3
2010-2020 Census, 2023 Estimates with 2028 Projections
Calculated using Weighted Block Centroid from Block Groups
Full Profile
45.8125/-120.8119 628 E Simcoe Dr 1 mi radius3 mi radius5 mi radius7 mi radius Goldendale, WA 98620 Population 2023 Estimated Population 2,639 4,526 5,380 6,767 2028 Projected Population 2,857 4,973 5,949 7,492 2020 Census Population 2,526 4,123 4,772 6,099 2010 Census Population 2,521 4,004 4,585 5,759 Projected Annual Growth 2023 to 2028 1.6% 2.0% 2.1% 2.1% Historical Annual Growth 2010 to 2023 0.4% 1.0% 1.3% 1.3% Households 2023 Estimated Households 1,130 1,945 2,315 2,905 2028 Projected Households 1,189 2,080 2,492 3,132 2020 Census Households 1,131 1,816 2,093 2,656 2010 Census Households 1,075 1,704 1,953 2,447 Projected Annual Growth 2023 to 2028 1.1% 1.4% 1.5% 1.6% Historical Annual Growth 2010 to 2023 0.4% 1.1% 1.4% 1.4% Age 2023 Est. Population Under 10 Years 10.0% 9.0% 8.5% 8.0% 2023 Est. Population 10 to 19 Years 9.5% 9.1% 8.9% 8.7% 2023 Est. Population 20 to 29 Years 10.1% 9.8% 9.4% 8.9% 2023 Est. Population 30 to 44 Years 18.7% 17.9% 17.5% 16.9% 2023 Est. Population 45 to 59 Years 16.9% 18.0% 18.4% 18.7% 2023 Est. Population 60 to 74 Years 23.2% 25.4% 26.8% 28.5% 2023 Est. Population 75 Years or Over 11.6% 10.7% 10.5% 10.3% 2023 Est. Median Age 45.4 47.4 48.6 50.0 Marital Status & Gender 2023 Est. Male Population 47.7% 48.9% 49.3% 49.6% 2023 Est. Female Population 52.3% 51.1% 50.7% 50.4% 2023 Est. Never Married 32.0% 30.6% 28.9% 26.5% 2023 Est. Now Married 35.1% 40.7% 42.9% 45.4% 2023 Est. Separated or Divorced 25.0% 22.4% 21.9% 22.2% 2023 Est. Widowed 7.8% 6.3% 6.2% 5.8% Income 2023 Est. HH Income $200,000 or More 14.1% 9.0% 8.1% 6.8% 2023 Est. HH Income $150,000 to $199,999 3.0% 4.6% 5.4% 5.8% 2023 Est. HH Income $100,000 to $149,999 1.3% 3.6% 4.9% 7.0% 2023 Est. HH Income $75,000 to $99,999 9.1% 12.9% 14.4% 14.8% 2023 Est. HH Income $50,000 to $74,999 17.4% 17.3% 17.2% 17.2% 2023 Est. HH Income $35,000 to $49,999 11.7% 12.9% 12.4% 12.6% 2023 Est. HH Income $25,000 to $34,999 14.5% 13.6% 12.5% 11.7% 2023 Est. HH Income $15,000 to $24,999 11.4% 10.7% 10.6% 10.2% 2023 Est. HH Income Under $15,000 17.6% 15.5% 14.6% 13.8% 2023 Est. Average Household Income $87,764$79,668$80,280$79,392 2023 Est. Median Household Income $44,051$50,704$53,922$55,812 2023 Est. Per Capita Income $37,694$34,504$34,779$34,285 2023 Est. Total Businesses 149 192 209 229 2023 Est. Total Employees 1,519 1,723 1,800 1,929 ©2024, Sites USA, Chandler, Arizona, 480-491-1112 Demographic Source: Applied Geographic Solutions 11/2023, TIGER Geography - RF1 This report was produced using data from private and government sources deemed to be reliable. The information herein is provided without representation or warranty. page 1 of 3
Lat/Lon:
2010-2020 Census, 2023 Estimates with 2028 Projections
Calculated using Weighted Block Centroid from Block Groups
Profile
Full
Lat/Lon: 45.8125/-120.8119 628 E Simcoe Dr 1 mi radius3 mi radius5 mi radius7 mi radius Goldendale,
Race 2023 Est. White 86.6% 87.3% 87.6% 87.9% 2023 Est. Black 1.3% 1.4% 1.3% 1.2% 2023 Est. Asian or Pacific Islander 0.6% 0.7% 0.7% 0.8% 2023 Est. American Indian or Alaska Native 1.8% 1.7% 1.7% 1.7% 2023 Est. Other Races 9.6% 8.9% 8.6% 8.3% Hispanic 2023 Est. Hispanic Population 265 423 489 591 2023 Est. Hispanic Population 10.1% 9.3% 9.1% 8.7% 2028 Proj. Hispanic Population 10.3% 9.6% 9.3% 9.0% 2020 Hispanic Population 8.8% 8.1% 7.8% 7.2% Education (Adults 25 & Older) 2023 Est. Adult Population (25 Years or Over) 1,992 3,482 4,185 5,333 2023 Est. Elementary (Grade Level 0 to 8) 0.7% 0.7% 0.7% 0.9% 2023 Est. Some High School (Grade Level 9 to 11) 4.7% 4.0% 4.2% 4.7% 2023 Est. High School Graduate 33.1% 30.9% 30.3% 30.6% 2023 Est. Some College 25.7% 27.0% 26.6% 26.2% 2023 Est. Associate Degree Only 9.5% 9.2% 9.1% 9.5% 2023 Est. Bachelor Degree Only 15.8% 16.5% 17.0% 16.6% 2023 Est. Graduate Degree 10.6% 11.8% 12.0% 11.5% Housing 2023 Est. Total Housing Units 1,216 2,108 2,521 3,175 2023 Est. Owner-Occupied 65.3% 65.1% 65.0% 65.0% 2023 Est. Renter-Occupied 27.7% 27.2% 26.9% 26.5% 2023 Est. Vacant Housing 7.1% 7.7% 8.2% 8.5% Homes Built by Year 2023 Homes Built 2010 or later 6.3% 7.2% 7.7% 7.6% 2023 Homes Built 2000 to 2009 10.2% 12.3% 12.4% 12.3% 2023 Homes Built 1990 to 1999 20.3% 19.0% 19.4% 20.4% 2023 Homes Built 1980 to 1989 8.4% 7.5% 7.6% 7.9% 2023 Homes Built 1970 to 1979 13.4% 15.6% 15.8% 15.4% 2023 Homes Built 1960 to 1969 8.7% 7.1% 6.6% 6.1% 2023 Homes Built 1950 to 1959 10.0% 9.1% 8.6% 8.1% 2023 Homes Built Before 1949 15.5% 14.5% 13.8% 13.8% Home Values 2023 Home Value $1,000,000 or More 0.9% 0.8% 0.8% 0.8% 2023 Home Value $500,000 to $999,999 2.6% 3.7% 4.3% 5.2% 2023 Home Value $400,000 to $499,999 2.3% 4.5% 5.6% 6.6% 2023 Home Value $300,000 to $399,999 16.0% 20.8% 21.2% 21.1% 2023 Home Value $200,000 to $299,999 17.6% 18.3% 19.2% 20.3% 2023 Home Value $150,000 to $199,999 25.7% 19.4% 18.1% 17.0% 2023 Home Value $100,000 to $149,999 27.9% 23.5% 22.1% 19.8% 2023 Home Value $50,000 to $99,999 6.2% 8.0% 7.7% 7.9% 2023 Home Value $25,000 to $49,999 0.5% 0.7% 0.9% 1.1% 2023 Home Value Under $25,000 0.2% 0.2% 0.1% 0.2% 2023 Median Home Value $192,724$211,947$222,028$231,863 2023 Median Rent $763 $727 $709 $700 ©2024, Sites USA, Chandler, Arizona, 480-491-1112 Demographic Source: Applied Geographic Solutions 11/2023, TIGER Geography - RF1 This report was produced using data from private and government sources deemed to be reliable. The information herein is provided without representation or warranty. page 2 of 3
WA 98620
2010-2020 Census, 2023 Estimates with 2028 Projections
Calculated using Weighted Block Centroid from Block Groups
Profile
Full
Lat/Lon: 45.8125/-120.8119 628 E Simcoe Dr 1 mi radius3 mi radius5 mi radius7 mi radius Goldendale, WA 98620 Labor Force 2023 Est. Labor Population Age 16 Years or Over 2,208 3,853 4,610 5,846 2023 Est. Civilian Employed 44.8% 44.8% 44.1% 42.7% 2023 Est. Civilian Unemployed 3.4% 3.9% 3.6% 3.2% 2023 Est. in Armed Forces - - -2023 Est. not in Labor Force 51.8% 51.3% 52.3% 54.1% 2023 Labor Force Males 46.3% 48.0% 48.5% 49.0% 2023 Labor Force Females 53.7% 52.0% 51.5% 51.0% Occupation 2023 Occupation: Population Age 16 Years or Over 988 1,724 2,034 2,496 2023 Mgmt, Business, & Financial Operations 8.4% 9.2% 8.5% 8.6% 2023 Professional, Related 24.2% 24.6% 25.4% 24.7% 2023 Service 21.5% 19.5% 19.6% 19.9% 2023 Sales, Office 19.0% 20.4% 20.9% 21.4% 2023 Farming, Fishing, Forestry 0.6% 0.7% 0.8% 1.3% 2023 Construction, Extraction, Maintenance 12.4% 11.8% 12.4% 12.2% 2023 Production, Transport, Material Moving 13.9% 13.7% 12.3% 11.9% 2023 White Collar Workers 51.7% 54.3% 54.9% 54.7% 2023 Blue Collar Workers 48.3% 45.7% 45.1% 45.3% Transportation to Work 2023 Drive to Work Alone 88.9% 83.9% 83.7% 82.6% 2023 Drive to Work in Carpool 3.1% 3.4% 3.0% 2.7% 2023 Travel to Work by Public Transportation 0.2% 0.2% 0.2% 0.2% 2023 Drive to Work on Motorcycle - - -2023 Walk or Bicycle to Work 3.6% 6.4% 5.7% 5.0% 2023 Other Means 0.3% 0.3% 0.3% 0.4% 2023 Work at Home 3.8% 5.7% 7.1% 9.1% Travel Time 2023 Travel to Work in 14 Minutes or Less 45.2% 51.4% 51.1% 48.9% 2023 Travel to Work in 15 to 29 Minutes 32.6% 24.4% 23.2% 23.5% 2023 Travel to Work in 30 to 59 Minutes 16.3% 15.4% 15.1% 15.8% 2023 Travel to Work in 60 Minutes or More 5.9% 8.9% 10.6% 11.8% 2023 Average Travel Time to Work 13.4 12.5 12.9 14.0 Consumer Expenditure 2023 Est. Total Household Expenditure $72.65 M$116.63 M$139.73 M$174.16 M 2023 Est. Apparel $2.56 M$4.08 M$4.88 M$6.07 M 2023 Est. Contributions, Gifts $4.38 M $6.8 M$8.09 M $10 M 2023 Est. Education, Reading $2.48 M$3.78 M$4.49 M$5.51 M 2023 Est. Entertainment $4.09 M$6.54 M$7.85 M$9.79 M 2023 Est. Food, Beverages, Tobacco $11.07 M$17.88 M$21.43 M$26.75 M 2023 Est. Furnishings, Equipment $2.53 M$4.05 M$4.87 M$6.07 M 2023 Est. Health Care, Insurance $6.69 M$10.84 M$13.01 M$16.27 M 2023 Est. Household Operations, Shelter, Utilities $23.65 M $38 M$45.5 M$56.7 M 2023 Est. Miscellaneous Expenses $1.38 M$2.22 M$2.66 M$3.31 M 2023 Est. Personal Care $968.24 K$1.56 M$1.87 M$2.33 M 2023 Est. Transportation $12.86 M$20.87 M$25.08 M$31.38 M ©2024, Sites USA, Chandler, Arizona, 480-491-1112 Demographic Source: Applied Geographic Solutions 11/2023, TIGER Geography - RF1 This report was produced using data from private and government sources deemed to be reliable. The information herein is provided without representation or warranty. page 3 of 3
2010-2020 Census, 2023 Estimates with 2028 Projections
Calculated using Weighted Block Centroid from Block Groups
Full Profile
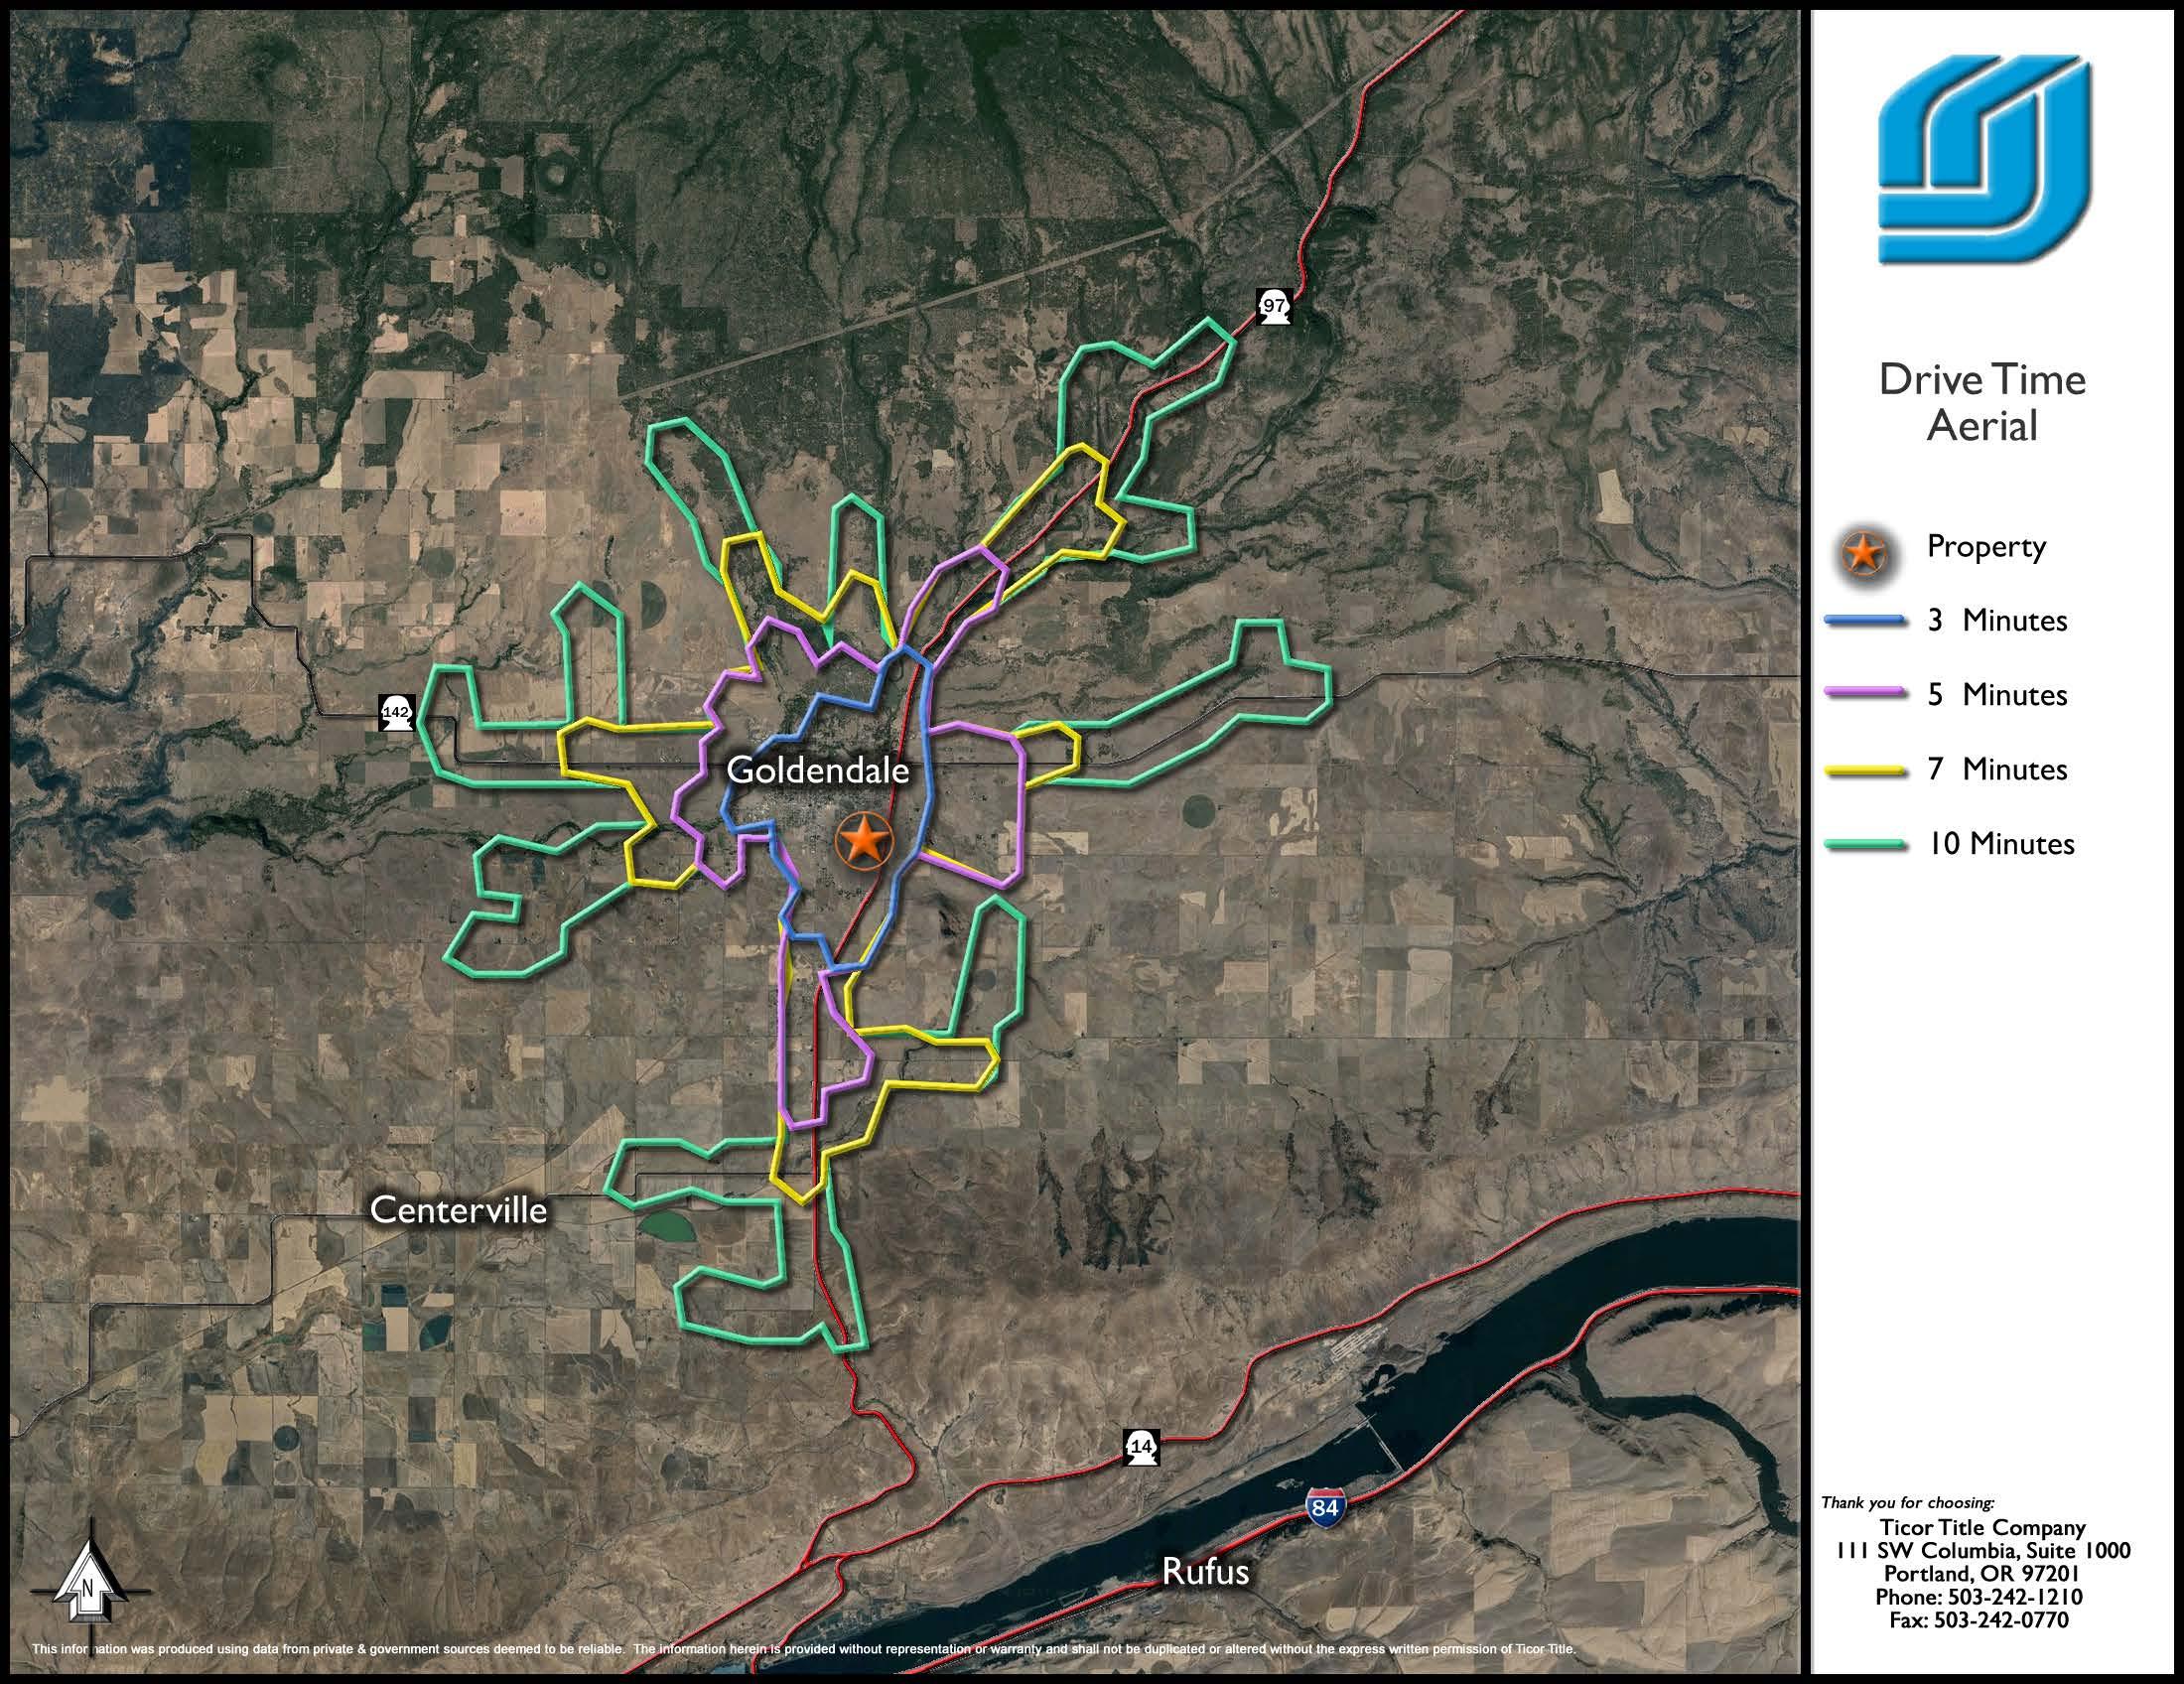
Lat/Lon: 45.8125/-120.8119 628 E Simcoe Dr 3 min drive time 5 min drive time 7 min drive time 10 min drive time Goldendale, WA 98620 Population 2023 Estimated Population 3,920 4,304 4,398 4,563 2028 Projected Population 4,291 4,722 4,826 5,012 2020 Census Population 3,614 3,928 4,002 4,231 2010 Census Population 3,550 3,833 3,898 4,098 Projected Annual Growth 2023 to 2028 1.9% 1.9% 1.9% 2.0% Historical Annual Growth 2010 to 2023 0.8% 0.9% 1.0% 0.9% Households 2023 Estimated Households 1,684 1,850 1,891 1,962 2028 Projected Households 1,794 1,975 2,019 2,097 2020 Census Households 1,597 1,733 1,765 1,861 2010 Census Households 1,509 1,631 1,658 1,743 Projected Annual Growth 2023 to 2028 1.3% 1.3% 1.4% 1.4% Historical Annual Growth 2010 to 2023 0.9% 1.0% 1.1% 1.0% Age 2023 Est. Population Under 10 Years 9.4% 9.2% 9.1% 9.0% 2023 Est. Population 10 to 19 Years 9.3% 9.2% 9.2% 9.1% 2023 Est. Population 20 to 29 Years 10.3% 10.0% 10.0% 9.8% 2023 Est. Population 30 to 44 Years 18.4% 18.1% 18.1% 17.9% 2023 Est. Population 45 to 59 Years 17.7% 17.9% 17.9% 18.0% 2023 Est. Population 60 to 74 Years 24.2% 24.9% 25.1% 25.5% 2023 Est. Population 75 Years or Over 10.8% 10.7% 10.7% 10.7% 2023 Est. Median Age 46.3 46.9 47.1 47.4 Marital Status & Gender 2023 Est. Male Population 48.7% 48.8% 48.9% 48.9% 2023 Est. Female Population 51.3% 51.2% 51.1% 51.1% 2023 Est. Never Married 32.6% 31.4% 31.1% 30.5% 2023 Est. Now Married 38.0% 39.8% 40.1% 40.7% 2023 Est. Separated or Divorced 22.7% 22.4% 22.5% 22.5% 2023 Est. Widowed 6.7% 6.4% 6.4% 6.3% Income 2023 Est. HH Income $200,000 or More 10.2% 9.4% 9.3% 9.0% 2023 Est. HH Income $150,000 to $199,999 4.3% 4.5% 4.6% 4.7% 2023 Est. HH Income $100,000 to $149,999 2.2% 2.9% 3.1% 3.5% 2023 Est. HH Income $75,000 to $99,999 11.9% 12.7% 12.9% 13.0% 2023 Est. HH Income $50,000 to $74,999 17.1% 17.3% 17.3% 17.3% 2023 Est. HH Income $35,000 to $49,999 12.9% 12.7% 12.7% 12.7% 2023 Est. HH Income $25,000 to $34,999 14.3% 13.9% 13.8% 13.6% 2023 Est. HH Income $15,000 to $24,999 10.5% 10.8% 10.8% 10.7% 2023 Est. HH Income Under $15,000 16.6% 15.8% 15.7% 15.5% 2023 Est. Average Household Income $80,816$79,980$79,858$79,674 2023 Est. Median Household Income $48,820$50,047$50,330$50,822 2023 Est. Per Capita Income $35,021$34,650$34,602$34,518 2023 Est. Total Businesses 161 166 170 175 2023 Est. Total Employees 1,589 1,610 1,636 1,653 ©2024, Sites USA, Chandler, Arizona, 480-491-1112 Demographic Source: Applied Geographic Solutions 11/2023, TIGER Geography - RF1 This report was produced using data from private and government sources deemed to be reliable. The information herein is provided without representation or warranty. page 1 of 3
2010-2020 Census, 2023 Estimates with 2028 Projections
Calculated using Weighted Block Centroid from Block Groups
Profile
Full
Lat/Lon: 45.8125/-120.8119 628 E Simcoe Dr 3 min drive time 5 min drive time 7 min drive time 10 min drive time Goldendale, WA 98620 Race 2023 Est. White 87.0% 87.2% 87.2% 87.3% 2023 Est. Black 1.6% 1.5% 1.5% 1.4% 2023 Est. Asian or Pacific Islander 0.6% 0.7% 0.7% 0.7% 2023 Est. American Indian or Alaska Native 1.7% 1.7% 1.7% 1.7% 2023 Est. Other Races 9.1% 9.0% 9.0% 8.9% Hispanic 2023 Est. Hispanic Population 377 408 415 427 2023 Est. Hispanic Population 9.6% 9.5% 9.4% 9.4% 2028 Proj. Hispanic Population 9.9% 9.7% 9.7% 9.6% 2020 Hispanic Population 8.5% 8.3% 8.2% 8.1% Education (Adults 25 & Older) 2023 Est. Adult Population (25 Years or Over) 2,987 3,296 3,374 3,511 2023 Est. Elementary (Grade Level 0 to 8) 0.7% 0.7% 0.7% 0.7% 2023 Est. Some High School (Grade Level 9 to 11) 3.8% 3.9% 4.0% 4.1% 2023 Est. High School Graduate 31.1% 30.7% 30.7% 30.7% 2023 Est. Some College 27.3% 27.2% 27.1% 27.0% 2023 Est. Associate Degree Only 8.8% 9.1% 9.1% 9.1% 2023 Est. Bachelor Degree Only 16.5% 16.6% 16.6% 16.6% 2023 Est. Graduate Degree 11.8% 11.9% 11.9% 11.8% Housing 2023 Est. Total Housing Units 1,819 2,001 2,046 2,125 2023 Est. Owner-Occupied 65.1% 65.1% 65.1% 65.1% 2023 Est. Renter-Occupied 27.5% 27.4% 27.3% 27.2% 2023 Est. Vacant Housing 7.4% 7.6% 7.6% 7.7% Homes Built by Year 2023 Homes Built 2010 or later 7.0% 7.2% 7.2% 7.2% 2023 Homes Built 2000 to 2009 11.8% 12.1% 12.1% 12.1% 2023 Homes Built 1990 to 1999 18.4% 18.8% 19.0% 19.2% 2023 Homes Built 1980 to 1989 7.4% 7.4% 7.5% 7.6% 2023 Homes Built 1970 to 1979 15.9% 15.7% 15.6% 15.6% 2023 Homes Built 1960 to 1969 7.5% 7.2% 7.1% 7.0% 2023 Homes Built 1950 to 1959 9.4% 9.3% 9.2% 9.1% 2023 Homes Built Before 1949 15.2% 14.7% 14.6% 14.5% Home Values 2023 Home Value $1,000,000 or More 0.8% 0.8% 0.8% 0.8% 2023 Home Value $500,000 to $999,999 3.3% 3.6% 3.7% 3.8% 2023 Home Value $400,000 to $499,999 3.8% 4.3% 4.4% 4.7% 2023 Home Value $300,000 to $399,999 20.0% 20.6% 20.6% 20.6% 2023 Home Value $200,000 to $299,999 17.3% 17.9% 18.1% 18.4% 2023 Home Value $150,000 to $199,999 20.5% 19.8% 19.7% 19.4% 2023 Home Value $100,000 to $149,999 25.1% 24.2% 23.9% 23.4% 2023 Home Value $50,000 to $99,999 8.3% 8.0% 8.1% 8.0% 2023 Home Value $25,000 to $49,999 0.5% 0.6% 0.6% 0.7% 2023 Home Value Under $25,000 0.2% 0.2% 0.2% 0.2% 2023 Median Home Value $202,142$208,563$209,931$212,297 2023 Median Rent $737 $732 $731 $727 ©2024, Sites USA, Chandler, Arizona, 480-491-1112 Demographic Source: Applied Geographic Solutions 11/2023, TIGER Geography - RF1 This report was produced using data from private and government sources deemed to be reliable. The information herein is provided without representation or warranty. page 2 of 3
2010-2020 Census, 2023 Estimates with 2028 Projections
Calculated using Weighted Block Centroid from Block Groups
Profile
Full
Lat/Lon: 45.8125/-120.8119 628 E Simcoe Dr 3 min drive time 5 min drive time 7 min drive time 10 min drive time Goldendale, WA 98620 Labor Force 2023 Est. Labor Population Age 16 Years or Over 3,319 3,654 3,738 3,885 2023 Est. Civilian Employed 45.6% 45.2% 45.0% 44.7% 2023 Est. Civilian Unemployed 4.3% 4.1% 4.0% 3.9% 2023 Est. in Armed Forces - - -2023 Est. not in Labor Force 50.1% 50.7% 51.0% 51.4% 2023 Labor Force Males 47.7% 47.8% 47.9% 48.0% 2023 Labor Force Females 52.3% 52.2% 52.1% 52.0% Occupation 2023 Occupation: Population Age 16 Years or Over 1,512 1,651 1,681 1,736 2023 Mgmt, Business, & Financial Operations 9.0% 9.2% 9.1% 9.1% 2023 Professional, Related 24.9% 24.8% 24.8% 24.7% 2023 Service 19.2% 19.3% 19.3% 19.4% 2023 Sales, Office 19.9% 20.2% 20.3% 20.5% 2023 Farming, Fishing, Forestry 0.5% 0.6% 0.6% 0.7% 2023 Construction, Extraction, Maintenance 11.9% 11.9% 11.9% 11.9% 2023 Production, Transport, Material Moving 14.5% 14.0% 13.9% 13.7% 2023 White Collar Workers 53.9% 54.3% 54.3% 54.3% 2023 Blue Collar Workers 46.1% 45.7% 45.7% 45.7% Transportation to Work 2023 Drive to Work Alone 84.1% 84.2% 84.1% 83.9% 2023 Drive to Work in Carpool 3.8% 3.5% 3.5% 3.4% 2023 Travel to Work by Public Transportation 0.2% 0.2% 0.2% 0.2% 2023 Drive to Work on Motorcycle - - -2023 Walk or Bicycle to Work 7.1% 6.6% 6.6% 6.4% 2023 Other Means 0.3% 0.3% 0.3% 0.3% 2023 Work at Home 4.6% 5.2% 5.4% 5.8% Travel Time 2023 Travel to Work in 14 Minutes or Less 51.2% 51.9% 51.8% 51.5% 2023 Travel to Work in 15 to 29 Minutes 25.5% 24.4% 24.3% 24.2% 2023 Travel to Work in 30 to 59 Minutes 15.6% 15.3% 15.4% 15.4% 2023 Travel to Work in 60 Minutes or More 7.8% 8.4% 8.5% 8.8% 2023 Average Travel Time to Work 12.1 12.2 12.3 12.5 Consumer Expenditure 2023 Est. Total Household Expenditure $101.96 M$111.19 M$113.54 M$117.64 M 2023 Est. Apparel $3.57 M$3.89 M$3.97 M$4.11 M 2023 Est. Contributions, Gifts $5.99 M $6.5 M$6.63 M$6.86 M 2023 Est. Education, Reading $3.36 M$3.63 M $3.7 M$3.82 M 2023 Est. Entertainment $5.72 M$6.24 M$6.37 M $6.6 M 2023 Est. Food, Beverages, Tobacco $15.61 M$17.04 M$17.4 M$18.03 M 2023 Est. Furnishings, Equipment $3.54 M$3.86 M$3.95 M$4.09 M 2023 Est. Health Care, Insurance $9.45 M$10.32 M$10.55 M$10.93 M 2023 Est. Household Operations, Shelter, Utilities $33.23 M$36.23 M $37 M$38.33 M 2023 Est. Miscellaneous Expenses $1.94 M$2.12 M$2.16 M$2.24 M 2023 Est. Personal Care $1.36 M$1.49 M$1.52 M$1.57 M 2023 Est. Transportation $18.19 M$19.87 M$20.3 M$21.05 M ©2024, Sites USA, Chandler, Arizona, 480-491-1112 Demographic Source: Applied Geographic Solutions 11/2023, TIGER Geography - RF1 This report was produced using data from private and government sources deemed to be reliable. The information herein is provided without representation or warranty. page 3 of 3