Research Paper
Chemistry
E-ISSN No : 2454-9916 | Volume : 4 | Issue : 4 | April 2018
IMPLEMENTATION OF GUIDED INQUIRY WORKSHEET ON THE TOPIC OF ATOMIC STRUCTURE QUANTUM MECHANICS ON GRADE X Ade Sazaliana Chemistry Education, Universitas Pendidikan Indonesia, Bandung, Indonesia – 40154. ABSTRACT Students are required personally to be more active through observing, questioning, collecting data, associating and communicating in the 2013 curriculum. One of the learning model that implements the curriculum 2013 is guided inquiry learning model. Guided inquiry learning model is a model student-centered learning, students work in small groups with individual role to ensure that all students are fully engaged in the learning process. To support the implementation of guided inquiry learning model implemented in small groups, the use of guided inquiry worksheet. Guided inquiry worksheet is made based on guided inquiry learning cycle consisting of five stages of orientation, exploration, concept formation, applications and closing. This research is experimental research, the design Randomized Control Group Posttest Only Design. The study sample consisted of two classes, experimental classes and control classes were obtained through simple random sampling technique. Based on the test results obtained by the average value of the experimental class (58.39) was higher than the control class (48.71). Results of tests of normality and homogeneity of the final test results obtained that both classes normally distributed and homogeneous samples. Data analysis was performed using t-test at the 0.05 significance level obtained tcount = 5.12 and ttable = 1.67. Based on the analysis shows that the learning outcomes of students who use guided inquiry worksheet is significantly higher than the learning outcomes of students who use general worksheet on the topic of atomic structure quantum mechanics on grade X. KEYWORDS: guided inquiry worksheet, learning model, learning outcomes. INTRODUCTION: Students are required to be more personally active through observing, questioning, collecting data, associating and communicating in the 2013 curriculum. There are several important changes in the curriculum of 2013, 1) teachercentered learning become student-centered learning, 2) one-way teaching (teacher-student interaction) into interactive learning, 3) passive learning into active-looking learning (inquiry learning)4. One of the learning models that implements the 2013 curriculum is the guided inquiry learning model. The guided inquiry learning model is a student-centered learning model, students work in small groups with individual roles to ensure that all students are fully engaged in the learning process7. To support the implementation of guided inquiry learning model that is implemented in small groups then used the guided inquiry worksheet. Guided inquiry worksheet is made based on guided inquiry learning cycle consisting of five stages, orientation, exploration, concept formation, application and closing2. These five stages are in line with the demands of the 2013 curriculum, where the five stages contain observation, questioning, data collection, association and communicating activities demanded in the 2013 curriculum. The topic of worksheet used in this research is atomic structure quantum mechanics based on guided inquiry. The worksheet has been feasibility test, that is validity test with validity value equal to 0,795 with high validity category and practice test with value 0,95 from teacher and 0,88 from student with very high practice category8. The atomic structure of quantum mechanics is one of the topic on grade X. The worksheet that used in this study has also never been tested. MATERIALS AND METHODS: This study is experimental research that conduct treatment (manipulation) to the research variable (independent variable). Then, observe the consequences of the treatment on the research object (dependent variable)5. The design of experimental research is Randomized Control-Group Posstest Only Desaign. The population of this study is all students on grade X. The sample in this study consists of two classes, experimental class and control class. Sampling was done by simple random sampling technique.
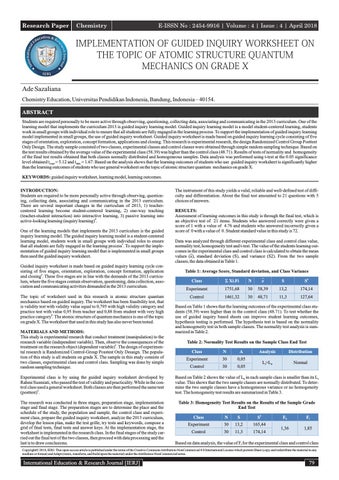
The instrument of this study yields a valid, reliable and well-defined test of difficulty and differentiation. About the final test amounted to 21 questions with 5 choices of answers. RESULTS: Assessment of learning outcomes in this study is through the final test, which is an objective test of 21 items. Students who answered correctly were given a score of 1 with a value of 4.76 and students who answered incorrectly given a score of 0 with a value of 0. Student standard value in this study is 72. Data was analyzed through different experimental class and control class value, normality test, homogeneity test and t-test. The value of the students learning outcomes in the experimental class and control class is calculated to obtain the mean values (x), standard deviation (S), and variance (S2). From the two sample classes, the data obtained in Table 1. Table 1: Average Score, Standard deviation, and Class Variance Class
Σ Xi.Fi
N
x
S
S2
Experiment
1751,68
30
58,39
13,2
174,14
Control
1461,32
30
48,71
11,3
127,64
Based on Table 1 shows that the learning outcomes of the experimental class students (58.39) were higher than in the control class (48.71). To test whether the use of guided inquiry based sheets can improve student learning outcomes, hypothesis testing is performed. The hypothesis test is based on the normality and homogeneity test in both sample classes. The normality test analysis is summarized in Table 2. Table 2: Normality Test Results on the Sample Class End Test Class
N
A
Experiment
30
0,05
Control
30
0,05
Analysis
Distribution
Lt>L0
Normal
Experimental class is by using the guided inquiry worksheet developed by Rahmi Susmiati, who passed the test of validity and practicality. While in the control class used a general worksheet. Both classes are then performed the same test (posttest)5.
Based on Table 2 shows the value of L0 in each sample class is smaller than its Lt value. This shows that the two sample classes are normally distributed. To determine the two sample classes have a homogeneous variance or no homogeneity test. The homogeneity test results are summarized in Table 3.
The research was conducted in three stages, preparation stage, implementation stage and final stage. The preparation stages are to determine the place and the schedule of the study, the population and sample, the control class and experiment class, prepare the guided inquiry worksheet, analyze the 2013 curriculum, develop the lesson plan, make the test grille, try tests and keywords, compose a grid of final tests, final tests and answer keys. At the implementation stage, the worksheet is implemented in the research class. In the final stages of the study carried out the final test of the two classes, then proceed with data processing and the last is to draw conclusions.
Table 3: Homogeneity Test Results on the Results of the Sample Grade End Test Class
N
S
S2
Experiment
30
13,2
165,44
Control
30
11,3
174,14
Fh
Ft
1,36
1,85
Based on data analysis, the value of Ft for the experimental class and control class
Copyright© 2018, IERJ. This open-access article is published under the terms of the Creative Commons Attribution-NonCommercial 4.0 International License which permits Share (copy and redistribute the material in any medium or format) and Adapt (remix, transform, and build upon the material) under the Attribution-NonCommercial terms.
International Education & Research Journal [IERJ]
79