Research Paper
Engineering
E-ISSN No : 2454-9916 | Volume : 4 | Issue : 3 | March 2018
STUDY OF MOISTURE CONTENT ELIMINATION IN POLYPROPYLENE BLOOD BAG MANUFACTURING 1
2
K Rohit Raj | Varma Deviprasad | T Mathavraj Ravikumar
3
1
Assistant Professor, Department of Mechanical Engineering, Vidya Academy of Science and Technology-Technical Campus, Trivandrum, Kerala, India- 695602. 2 Head of Department, Department of Mechanical Engineering, Mar Athanasius College of Engineering, Ernakulam, Kerala, India – 686666. 3 Head of Department, Department of Mechanical Engineering, Vidya Academy of Science and Technology-Technical Campus, Trivandrum, Kerala, India- 695602. ABSTRACT Nowadays blood bag manufacturing industries are facing a problem in the drying process during the manufacture of blood bags. The drying process is meant to vaporize all the moisture content in the primary packing of the product to make it more sterile. But more than 30% of the blood bags are being rejected by the QA department due to the presence of moisture in the packing even after drying for about 6-8 hours. The presence of water droplets in the packing increases the chance for bacterial and fungal growth. The study was conducted for finding out the main causes for moisture retention in blood bag primary packing. Feasible remedial measures are suggested after analyzing the causes and effects. This will result in better productivity and enhanced quality control in surgical blood bag manufacture. KEYWORDS: Anti-coagulant, Autoclaving, Condensation, Moisture, Drying Chamber, Root cause analysis. INTRODUCTION: Operations involved in the manufacturing process of sterile Blood Bag for pharmaceutical applications are, Plastic processing, Assembly, Pharmacy, Autoclaving and Packing The confirming product should be transparent and virtually colourless. It should be flexible and sterile, non-pyrogenic and free from toxicity. The product should be non-frangible and clinically compatible. It should be physically, chemically and biologically stable and penetration of micro-organisms must be arrested. The physical requirements include sterilization, transparency and colourlessness. The temperature withstanding capacity should be at 800 C for 24 hrs with subsequent immersion in water at 500 C for 20 minutes. There should not be more than 2% loss of water content on storage for six weeks. It should be resistant to leakage. The bag should withstand an acceleration of 5000g for 30 min at 4 deg C -37 deg C. The label should be as prescribed. MATERIALS AND METHODS: After the manufacturing the bags will be filled with anti-coagulant chemical. Then the bags are kept for sterilization for 6hrs using pure steam for boilers. During this process steam enters the primary packing which is of poly propylene material. As a result of this steam sterilization water droplets will be formed inside the walls of the primary packing. This will cause the growth of microbes and bacterial colonisation inside the packing which will lead to health problems and rejection of blood bags. So to remove the presence of moisture content of packing the blood bags are kept for drying in drying chamber for 10-16 hours. The main objective of drying is to remove all moisture content in the packing but in some cases even after 16hours the presence of moisture is observed which leads to the rejection of the blood bag and as a result those bags will be kept for redrying. This appearance of moisture will the smooth product flow and efficiency of the plant.
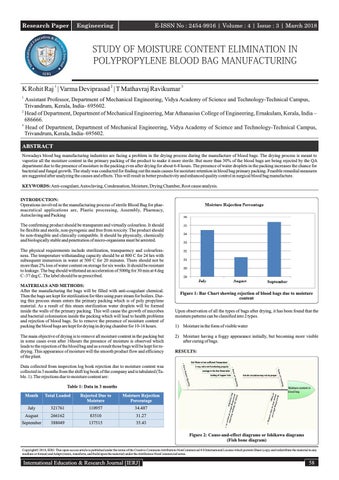
Figure 1: Bar Chart showing rejection of blood bags due to moisture content Upon observation of all the types of bags after drying, it has been found that the moisture patterns can be classified into 2 types. 1) Moisture in the form of visible water 2) Moisture having a foggy appearance initially, but becoming more visible after curing of bags. RESULTS:
Data collected from inspection log book rejection due to moisture content was collected in 3 months from the shift log book of the company and is tabulated (Table. 1). The rejections due to moisture content are: Table 1: Data in 3 months Month
Total Loaded
Rejected Due to Moisture
Moisture Rejection Percentage
July
321761
110957
34.487
August
266162
83510
31.27
September
388049
137515
35.43 Figure 2: Cause-and-effect diagrams or Ishikawa diagrams (Fish bone diagram)
CopyrightŠ 2018, IERJ. This open-access article is published under the terms of the Creative Commons Attribution-NonCommercial 4.0 International License which permits Share (copy and redistribute the material in any medium or format) and Adapt (remix, transform, and build upon the material) under the Attribution-NonCommercial terms.
International Education & Research Journal [IERJ]
58