Education
Research Paper
E-ISSN No : 2454-9916 | Volume : 4 | Issue : 5 | May 2018
A STUDY ON IMPACT OF SOCIAL MEDIA AMONG COLLEGE STUDENTS 1
Shakira Begum S | Dr. P. C. Naga subramani 1 2
2
Research Scholar Associate Professor, Tamilnadu University, Karapakkam Chennai, India.
ABSTRACT This study examined the Impact of social media among college students. The sample was 888 college students selected from Chennai district, Tamil Nadu, India. Stratified random sampling method was adapted to select the sample for the present study. Scale for accessing Attitude towards using Social media Scale (ASMS) by P.C.Nagasubramani. Data collected were analyzed using t- test and regression were implied between attitude towards using social media and demographic variables such as gender, Residence, locality of home, subject group, type of family, internet users and nature of Institution. KEYWORDS: Attitude, social media, content marketing. INTRODUCTION: Social Media - Impact On Students: Adolescent frequently engage in various forms of social media to enhance their communication, social connection & technical skills. Educator nowadays must sharpen their skills to teach effectively by revaluating the techniques. Teachers should focus on students dwindling attention spans & social media usage. As said by Marshall McLuhan, a philosopher of communication theory, “The new electronic independence re-creates the world in the image of a global village”. In today's world, there is heavy reliance on social media requiring everyone to have some what of on online presence. Social media could impact students selfesteem with the students actively engaged in online communities, social media is here to study. With easy accessibility of information on social media specifically and the web in general there is a reduced focus on learning and retaining information by students. Their ability to concentrate on the task at hand is significantly reduced by distractions on social media. Students who spend a great deal of their time on social networking sites show laxity in their studies and lack social skills. There is always a positive side to every aspect. There has been an increased collaboration among students which helps them learn how to work well in groups speed and dexterity in the world of social media has made students gain skills that has become an integral part of developing a career and their future. Facebook Twitter, Instagram, blogs. Social media is thus an important tool that teachers can use in their classroom to make it more relevant, engaging and culturally diverse to enhance the students learning process.
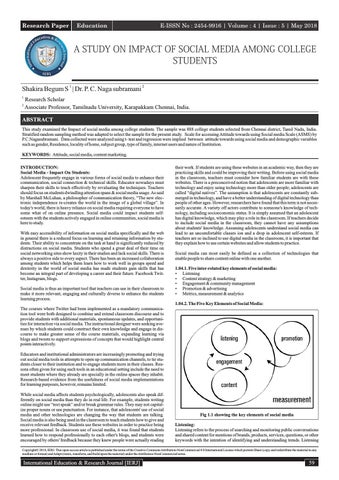
their work. If students are using these websites in an academic way, then they are practicing skills and could be improving their writing. Before using social media in the classroom, teachers must consider how familiar students are with these websites. There is a preconceived notion that adolescents are more familiar with technology and enjoy using technology more than older people; adolescents are called “digital natives”. The assumption is that adolescents are constantly submerged in technology, and have a better understanding of digital technology than people of other ages. However, researchers have found that this term is not necessarily accurate. A variety off actors contribute to someone's knowledge of technology, including socioeconomic status. It is simply assumed that an adolescent has digital knowledge, which may play a role in the classroom. If teachers decide to include social media in the classroom, they cannot have any assumptions about students' knowledge. Assuming adolescents understand social media can lead to an uncomfortable classes ion and a drop in adolescent self-esteem. If teachers are so inclined to use digital media in the classroom, it is important that they explain how to use certain websites and allow students to practice. Social media can most easily be defined as a collection of technologies that enable people to share content online with one another. 1.04.1. Five inter-related key elements of social media: Listening Content strategy & marketing Engagement & community management Promotion & advertising Metrics, measurement & analytics
Ÿ Ÿ Ÿ Ÿ Ÿ
1.04.2. The Five Key Elements of Social Media: The courses where Twitter had been implemented as a mandatory communication tool were both designed to combine and extend classroom discourse and to provide students with additional materials, spontaneous updates, and opportunities for interaction via social media. The instructional designer were seeking avenues by which students could construct their own knowledge and engage in discourse to make greater sense of the course materials, expanding learning via blogs and tweets to support expressions of concepts that would highlight central points interactively. Educators and institutional administrators are increasingly promoting and trying out social media tools in attempts to open up communication channels, to tie students closer to their institution and to engage students more in their classes. Reasons often given for using such tools in an educational setting include the need to meet students where they already are specially in the online spaces they inhabit. Research-based evidence from the usefulness of social media implementations for learning purposes, however, remains limited. While social media affects students psychologically, adolescents also speak differently on social media than they do in real life. For example, students writing online might use “text speak” and/or break grammar rules. They may not capitalize proper nouns or use punctuation. For instance, that adolescents' use of social media and other technologies are changing the way that students are talking. Social media is also being used in the classroom to teach students how to give and receive relevant feedback. Students use these websites in order to practice being more professional. In classroom use of social media, it was found that students learned how to respond professionally to each other's blogs, and students were encouraged by others' feedback because they knew people were actually reading
Fig 1.1 showing the key elements of social media Listening: Listening refers to the process of searching and monitoring public conversations and shared content for mentions of brands, products, services, questions, or other keywords with the intention of identifying and understanding trends. Listening
Copyright© 2018, IERJ. This open-access article is published under the terms of the Creative Commons Attribution-NonCommercial 4.0 International License which permits Share (copy and redistribute the material in any medium or format) and Adapt (remix, transform, and build upon the material) under the Attribution-NonCommercial terms.
International Education & Research Journal [IERJ]
59
Research Paper
E-ISSN No : 2454-9916 | Volume : 4 | Issue : 5 | May 2018
can also be done manually by examining the news feeds of various sites or individuals to uncover valuable intelligence based on what they share. Content Marketing Content marketing is the use of media, such as written text, pictures, videos, slideshows and more, to earn attention and traffic with the intent to position a company or individual as knowledgeable and trusted, and to generate new prospects and customers. Content marketing is most successful when focused on providing valuable information to the target audience. Engagement Engagement is the process of directly connecting with another individual, and using a mixture of listening, content marketing and conversation skills to build trust and loyalty by solving problems and providing values. Promotion & Advertising Promotion and Advertising are two interrelated activities that cover the use of any paid method used to generate awareness about a product, service, website or marketplace. Promotion can involve offline activities such as business cards or posters, or online activities such as display advertisements, social media promoted posts. Measurement & Analytics Measurement and analytics covers all activities related to the capture and analysis of data. This can include user demographic or interest data, website traffic and behavior, interactions and impressions for advertisements, and any other activity that generates data. Measurement and analytics should be applied to all of the other four components of social media in order to understand and improve the effectiveness of each activity. Attitude towards Social Media: Researchers around the world have been fascinated by social media and its effects on adolescents. However, researchers are not just concerned with the correlation between students' writing and their social media usage; they are concerned with social media's effects on students behavior, attitudes, self-esteem and relationships. Some researchers say social media raises adolescents' selfesteem, while other claim that this social media is diminishing their self-esteem. Adolescents are suffering from emotional distress such as "Facebook Depression" and cyber bullying. On the other hand, some researchers claim that because adolescents receive "likes" and positive feedback from their peers on these websites, social media can be a positive tool. Social media allows students to relieve stress. Surprisingly instant messaging made some adolescents feel a sense of belonging and emotional relief. Adolescents are using these websites for "emotional relief," this might cause them to be more expressive. Adolescence is a time of great change, especially emotionally develops inner turmoil can affect his/her academically. These adolescents want to appear intelligent and do not want their friends to lose trust in them, so they are cautious of spelling when typing to their friends. Adolescents' attitudes may continue to shift as social media develops. It is possible that students' casual attitudes towards writing online may turn into more relaxed attitudes towards writing in general. A variety of factors contribute to someone's knowledge of technology, including socioeconomic status. For instance, if an adolescent does not have the means to purchase and practice using new technology, he/she might not be comfortable using it in the classroom. Also, some teenagers may simply shriek from new technology. Therefore, it is unfair to simply assume an adolescent has digital knowledge, which may play a role in the classroom. If teachers decide to include social media in the classroom, they cannot have any assumptions about students' knowledge. We are assuming that adolescents understand social media can lead to an uncomfortable class session and a drop in adolescent self-esteem. If teachers are asking students to participate in websites they are uncomfortable with, students will not be as inclined to learn. If teachers are so inclined to use digital media in the classroom, it is important that they explain how to use certain websites and allow students to practice. OBJECTIVE: 1. To find out whether there is any significant difference between the attitude towards using Social media of college students based on the background variables; namely a. Gender b. Residence c. Locality of home d. Subject group e. Type of family f. Internet Users g. Nature of Institution HYPOTHESES: 1. There is no significant difference between the attitude towards using Social media of college students based on the background variables; namely
60
a. Gender b. Residence c. Locality of home d. Subject group e. Type of family f. Internet Users g. Nature of Institution METHODOLOGY: Procedure: This study implemented survey method the self reported questionnaires were used to collected the data for two variables of the study along with the personal data sheet. The selected college students of (N=900) were given the standardized questionnaire under personal supervision. In spite of supervision it was found that some questionnaires were partially responded and hence only 888 were considered for the analysis. Sample: Random sampling technique was used to the sample; the sample was collected from about 888 college students studying in the colleges in Chennai district, Tamil Nadu, India. There are about 1464 colleges which include Arts and Science colleges, Physical education colleges, Oriental colleges, Schools of Social work, and Colleges of Education are functioning under the administrative control of the Directorate of Collegiate Education. The number of college students studying in Government, Government aided and Self-Finance College, arts and science colleges in Chennai District is approximately about 86,500 . By using the Stratified Random Sampling Technique, I have only about selected only 888 Students from about10 Colleges from Chennai, Tamil Nadu. Tools: Attitude towards using Social media Scale (ASMS) by P.C.Nagasubramani: The investigator felt that very scanty tool was only available to study the Attitude towards using Social media. To conductintensive study, the investigator decided to construct and standardized scale, to measure the Attitude of the college students towards using Social media. The scaleconsists of 49 items in each statement five point scale ranging from “Strongly Agree”, “Agree”, “Undecided”, “Disagree”, “Strongly Disagree” is used. The different points on the scale are assigned arbitrary weights, for example 5, 4, 3, 2, and 1 in the order of “Strongly Agree” response to “Strongly Disagree” response for the positive statements. The scoring scheme is reversed for the negative statements. Here the “Strongly Disagree” response is given the weight of 5 and the “Strongly Agree” response is given the weight of 1. An individual score is the sum of all the score of the 45 items. The maximum score that one can get in this is 225. Higher score indicating the presence of high level of Attitude towards using Social media. RESULTS AND DISCUSSIONS: Table 1: Showing the Mean, SD and t-value for attitude towards social media of the college students on the basis of gender Gender
N
Mean
SD
Male
452
154.26
11.36
Female
436
155.45
11.87
't' Value
Level of significance
S / NS
0.64
0.05
NS
S - Significant, NS - Not Significant The details of the calculations are given in Table . The 't' value is found to be 0.64 which is lesser than the table value (1.96) and not significant at 0.05 level. Therefore, the null hypothesis is accepted and it is concluded that there is no significant difference between the male and female college students in terms of their attitude towards using Social media. Hypothesis (6-b) “There is no significant difference in the attitude towards using Social media between the hosteller and day scholar college students”. Table 2: t – Test values for the attitude towards using social media scores of the hosteller and day scholar college students SubSamples
N
Mean
SD
Hosteller
399
152.26
11.24
Day scholar
489
152.85
11.57
't' Value
Level of significance
S / NS
0.42
0.05
NS
S - Significant, NS - Not Significant The details of the calculations are given in Table 4.22. The 't' value is found to be 0.42 which is lesser than the table value (1.96) and significant at 0.05 level. Therefore, the null hypothesis is accepted and it is concluded that there is no significant difference between the hosteller and day scholar college students in terms of their attitude towards using Social media. Hypothesis (6-c) “There is no significant difference in the attitude towards using Social media
International Education & Research Journal [IERJ]
Research Paper
E-ISSN No : 2454-9916 | Volume : 4 | Issue : 5 | May 2018 a. Government and Aided b. Government and Self-finance c. Aided and Self-finance
between the rural and urban area college students”. Table 3: t – test values for the attitude towards using social mediascores of the rural and urban area college students SubSamples
N
Mean
SD
't' Value
Level of significance
S / NS
Rural
426
154.64
10.86
1.02
0.05
NS
Urban
462
153.94
10.98
Table 7: t – test values for the attitude towards using social mediascores of the college students in different type of institution Sub- samples
N
Mean
SD
't' Value
Level of Significance
S / NS
Government Aided
136 290
155.21 155.46
11.42 11.47
0.29
0.05
NS
Government
136
155.21
11.42
Self finance
462
155.85
11.54
0.32
0.05
NS
Aided
290
155.46
11.47
Self finance
462
155.85
11.54
0.43
0.05
NS
S - Significant, NS - Not Significant The details of the calculations are given in Table 4.23. The 't' value is found to be 1.02 which is lesser than the table value (1.96) and not significant at 0.05 level. Therefore, the null hypothesis is accepted and it is concluded that there is no significant difference between the rural and urban area college students in térms of their attitude towards using Social media. Hypothesis (6-d) “There is no significant difference in the attitude towards using Social media between the arts and science group students”. Table 4: t – test values for the attitude towards using social media scores of the arts and science group students SubSamples
N
Mean
SD
Arts
395
158.68
11.75
Science
493
159.73
12.43
't' Value
Level of significance
S / NS
0.98
0.05
NS
S - Significant, NS - Not Significant The details of the calculations are given in Table 4.24. The 't' value is found to be 0.98 which is lesser than the table value (1.96) and not significant at 0.05 level. Therefore, the null hypothesis is accepted and it is concluded that there is no significant difference between the arts and science group students in terms of their attitude towards using Social media.
S - Significant, NS - Not Significant The details of the calculations are given in Table 4.27. In respect of Government and Aided college students ('t' value = 0.29), in respect of Government and Selffinance college students ('t' value = 0.32) and in respect of Aided and Self finance college students ('t' value = 0.43) the 't' values are not significant at 0.05 level. Therefore, the null hypotheses concerning (a), (b) and (c) are accepted. It is concluded that there is no significant difference between the Government and Aided, Government and Self finance and Aided and Self - finance college students in terms of their attitude towards using Social media. Regression Result: The background variables do not contribute to the attitude towards using Social media of college students. Table 4.42: Regression co-efficient of contributing variables for attitude towards using social media
Hypothesis (6-e) “There is no significant difference in the attitude towards using Social media between the college students who belong to joint and nuclear family”. Table 5: t – test values for the attitude towards using social mediascores of the joint and nuclear family college students SubSamples Joint
N
Mean
SD
222
155.24
11.67
Nuclear
666
155.82
11.52
Level of 't' Value significance 0.36
0.05
NS
The details of the calculations are given in Table 4.25. The 't' value is found to be 0.36 which is lesser than the table value (1.96) and not significant at 0.05 level. Therefore, the null hypothesis is accepted and it is concluded that there is no significant difference between the college students who belong to joint and nuclear family in terms of their attitude towards using Social media. HYPOTHESIS (6-f) “There is no significant difference in the attitude towards using Social media between the college students who belong to internet users and non users”. Table 6: Showing the Mean, SD and t-value for attitude towards social media of the college students on the basis of Internet users. N
Mean
SD
Users
652
156.47
11.89
Non Users
236
153.52
11.67
't' Value 3.37
Constant
Level of significance
S / NS
0.05
S
51.37
1.42
-----
39.42
0.00
0.51
0.13
2.15
0.00
Subject group
-1.76
0.35
-0.14
-2.96
0.00
Internet users
2.41
0.47
0.13
4.27
0.00
Step-wise regression is performed on the background variables to find out the degree of contribution of background variables on attitude towards using Social media of college students. In the process of treatment of step-wise regression analysis it was found that only three out of seven background variables have contributed to attitude towards using Social media of college students. They are Locality of home, Subject group and Internet users. CONCLUSION: The present study showed a similar attitude towards social media pursuance among the gender(male and female), day scholar and hosteller, urban and rural area students, arts and science group students, nuclear family and joint family students as well as the govt, govt aided and self financing colleges. Out of seven (Gender, Residence, Locality of home, Subject group, Type of family, Internet Users, Nature of Institution), only three background variables have contributed to attitude towards using Social media of college students. They are Locality of home, Subject group and Internet users. REFERENCES: 1.
Abinew, A.A. & Vuda, S. (2013) A case study of acceptance and use of electronic library services in universities based on SO-UTAUT model. International Journal of Innovative Research in Computer and Communication Engineering, 1(4), 903-910. Retrieved from: http://ijircce.com/upload/2013/june/17_A%20Case%20Study.pdf
2.
Egberongbe, H.S. (2011) The use and impact of electronic resources at the University of Lagos. Library Philosophy and Practice. Retrieved from: http://www.webpages.uidaho.edu/~mbolin/egberongbe.htm
3.
Johnson S, Evensen O. G, Gelfand J, Lammers G, Sipe, L. & Zilper, N. (2012) Key issues for e-resource collection development; A guide for libraries. International Federation of Library Associations and Institutions. http://www.ifla.org/files/assets/acquisitioncollectiondevelopment/publications/IFLA _ELECTRONIC_RESOURCE_GUIDE_DRAFT%20F OR%20COMMENT.pdf.
4.
Jones, P. H. (2008) Turning the page: Learning about the future of electronic books from students today. Toronto: University of Toronto Libraries, 38.
5.
Thanuskodi, S. (2012) Use of e-resources by the students and researchers of faculty of Arts, Annamalai University. Retrieved from: http://article.sapub.org/10.5923.j.library.20120101.01.html
6.
Abrams, K. R. (2015), Electronic Resource Management and Design, Journal of Electronic Resources Librarianship, 27(3), 151-164.
S - Significant, NS - Not Significant The details of the calculations are given in Table 4. The 't' value is found to be 3.37 which is greater than the table value (1.96) and significant at 0.05 level. Therefore, the null hypothesis is rejected and it is concluded that there is significant difference between the college students who belong to internet users and non users in terms of their attitude towards using Social media. Moreover, the internet users (Mean = 156.47) are found to be better than their non users counter parts (Mean = 153.52) in their attitude towards using Social media. Hence College students who are using computers often will have favourable attitude towards using social media. Hypothesis (6-g) “There is no significant difference in the attitude towards using Social media between the college students studying in different type of management,
International Education & Research Journal [IERJ]
Un standardized Standardized Co-efficient Co-efficient t - value Significant level D Std. error Beta
Locality of home 1.29
S / NS
S - Significant, NS - Not Significant
Internet users
Model
61
Research Paper
E-ISSN No : 2454-9916 | Volume : 4 | Issue : 5 | May 2018
7.
Ahluwalia, Amardeep Kaur, and Raghbir Singh (2011), "TV viewing habits amongst urban children." IUP Journal of Marketing Management 10.1 (2011): 45.
8.
Akyıldız, M., and M. Argan (2011), "Using online social networking: Students’ Purposes of Facebook usage at the university of Turkey, Academic and Business Research Institute (AABRI) Conference, LasVegas, 6-8th October." ProceedingsManagement/Marketing, LV11094 http://www.aabri. com/LV11Manuscripts /LV11094. pdf (2011).
62
International Education & Research Journal [IERJ]