Research Paper
Engineering
E-ISSN No : 2454-9916 | Volume : 4 | Issue : 3 | March 2018
SMART POLLUTION MONITORING SYSTEM
1
1
1
Nikita Soni | Perin Shah | Parth Rawal | Prof. Sridhar Iyer 1 2
2
Student, Computer, Universal College of Engineering, Mumbai, India-401212. Assistant Professor, Computer, Universal College of Engineering, Mumbai, India-401212.
ABSTRACT The rapid growth in industrial plants creating environmental concerns like weather change, pollution has significantly influenced the need of an efficient, cheap, and smart monitoring systems. In this, we put onward a noise monitoring as well as air quality monitoring system that allows us to detect and quickly check air as well as sound quality. The sensors conjoin with microcontroller, which processes this records and transfers over internet. This lets authorities to observe air quality in different zones and take action contrary to it. In addition, authorities can keep an eye on the noise levels near universities, infirmaries and no hooting areas. Pollution under Control (PUC) deeds as a measure to handle pollution. Users need to register, notifications would be sent about expiry dates of PUC. Hence, the main aim of project is to develop an observation system for air pollution and sound pollution observing, warning, supervision and management. KEYWORDS: Internet of Things (IoT), Arduino UNO, Pollution Under Control (PUC), Trafficlog. I. INTRODUCTION: As modernization is increasing fast networks, wireless sensor and internet technologies are advanced.The increasing number of internet consumers and application on the internet working technologies enable networking of everyday objects requiring human-to-computer and human-to-human communication. IoT permits an exchange of information to a thing or device. Due to low charge and flexibility IoT is getting in demand every day. The motto of assemble ling a smart city is to upgrade grade of life by utilizing technology to upgrade the efficiency of services (EoS) and meet resident's requirements. Due to recent technological advances, the construction material for small and low cost sensors became technically and economically feasible. Even though, Industrialization increase the degree of automation at the same time it increases the pollution by releasing the unwanted parameters in environment especially in industrial areas. So there should be a system to monitor and assess the industrial pollution. Particular attention is given to factors which may affect human health and the health of the natural system itself. With the increasing vehicles on road and urbanization the atmospheric conditions have affected considerably. Also, there has been the growth of companies and infrastructure which has caused increase in pollution in atmosphere like air and sound pollution. The purpose of Internet of Things Sound, Air and dust System monitoring is that the Sound and Air pollution is a creating issue these days. Sound pollution and Air pollution are in major role for having harmful and bad effects on nature as well on humans. Typically, data were collected by the data loggers of the site. They had to go to the place where the site to be analyzed every time they wanted the data. This was a consuming too much time and was an expensive task. The data can be fetched from remote site without visiting the place due the internet. Monitoring gives computation of noise, dust and air pollution concentrations, which can then be examined, presented and interpreted. This paper aims to implement and plan an efficient system through which data are remotely monitored and gathered using internet and from the sensors and are stored in the cloud. II. LITERATURE SURVEY: Some of the research works were carried out for monitoring the pollution parameters in a particular area of interest for making the environment smart in that area, and different techniques and methods which were used in the past. Project which we will monitor the Air Quality over a web server using internet and will trigger a alarm when the air quality goes down beyond a certain level, means when there are sufficient amount of harmful gases are present in the air like CO2, smoke, alcohol, benzene and NH3.In this work they mainly focus on the making the city environment smart, by deploying wireless sensor networks in all over the city and moving public transportation system buses and cars. This methodology gives the monitoring data from stationary nodes deployed in city to the mobile nodes on public transportation buses and cars. A methodology is also implemented which uses Zigbee as a hardware. But the range of Zigbee is limited only upto a range of 10-100 meters. Also, a methodology is used which is 4-tired structured. In this project a solution for monitoring air and sound pollution level in industrial environment or particular area of interest using wireless embedded computing system is proposed. Here sensing devices are connected to the embedded computing system to monitor the fluctuation of parameters like noise an air pollution levels from their normal levels. In these proposed work, system uses air sensors to percept the presence of harmful gases or compounds in the air and constantly transmit this data. Also, system keeps measuring sound level and reports it. The sensors interact with raspberry pi which processes this data and
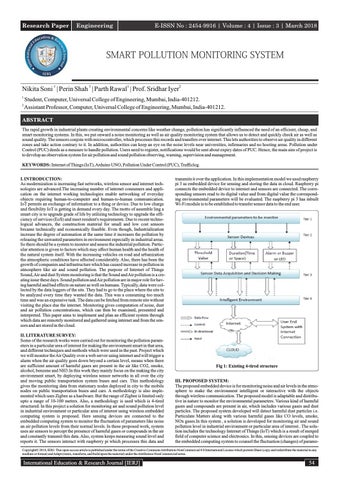
transmits it over the application. In this implementation model we used raspberry pi 3 as embedded device for sensing and storing the data in cloud. Raspberry pi connects the embedded device to internet and sensors are connected. The corresponding sensors read to its digital value and from digital value the corresponding environmental parameters will be evaluated. The raspberry pi 3 has inbuilt Wi-Fi module is to be established to transfer sensor data to the end user.
Fig 1: Existing 4-tired structure III. PROPOSED SYSTEM: The proposed embedded device is for monitoring noise and air levels in the atmosphere to make the environment intelligent or interactive with the objects through wireless communication. The proposed model is adaptable and distributive in nature to monitor the environmental parameters. Various kind of harmful gases and compounds are present in air, which includes various gases and dust particles. The proposed system developed will detect harmful dust particles i.e. Particulate Matters along with various harmful gases like CO levels, smoke, NOx gases.In this system , a solution is developed for monitoring air and sound pollution level in industrial environment or particular area of interest.. The solution includes the technology Internet of Things (IoT) which is a result of merged field of computer science and electronics. In this, sensing devices are coupled to the embedded computing system to counsel the fluctuation (changes) of parame-
CopyrightŠ 2018, IERJ. This open-access article is published under the terms of the Creative Commons Attribution-NonCommercial 4.0 International License which permits Share (copy and redistribute the material in any medium or format) and Adapt (remix, transform, and build upon the material) under the Attribution-NonCommercial terms.
International Education & Research Journal [IERJ]
54
Research Paper
E-ISSN No : 2454-9916 | Volume : 4 | Issue : 3 | March 2018
ters like noise and air pollution levels from their normal levels. This system is adaptable and distributive for any environment that needs continuous monitoring, controlling and behavior analysis. The end users can browse the data using mobile phones, PCs etc.
IV. IMPLEMENTATION PIN CONFIGURATION Mega has 3 additional serial ports – Serial 1 on pins nineteen (RX) and eighteen (TX), Serial 2 on pins seventeen (RX) and sixteen (TX), Serial 3 on pins fifteen (RX) and fourteen (TX). Allow these pins to be in touch with your computer, you also need to grasp an additional USB-to-serial adaptor, as they are unable to be in touch to the Mega's USB-to-serial adaptor. For using them to contact with an outsider serial device named as TTL, connect the 14 pin to your device's 15 pin, the 15 to your device's 14 pin and connect the ground of your Mega to ground of your device. Don't connect these pins directly to serial port of RS232. Also note that if voltage extended more than 12 it can damage your Arduino. 2. The Arduino Due has 3 3.3V serial ports of TTL: Serial 1 which is on pins nineteen (19) (RX) & eighteen(18) (TX); Serial 2 which is on pins seventeen(17) (RX) and sixteen(16) (TX), Serial 3 which is on pins fifteen (RX) and fourteen(TX). Pins 0 & 1 contact to the pins of the serial chip name as ATmega16U2 USB-to-TTL, which is in touch to the debug port of the USB. Including these, it also has a USB-serial port on the chip SAM3X called as serial USB. The board Arduino Leonardo utilizes Serial1 to be in touch through TTL serial on pins named as 0 (RX) & 1 (TX). Note that Serial is restrained for USB CDC communication. The Arduino UNO Contains: A) ON BOARD 1) 1.0 pin out: Added SDA and SCL pins that are close to the AREF pin and two other new pins placed near the RESET pin, the IOREF that allow the shields to adapt to the voltage provided from the board. In future, shields will be compatible with both the board that uses the AVR, which operates with 5V and with the Arduino Due that operates with 3.3V. The second one is a not connected pin, that is reserved for future purposes.
Fig 2: Flowchart of proposed system
Fig 2.1: Flowchart of PUC reminder
55
B) Input and Output: Each of the 14 digital pins on the Uno can be used as an input or output, using pinMode(), digitalWrite(), and digitalRead() functions. They operate at 5 volts. Each pin can provide or receive a maximum of 40mA and has an Internal pull-up resistor (disconnected by default) of 20-50k Ohms. In addition, some pins have specialized functions. 1.
Serial: 0 (RX) and 1 (TX) used to receive (RX) and transmit (TX) TTL serial data. These pins are connected to the corresponding pins of the ATmega8U2 USB-to-TTL Serial chip.
2.
External Interrupts: 2 and 3. These pins can be configured to trigger an interrupt on a low value, a rising or falling edge, or a change in value. See the attachInterrupt() function for details.
3.
PWM: 3, 5, 6, 9, 10, and 11. Provide 8-bit PWM output with the analogWrite() function.
4.
SPI: 10 (SS), 11 (MOSI), 12 (MISO), 13 (SCK). These pins support SPI communication using the SPI library.
5.
LED: 13. There is a built-in LED connected to digital pin 13. When the pin is HIGH value, the LED is on, when the pin is LOW, it's off.
6.
The U'o has 6 analog inputs, labeled A0 through A5, each of which provide 10 bits of resolution (i.e. 1024 different values). By default they measure from ground to 5 volts, though is it possible to change the upper end of their range using the AREF pin and the analogReference() function. Additionally, some pins have specialized functionality:
7.
TWI: A4 or SDA pin and A5 or SCL pin. Support TWI communication using the Wire library.
8.
There are a couple of other pins on the board:
9.
AREF. Reference voltage for the analog inputs. Used with analog Reference().
10. Reset. Bring this line LOW to reset the microcontroller. Typically used to add a reset button to shields which block the one on the board.
International Education & Research Journal [IERJ]
Research Paper
E-ISSN No : 2454-9916 | Volume : 4 | Issue : 3 | March 2018
C) CIRCUIT DIAGRAM:
2) DUST SENSOR: Sensor Pin 1 Vled g 2 LED-GND g 3 LED g 4 S-GND g 5 Vo g
Arduino Pin 5V (150 ohm resistor) GND Digital pin 2 GND Analog pin 0 6 Vcc –> 5V
3) Wi-Fi module- ESP8266: A Wi-Fi adapter, wireless internet access can be added to any micro controller based design with simple connectivity (SPI/SDIO or I2C/UART interface). V. RESULTS AND DISCUSSION: The air and sound pollution monitoring system monitors air and noise pollution using a mobile application. After connection , if it senses any gaseous particles is sends its details onto the cloud. The controller room will keep a check on the pollution of the respective areas. If the level of Air or Sound pollution goes beyond the assigned range , the alarm will start to beep and measures are thereby to be taken department. In these project we have also took a measure to control the air pollution. A application is created which keeps a check on Pollution Under Control (PUC) reminder. Every person ,using a vehicle, should register himself/herself. A PUC reminder will be sent if he/she fails to renew on time. Even after that if a user fails to renew strict actions would be taken by the RTO department. A “Trafficlog” feature is added in which any random person if witnesses any traffic in an area which doesn't have the monitoring system, can upload a picture of the application. The officers in charge will then take measures to control it.
Fig 3: Circuit Diagram Arduino circuit (Patient side) 1. Arduino UNO board is used, which is having 6 analog pins (A0-A5) and 14 digital pins (D0-D13). 2.
The analog sensors that are noise sensor, dust sensor and air sensor are connected to analog pins.
3.
D0 and D1 are Rx and Tx pins (Serial communication) connected to Wi-Fi Tx and Rx pins respectively.
Fig 4.1: Detection and Monitoring of Air and Sound Pollution
D) POWER PINS: 1. VIN: The i/p voltage to the Arduino , when it uses an outer power source (as 5 volts from the USB connection). You can supply voltage through this pin, or supply voltage through power jack, use it through this pin mentioned above. 2.
GND: This is Ground pins.
3.
IOREF: This pin on the Arduino gives the voltage reference with which the microcontroller works. A properly arranged shield can read the pin IORFF voltage & select the appropriate power supplier on the outputs for working with the five(5)V or 3.3V.
E) SENSOR PINS: 1) AIR SENSOR: The Atmega328 provides UART TTL (5V) serial communication, which is available on digital pins 0 (RX) and 1 (TX). MQ 135
Fig 4.2 : Database of Images uploaded in case of Trafficlog. VI. CONCLUSION: The Air and Sound monitoring system is a step forward to contribute a solution to the biggest threat. The air & sound monitoring system overcomes the problem of the highly-polluted areas which is a major issue. The sensor parameters are then stored to the cloud (Google Spread Sheets). This data will be further helpful for future analysis and it can be easily shared to other end users. This system helps to protect the public health from pollution; this model provides an efficient and low cost solution for continuous monitoring of environment. This system is monitoring only few gaseous parameters and hence can be expanded by considering more parameters that cause the pollution especially by the industries (which includes a check on ozone level). This system gives availability of viewing the sensor outputs through internet. It can be made to control the emissions by giving commands from distance. Many pollutants do not have sensors that sense them if available they are very expensive and hence building sensors for different parameters might be a future and very challenging task.
International Education & Research Journal [IERJ]
56
Research Paper
E-ISSN No : 2454-9916 | Volume : 4 | Issue : 3 | March 2018
REFERENCES: 1.
Palaghat Yaswanth Sai “An IoT based Automated Noise And Air pollution Monitoring System”,Volume 6,Issue 3-March 2017.
2.
Anjaiah Guthi “Implementation of an Efficient Noise and Air Pollution Monitoring System Using Internet of Things (IoT)”,Volume 5,Issue7, July 2016.
3.
L.Ezhilarasi, K.Sripriya, A .Suganya , K.Vinodhini, “A System for monitoring Air and Sound Pollution using Arduino Controller with IoT technology”,Volume 3,Issue2,March 2017.
4.
Arushi Singh, Divya Pathak, Prachi Pandit , Shruti Patil , Prof. Priti . C. Golar “IOT based Air and Sound Pollution Monitoring System”,Volume 6 ,Issue 3, March 2017.
5.
Navreetinder Kaur, Rita Mahajan, Deepak Bagai ,“Air Quality Monitoring System based on Arduino Microcontroller”, Volume 5, Issue 6, June 2016.
6.
Uppugunduru Anil Kumar , G Keerthi , G sumalatha , M. Sushma Reddy, “IOT based noise and air pollution monitoring system using Rasberry Pi”,Volume 5,Issue3,March 2017.
57
International Education & Research Journal [IERJ]