Research Paper
Nursing
E-ISSN No : 2454-9916 | Volume : 3 | Issue : 7 | July 2017
EFFECTIVENESS OF SELECTED STRESS MANAGEMENT TECHNIQUES ON COGNITIVE AND PHYSICAL SYMPTOMS OF STRESS Kasthuri S Professor, M.Sc (Nursing), Research Scholar in Nursing, Community Health Nursing Department, GITAM Institute of Nursing, GITAM University, Visakhapatnam-530045. ABSTRACT An experimental study design with the purpose to find out prevalence and compare cognitive and physical symptoms of stress among B.Sc (Nursing) students in selected nursing college at Srikakulam town, Andhra Pradesh was performed. Stress management techniques training were given to nursing students in experimental group daily for a period of 6 weeks.. The study identified that there is significant decrease in post-test cognitive symptoms of stress in experimental group like indecisiveness, inability to concentrate, poor judgment, trouble thinking clearly, seeing only negative side of the issues, anxious or racing thoughts, constant worrying, loss of objectivity, fearful anticipation that something happens (p<0.05). There is also significant decrease in post-test physical symptoms of stress in experimental group like headache, backache, muscle tension and stiffness, diarrhea, insomnia, chest pain, rapid pulse, weight loss and hair fall(p<0.05). The chi-square values for post-test cognitive symptoms for Experimental and Control groups shows statistical significance at 0.05 level of significance for inability to concentrate (9.33), trouble thinking clearly (0.03), anxious or racing thoughts (1.94) and fearful anticipation that something happens (4.48). The post-test physical symptoms chi-square values for Experimental and Control groups shows statistical significance at 0.05 level for physical symptoms like headache (20.18), backache (12.18), muscle tension and stiffness (4.63), diarrhea (4.75), constipation (6.11), dizziness (6.88), insomnia (34.18), chest pain (7.92) and rapid pulse (47.23). As there was significant decrease in cognitive and physical symptoms of stress,stress management techniques are effective. KEY WORDS: Stress Management Techniques, Cognitive Symptoms, Physical Symptoms, Stress, Effectiveness. INTRODUCTION: In India majority of students studying in nursing courses are females and belong to adolescent age groups ( Rajesh Kumar and Nancy,2011)8. As they are in adolescent age groups, they are experiencing stressors of adolescent age groups, female gender and stressors related to nursing education. Many psychosomatic symptoms of stress are prevalent. Many studies focussed on prevalence of stress symptoms. But very few studies are available related to effectiveness of stress management techniques on cognitive and physical symptoms of stress. Innes (1998) stated that migraines, colds and infections are common physical symptoms of stress, while cardiovascular disease and asthma are more serious physical illnesses caused by stress. Stress affects the mental health of an individual by causing irritation, anxiety, difficulties concentrating and in more serious cases clinical depression.4 Pratibha, P.K (2009) reported that stress affects physical health, psychological and behavioral perspectives.7 American Psychological Association (2014) stated that the most common symptoms of acute stress is manageable and treatable.1 Objectives of the study: To assess prevalence of cognitive and physical symptoms of stress
Ÿ Ÿ
To compare pre-test and post-test cognitive and physical symptoms of stress
Ÿ
To find out the effectiveness of stress management techniques on cognitive and physical symptoms of stress.
Hypothesis: H0: There is no association between pre-test and post-test cognitive and physical symptoms of stress. H1: There is significant decrease in post-test cognitive and physical symptoms of stress. METHODS AND MATERIALS: An experimental design was conducted with consent on 114 nursing students by simple, random, probability sampling technique and through lottery method the students are assigned into control group (58 students) and (56 students) into experimental group. The control group was not given any stress management program. The experimental group received Stress management training program for six weeks, daily. The Pre and post-test questionnaire is used to collect data from the students. Stress management program is included seminar on stress and its management, deep breathing exercises, progressive muscle relaxation, massage therapy, visualization, stress diary, role play, stress journal and peer group sharing. Description of the tool: Demographic data: This consists data like age, sex, state, year of study, marital status, monthly income of the family.
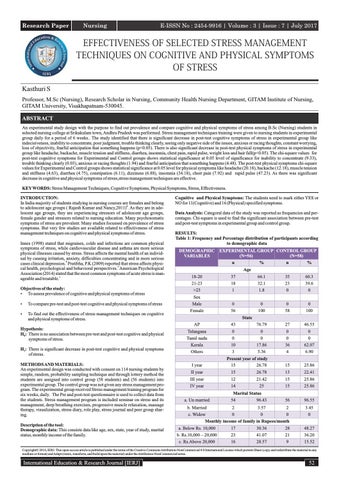
Cognitive and Physical Symptoms: The students need to mark either YES or NO for 11(Cognitive) and 16 (Physical) specified symptoms. Data Analysis: Categoral data of the study was reported as frequencies and percentages. Chi-square is used to find the significant association between pre-test and post-test symptoms in experimental group and control group. RESULTS: Table 1: Frequency and Percentage distribution of participants according to demographic data DEMOGRAPHIC EXPERIMENTAL GROUP CONTROL GROUP VARIABLES (N=58) (N=56) n
%
n
37
66.1
35
60.3
18 1
32.1 1.8
23 0
39.6 0
Male Female
0 56
0 100
0 58
0 100
AP Telangana Tamil nadu
43 0 0
76.79 0 0
27 0 0
46.55 0 0
Kerala Others
10 3
17.86 5.36
36 4
62.07 6.90
Present year of study 15 26.78
%
Age 18-20 21-23 >23 Sex
State
15
25.86
II year
15
26.78
13
22.41
III year IV year
12 14
21.42 25
15 15
25.86 25.86
a. Un married
54
96.43
56
96.55
b. Married
2
3.57
2
3.45
I year
Marital Status
0 0 c. Widow 0 Monthly income of family in Rupees/month a. Below Rs. 10,000 b. Rs.10,000 – 20,000 c. Rs.Above 20,000
17 23 16
30.36 41.07 28.57
28 21 9
0 48.27 36.20 15.52
Copyright© 2016, IERJ. This open-access article is published under the terms of the Creative Commons Attribution-NonCommercial 4.0 International License which permits Share (copy and redistribute the material in any medium or format) and Adapt (remix, transform, and build upon the material) under the Attribution-NonCommercial terms.
International Education & Research Journal [IERJ]
52
Research Paper
E-ISSN No : 2454-9916 | Volume : 3 | Issue : 7 | July 2017
Table 2: Frequency and Percentage distribution of prevalence of cognitive and physical symptoms of stress Control Group (N=58)
Experimental Group (N=56)
Pre-Test
Pre-Test
Variables n
%
n
%
Cognitive Symptoms of Stress Memory problems
39
67.2
40
71.4
Indecisiveness Inability to concentrate Poor Judgment Trouble thinking clearly Seeing only negative side of issue
12 35 26 27 15
20.7 60.3 44.8 46.6 25.9
19 42 26 34 18
33.9 75.0 46.4 60.7 32.1
Anxious or racing thoughts
29
50.0
29
51.8
Constant worrying Loss of objectivity
28 12
48.2 20.7
31 24
55.4 42.9
Fearful anticipation that something happens
32
55.2
34
60.7
0
3
5.4 83.9
Others
0 Physical Symptoms of Stress 48
82.8
47
Backache
27
46.6
33
58.9
Muscle tension and stiffness
20
34.5
28
50.0
Diarrhea Constipation Nausea
12 13 14
20.7 22.4 24.1
17 13 16
30.4 23.2 28.6
Dizziness
15
25.9
32
57.1
Insomnia
18
31.0
24
42.9
Chest pain
14
24.1
16
28.6
Rapid Pulse
26
44.8
19
33.9
Weight gain
12
20.7
8
14.3
Weight loss
20
34.5
34
60.7
Skin Breakout Frequent colds
2 18
3.4 31.0
7 25
12.5 44.6
Hair loss/loss
42
72.4
49
87.5
Others
3
5.1
4
7.2
Headache
Table 3: Comparison between pre-test and post-test Cognitive symptoms of stress in Control and Experimental groups. Control Group (N=58) Cognitive Symptoms
Memory problems Indecisiveness Inability to concentrate Poor Judgment Trouble thinking clearly Seeing only negative side of issue Anxious or racing thoughts Constant worrying Loss of objectivity Fearful anticipation that something happens Others
Pre-Test
Experimental Group (N=56)
Post-Test
% 67.2 32.8
n 35 23
% 60.3 39.7
Present Absent
n 39 19
Present
12
20.7
8
13.8
Absent
46
79.3
50
86.2
Present Absent Present
35 23 26
60.3 39.7 44.8
33 25 19
56.9 43.1 32.8
Absent
32
55.2
39
67.2
Present
27
46.6
24
41.4
Absent
31
53.4
34
58.6
Present
15
25.9
13
22.4
Absent
43
74.1
45
77.6
Present
29
50.0
34
58.6
Absent
29
50.0
24
41.4
Present
28
48.2
23
39.7
Absent
30
51.7
35
60.4
Present
12
20.7
6
10.3
Absent
46
79.3
52
89.7
Present
32
55.2
30
51.7
Absent
26
44.8
28
48.3
Present
0
0
0
0
Absent
58
100
58
100
χ2
P-value
0.59
0.43
0.97
0.32
0.14
0.70
1.78
0.18
0.32
0.57
0.19
0.66
0.87
0.35
0.88
0.34
2.37
0.12
0.14
0.70
-
-
Pre-Test n 40 16
% 71.4 28.6
Post-Test n 33 23
% 58.9 41.0
19
33.9
5
8.9
37
66.0
51
91.1
42 14 26
75.0 25.0 46.4
16 40 10
28.6 71.4 17.9
30
53.6
46
82.1
34
60.7
13
23.2
22
39.3
43
76.8
18
32.1
7
12.5
38
67.9
49
87.5
29
51.8
17
30.4
27
48.2
39
69.6
31
55.4
14
25.0
25
44.6
42
75.0
24
42.9
9
16.1
32
57.1
47
83.9
34
60.7
18
32.1
22
39.3
38
67.9
3
5.3
2
3.6
53
94.7
54
96.4
χ2
P-value
1.93
0.16
10.39 0.0012* 24.17
<0.01
10.48 0.0012* 16.17 0.00005* 6.23
0.012*
5.31
0.0211*
10.74
0.001*
9.67
0.001*
9.19
0.0024*
0.21
0.5
*Significant at 0.05
53
International Education & Research Journal [IERJ]
Research Paper
E-ISSN No : 2454-9916 | Volume : 3 | Issue : 7 | July 2017
Table 4: Comparison between pre-test and post-test Physical symptoms of stress in Control and Experimental groups Physical Symptoms
Headache Backache Muscle tension and stiffness Diarrhea Constipation Nausea Dizziness Insomnia Chest pain Rapid Pulse Weight gain Weight loss Skin Breakout Frequent colds Hair loss Others
Present Absent Present Absent Present Absent Present Absent Present Absent Present Absent Present Absent Present Absent Present Absent Present Absent Present Absent Present Absent Present Absent Present Absent Present Absent Present Absent
Control Group (N=58) Pre-Test Post-Test % n n % 48 82.8 42 72.4 10 17.2 16 27.6 27 46.6 32 55.2 53.4 31 26 44.8 34.5 20 37.9 22 38 62.1 65.5 36 14 12 24.1 20.7 46 44 75.9 79.3 17 29.3 13 22.4 66.6 41 70.7 45 14 24.1 11 19.0 75.9 47 44 81.0 15 25.9 22 37.9 43 74.1 36 62.1 18 31.0 42 72.4 16 40 27.6 68.9 14 14 24.1 24.1 44 44 75.9 75.9 26 44.8 36 62.1 32 55.2 22 37.9 12.1 20.7 7 12 46 79.3 51 87.9 34.5 22 20 37.9 65.5 38 36 62.1 2 8.6 3.4 5 56 53 91.4 96.6 20 34.5 31.0 18 38 65.5 40 69.0 72.4 39 67.2 42 16 19 27.6 32.8 3 5.1 4 6.9 55 93.1 94.8 54
χ2
P-value
1.79
0.18
0.86
0.35
0.15
0.69
0.20
0.65
0.71
0.39
0.46
0.49
1.95
0.16
19.88
0.00008*
0.00
1.0
3.47
0.06
1.57
0.20
0.15
0.69
1.37
0.24
0.16
0.69
0.37
0.54
4.00
0.4
Experimental Group (N=56) Pre-Test Post-Test n % n % 83.9 17 47 30.4 9 69.6 16.0 39 23.2 33 58.9 13 23 41.0 76.8 43 28 50.0 19.6 11 80.4 28 50.0 45 17 5 30.4 8.9 39 69.6 51 91.0 6 10.7 23.2 13 89.3 43 76.8 50 16 16.1 28.6 9 71.4 47 83.9 40 32 57.1 9 16.1 42.9 47 24 83.9 24 17.9 42.9 10 82.1 32 46 57.1 16 28.6 3 5.4 40 71.4 53 94.6 19 33.9 1 1.8 55 98.2 37 66.0 14.3 8.9 5 8 48 85.7 51 91.0 34 60.7 21 37.5 22 39.3 62.5 35 7 11 19.6 12.5 49 87.5 45 80.4 44.6 25 19 33.9 66.0 31 55.4 37 49 87.5 69.6 39 30.4 7 12.5 17 7.2 0 4 0 56 100 52 92.9
χ2
P-value
32.81
<0.01*
14.76
0.0001*
11.37
0.00074*
8.15
0.0043*
3.10
0.0780
2.52
0.11
20.35 0.000006* 8.28
0.004*
10.72
0.001*
19.72 0.000009* 0.78
0.376
6.04
0.014*
1.06
0.3034
1.35
0.245
5.30
0.021*
4.15
0.13
Table 5: Comparison between Post-test Cognitive symptoms of stress among Control and Experimental groups Control Group (N=58)
Experimental Group (N=56)
Post-Test
Post-Test
Cognitive Symptoms
Memory problems Indecisiveness Inability to concentrate Poor Judgment Trouble thinking clearly Seeing only negative side of issue Anxious or racing thoughts Constant worrying Loss of objectivity Fearful anticipation that something happens Others
Present Absent Present Absent Present Absent Present Absent Present Absent Present Absent Present Absent Present Absent Present Absent Present Absent Present Absent
International Education & Research Journal [IERJ]
n 35 23 8 50 33 25 19 39 24 34 13 45 34 24 23 35 6 52 30 28 0 58
% 60.3 39.7 13.8 86.2 56.9 43.1 32.8 67.2 41.4 58.6 22.4 77.6 58.6 41.4 39.7 60.4 10.3 89.7 51.7 48.3 0 100
n 33 23 5 51 16 40 10 46 13 43 7 49 17 39 14 42 9 47 18 38 2 54
% 58.9 41.0 8.9 91.1 28.6 71.4 17.9 82.1 23.2 76.8 12.5 87.5 30.4 69.6 25 75.0 16.1 83.9 32.1 67.9 3.6 96.4
χ2
P-value
0.02
0.87
0.67
0.41
9.33
0.0022*
3.34
0.06
4.29
0.03*
1.94
0.16
9.21
0.002*
2.79
0.09
0.82
0.36
4.48
0.03*
2.11
0.2
54
Research Paper
E-ISSN No : 2454-9916 | Volume : 3 | Issue : 7 | July 2017
Table 6: Comparison between Post-test Physical symptoms of stress among Control and Experimental groups Physical Symptoms
Headache Backache Muscle tension and stiffness
Diarrhea Constipation Nausea Dizziness Insomnia Chest pain Rapid Pulse Weight gain Weight loss Skin Breakout Frequent colds Hair loss Others
Present Absent Present Absent Present Absent Present Absent Present Absent Present Absent Present Absent Present Absent Present Absent Present Absent Present Absent Present Absent Present Absent Present Absent Present Absent Present Absent
Control Group (N=58) Post-Test % n 72.4 42 27.6 16 32 55.2 26 44.8 37.9 22 36 62.1 14 24.1 75.9 44 17 29.3 41 70.7 19.0 11 81.0 47 37.9 22 36 62.1 72.1 42 27.6 16 14 24.1 44 75.9 36 62.06 22 37.9 12.1 7 51 87.9 22 37.9 62.1 36 8.6 5 53 91.4 34.5 20 38 65.5 39 67.2 32.8 19 6.9 4 93.1 54
DISCUSSION: Prevalence of cognitive and physical symptoms of stress: Cognitive Symptoms: The most frequently reported 5 cognitive symptoms of stress in control group are memory problems (67.2%), inability to concentrate (60.3%), fearful anticipation that something occurs (55.2%), anxious or racing thoughts (50%) and constant worrying and in Experimental group, are inability to concentrate (75%), Memory problems (71.4%), fearful anticipation that something occurs (60.7%), trouble thinking clearly (60.7%), constant worrying (35.4%) and anxious or racing thoughts (51.8%). This is in partial consistence with the study findings of Damayanthi (2014) that the major symptoms of stress in students are having trouble concentrating on what they are doing and unable to stop thinking about their concerns at night, feeling anxious, feeling tense and nervous anxiety.3 Physical Symptoms: During pre-test the prevalence of top five highest percentages of physical symptoms of stress in control group are Headache (82.8%), Hair loss (72.4%), Back ache (46.6%), rapid pulse (44.8%) and muscle stiffness (34.5%) and in experimental group, Hair loss (87.5%), Headache (83.9%), weight loss (60.7%), Back ache (58.9%) and Dizziness (57.1%). This is in partial agreement with the study findings of Pratibha, P,K., (2009) that the top five frequency symptoms are Headache 60.5%, Acidity 54.5%, Backache 47.2%, stiffness in neck and shoulders (43.4%) and stomach ache (11.3%). But in the present study, none of the students reported stomach ache.7 Comparison of pre-test and post-test symptoms of stress in Experimental and Control group. Cognitive Symptoms of Stress: There is significant decrease only in post-test of experimental group like indecisiveness, inability to concentrate, poor judgment, trouble thinking clearly, seeing only negative side of the issues, anxious or racing thoughts, constant worrying, loss of objectivity, fearful anticipation that something happens (p<0.05) and no decrease in control group (p>0.05). There is no
55
Experimental Group (N=56) Post-Test % n 17 30.4 69.6 39 13 23.2 43 76.8 11 19.6 45 80.4 5 8.9 91.0 51 10.7 6 50 89.3 16.1 9 47 83.9 9 16.1 83.9 47 10 17.9 82.1 46 5.4 3 53 94.6 1.8 1 55 98.2 5 8.9 51 91.0 37.5 21 35 62.5 19.6 11 80.4 45 19 33.9 37 66.0 39 69.6 17 30.4 0 0 100 56
χ2
P-value
20.18
0.000007*
12.18
0.0004*
4.63
0.0313*
4.75
0.029*
6.11
0.013*
0.16
0.68
6.88
0.008*
34.18
<0.01*
7.92
0.004*
47.23
<0.01*
0.29
0.58
0.00
0.96
2.87
0.09
0.00
0.95
0.08
0.78
4.00
0.14
significant decrease of memory problems in post-test even in experimental group. Physical Symptoms of stress: There is significant decrease in post-test symptoms only in experimental group like headache, backache, muscle tension and stiffness, diarrhea, insomnia, chest pain, rapid pulse, weight loss and hair fall. In post-test of experimental group, there is no decrease in certain physical symptoms like constipation, nausea, weight gain, skin break down, frequent colds. As these symptoms also occurs due to various other causes, their occurrence need to be thoroughly investigated for cause. In Control group, there is no significant decrease in all physical symptoms of stress during post-test. But it was observed that there is a significant increase of insomnia during post-test, which may be due to many factors that are not tackled to decrease insomnia. Comparison of post-test cognitive and physical symptoms of stress between experimental and Control group. Cognitive Symptoms: The post-test chi-square values for Experimental and Control groups shows statistical significance at 0.05 level for inability to concentrate (9.33), trouble thinking clearly (0.03), anxious or racing thoughts (1.94) and fearful anticipation that something happens (4.48) Physical symptoms: The post-test chi-square values for Experimental and Control groups shows statistical significance at 0.05 level for headache (20.18), backache (12.18), muscle tension and stiffness (4.63), diarrhea (4.75), constipation (6.11), dizziness (6.88), insomnia (34.18), chest pain (7.92) and rapid pulse (47.23). CONCLUSION: Keller, et.al (2011) revealed that stress have a detrimental effect, leading to psychological and physical health effects.5Naill,D,G and Katherine, E.B (2010) mentioned, the importance of developing stress management programmes for student nurses.6 Academic Institutions need to be sensitive for recognition of stress symptoms
International Education & Research Journal [IERJ]
Research Paper
E-ISSN No : 2454-9916 | Volume : 3 | Issue : 7 | July 2017
among the student nurses. This enables them for implementing stress management techniques in curriculum and enhances job satisfaction among student nurses helping them to manage both the personal and professional stressors. The stress management techniques relieved many cognitive and physical symptoms of stress, which had beneficial effects on students. The academicians and curriculum planners need to develop training strategies that can reduce symptoms of stress with appropriate designing of conducting counselling and training sessions to present nursing faculty so that they can provide personalised counselling sessions and stress management techniques on needy students. REFERENCES: 1.
American psychological Association (2014). Stress: The different kinds of stress. Available: http://www.apa.org/helpcenter/stress-kinds.aspx
2.
Dalal Bashir, M.Y, Shirroq M. J, Seqlia Mohammad Eser (2016) Predictors of coping strategies among nursing college students at AL-Zaytoonah university of Jordan. Journal of Education and Practice. 7, (15): Available: ISSN 2222-288X (online).
3.
Damayanthi, H.D.W.T,(2014) Perceived stressors among undergraduate nursing students, university of Peradeniya. Sri Lanka. International Journal of Scientific and Research Publications, 4(6): Available: ISSN 2250-3153(online).
4.
Innes, J.M., (1998). A qualitative insight into the experience of post graduate radiography students. Causes of stress and methods of coping. Radiography 4, p. 89-100.
5.
Keller, A, Litzelman, K, Wisk, L.E, Maddox, T, Cheng, E.R, Creswell, P.D and Witt, W.P. (2011). Does the perception that stress affects health matter? The association with health and mortality. Health Psychology .31(5), p.677-684.
6.
Naill, D, Galbrith and Katherine, E. B., (2011) Assessing intervention effectiveness for reducing stress in student nurses: quantitative systematic review. Journal of Advanced Nursing.. Available: DOI: 10.1111/j.1365-2648.2010.05549.x.
7.
Pratibha, P, Kane(2009) Stress causing psychosomatic illness among nurses. Indian J occup. environ med, 13(1), p.28-32. Available: DOI:10.4103/0019-5278.50721.
8.
Rajesh Kumar and Nancy (2011) Stress and coping strategies among nursing students. Nursing and Midwifery Research Journal. 7(4).
International Education & Research Journal [IERJ]
56