Research Paper
Engineering
E-ISSN No : 2454-9916 | Volume : 3 | Issue : 7 | July 2017
RF OPTIMISATION OF GSM NETWORKS USING ANTENNA PARAMETERS 1
1
Atharva Mulay | Ankit Jha | Sumaiyya Pathan 1
1
Department Of Electronics and Telecommunications Engineering, SKNCOE, Pune-411041.
ABSTRACT Key performance indicators (KPI) are used by the GSM network operators to evaluate their network performance as well as the quality of service(Qos). Drive test results are used to optimise the GSM network. Network optimization process and network optimization using antenna parameter setting is carried out then the results are justified, eventually the value of incorrect antenna parameter setting on network optimization is dis-played. Important KPIs such as Call Drop Rate (CDR), Call set up success rate (CSSR), Handover Success Rate (HSR) and Traffic channel (TCH) congestion rate the quality of service (QOS) are used for the performance evaluation of GSM network RF optimization. KEYWORDS: KPI, Antenna Parameters, RF Optimization ,GSM Networks. 1. INTRODUCTION: GSM networks have call rates and call drops are the major problems. So this RF optimization is done in order to reduce such problems.GSM Network is comprised of a mobile Station (MS) which is connected to the Base Transceiver Station (BTS) via air inter face.The radio network planning and optimization determines the performance of GSM network. The present optimization methods always use measured data to analyze network performance and do not directly consider the disturbance intensity which is directly related to the distance, azimuth, relative position, and other factors[2].Planning of wireless networks is vital if operators wish to make full use of the existing investments. It deals with a practical approach of radio network planning process for efficient usage of GSM network. This study would help to plan operators to enhance coverage, improve quality and increase capacity using the antenna parameters. 2. OPTIMIZATION TECHNIQUE: Optimization involves monitoring, verifying and improving the performance of the radio network. It identifies and rectifies the performance affecting factor within the network infrastructure. Optimization consists of two phases. Firstly the Single site optimisation and secondly the cluster site optimisation. In single site optimisation, each and every site is verified for their KPI performance known as SSV. Further it is optimised physically and parameter wise followed by cluster optimisation. The whole process is known as “pre drive”.Antenna orientation results are driven from these results[1].Further after making the required changes the results are further calculated to meet the TRAI cap. This is known as “post drive”.Further divisions of the process. 2.1 Algorithm for Optimization: The presence of the individual sites in the cluster enables us to verify whether handover is performed. All the parameters like Antenna Height, Azimuth angle. Antenna Down tilt (Electrical), Antenna down tilt (Mechanical), Expected coverage areas etc. are be observed while evaluating the network. 2.2 Single Site Verification (SSV): Physical and network parameters of the single site are verified in Single Site Verification. Based on the performance of the site, certain changes in both physical level as well as parameter level of the site are recommended. A quantitative comparison from the values given in the database of the site during its RF survey process with the physical parameters like Antenna Orientation, Tilt, Height and SWAP etc done. 2.3 Idle Mode and Dedicated Mode: The verification of the coverage area in a cell site is provided by the idle mode. Receiver (Rx) level up to -85dBm is considered to be acceptable. No call is initiated from the mobile phone in this mode. The purpose served by the Dedicated Mode is to verify all the requests like Call setup, Call success, Handover failure, Call drop etc. In this mode mobile is operated in two call modes. One is short call mode and the other is long call mode. The function of the short call is to get the knowledge about the Call Accessibility and the function of the long call is to get information about Call Retainability. In short call, important parameters like Blocked calls, Dropped calls, Call attempts, Call success are mainly observed. In long call parameters like Handover failures[4], Handover success rate are observed.
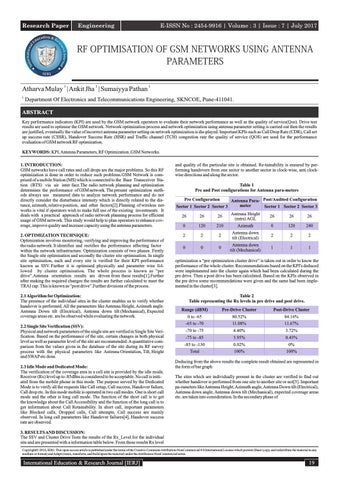
and quality of the particular site is obtained. Re-tainability is ensured by performing handovers from one sector to another sector in clock-wise, anti clockwise directions and along the sector. Table 1 Pre and Post configurations for Antenna para-meters Pre Configuration Sector 1 Sector 2 Sector 3
Antenna Para- Post/Audited Configuration meter Sector 1 Sector 2 Sector 3 Antenna Height (mtrs) AGL
26
26
26
210
Azimuth
0
120
240
2
2
2
1
1
1
26
26
26
0
120
2
2
2
Antenna down tilt (Electrical)
0
0
0
Antenna down tilt (Mechanical)
optimization a “pre optimization cluster drive” is taken out in order to know the performance of the whole cluster. Recommendations based on the KPI's deduced were implemented into the cluster again which had been calculated during the pre drive. Then a post drive has been calculated. Based on the KPIs observed in the pre drive some recommendations were given and the same had been implemented in the cluster[3]. Table 2 Table representing the Rx levels in pre drive and post drive. Range (dBM)
Pre-Drive Cluster
Post-Drive Cluster
0 to -65 -65 to -70
80.52% 11.08%
84.16% 11.67%
-70 to -75
4.40%
3.72%
-75 to -85
3.95%
0.43%
-85 to -130 Total
0.02% 100%
0% 100%
Deducing from the above results the complete result obtained are represented in the form of bar graph The sites which are individually present in the cluster are verified to find out whether handover is performed from one site to another site or not[5]. Important pa-rameters like Antenna Height, Azimuth angle, Antenna Down tilt (Electrical), Antenna down angle, Antenna down tilt (Mechanical), expected coverage areas etc. are taken into consideration. In the secondary phase of
3. RESULTS AND DISCUSSION: The SSV and Cluster Drive Tests the results of the Rx_Level for the individual site and are presented with a information table below. From these results Rx level Copyright© 2016, IERJ. This open-access article is published under the terms of the Creative Commons Attribution-NonCommercial 4.0 International License which permits Share (copy and redistribute the material in any medium or format) and Adapt (remix, transform, and build upon the material) under the Attribution-NonCommercial terms.
International Education & Research Journal [IERJ]
19