Living Wage Report
2022 Update
The Institute and The University of Scranton
THE INSTITUTE and THE UNIVERSITY OF SCRANTON
What does it cost for families to live modest but dignified lives in Northeastern Pennsylvania?
Table of Contents
A basic moral test is how our most vulnerable members are faring. In a society marred by deepening divisions between rich and poor, our tradition recalls the story of the Last Judgment (Mt 25:31-46) and instructs us to put the needs of the poor and vulnerable first.”

The 2022 Living Wage Report is a collaboration of The Institute and The University of Scranton (Center for Ethics and Excellence in Public Service, the Ellacuría Initiative, and the Office of Community and Government Relations). The full report and additional resources can be found online at scranton.edu/livingwage Introduction . . . . . . . . . . . . . . . . . . . . . . . . . . . . . . . . . . . . . . . . . . . . . . . . . . . . . 4 Living Wage Income Changes from 2019 to 2022 5 Impact of COVID-19 10 Cost of Living in NEPA 11 Northeastern PA Living Wage Analysis . . . . . . . . . . . . . . . . . . . . . . . . . . . . . . . 14 Equity Issues . . . . . . . . . . . . . . . . . . . . . . . . . . . . . . . . . . . . . . . . . . . . . . . . . . . 20 Who are the Minimum Wage Earners & Others Who Lack a Living Wage? What are the Available Jobs and Wages? 23 Resources for Economically Insecure Families 27 Recommendations 33 How Should We Respond? . . . . . . . . . . . . . . . . . . . . . . . . . . . . . . . . . . . . . . . 38 Conclusions . . . . . . . . . . . . . . . . . . . . . . . . . . . . . . . . . . . . . . . . . . . . . . . . . . . 39
— United States Conference of Catholic Bishops
org), “Option for the Poor and Vulnerable ”
(ussccb
contents
Since 2021, when I first arrived at The University of Scranton, I have appreciated the strong community, warmth and generosity, and deep resilience of the City of Scranton I often walk from the University’s campus to the Scranton Iron Furnaces and admire the hard work and ingenuity that forged this region’s growth so many years ago and which also helped to create nation-wide changes in support of the dignity of labor
The 2022 Living Wage Study, conducted by The University of Scranton and The Institute, once again sheds light on what is meant by a “living wage” — what it takes for individuals and families to live modest but dignified lives here in Northeastern Pennsylvania
While our region continues to make many gains and improvements, the study also shows that too many of our neighbors experience economic hardship In this report, like the previous studies, the large gap between the minimum wage and living wage remains In this 2022 update, I am especially struck by how the median income for both counties now falls short of a living wage for all households with children . Costs are rising for food and other essential needs, while wages and supports are not keeping up, and there is a serious shortage of affordable housing
We see how the COVID-19 pandemic has longstanding ramifications Inflation is creating a situation where there is less available cash for families to spend on basic needs and the data reveals ongoing and troubling racial disparities And yet the report offers solutions, building on important pandemic-related governmental policies and the efforts of community agencies It calls on each of us to do our part as institutions and as individuals
The insights from community leaders underscore the urgency of the moment and the principles of Catholic Social Teaching outlined indicate that none of us can ignore these very human and localized problems of economic, food and housing insecurity . The Society of Jesus’ Universal Apostolic Preferences point a way forward through spiritual discernment, accompaniment of our youth, walking with the marginalized, and collaboration to care for our common home Despite the challenges and inequities raised in these pages, I am inspired and motivated by the many people in our region committed to a more just future
Yours faithfully,
Rev Joseph G Marina, S J President, The University of Scranton

The Institute and The University of Scranton

3
Introduction
In 2016, The University of Scranton (University) and The Institute set out to understand better what constitutes a living wage in Northeastern Pennsylvania (NEPA). We found that the federal and current Pennsylvania minimum wage of $7.25, equating to just $15,080 per year, proved inadequate in providing families in the region with economic security. Both the 2016 and 2019 reports revealed gaps between the minimum wage and living wage thresholds; both also included interviews with local leaders and recommendations drawing on Catholic Social Teaching and public policy best practices, which have since contributed to regional discussion and action. The 2022 Living Wage Report seeks to understand and analyze again what constitutes a living wage in our region, the challenges facing those who fall below the living wage threshold, and mitigating factors — in particular, racial disparities and the impact of the COVID-19 pandemic on economic security.
All of the Living Wage Reports seek to highlight the predicament of those individuals and families with incomes below the standard measure of poverty — the federal poverty line — as well as the many that fall above that threshold, working full-time but still earning less than a living wage. Individuals and families lack economic security in both cases, but the latter find themselves in an ambiguous situation, upon which these reports have sought to expand. A living wage, and the broader concept of family economic security, is defined as the wage rate at which a worker, employed on a full-time basis, can reach a standard of living that meets “essential basic needs” and allows the individual or family to “live a modest but dignified life.” The living-wage threshold represents the amount of income required to achieve this standard of living.
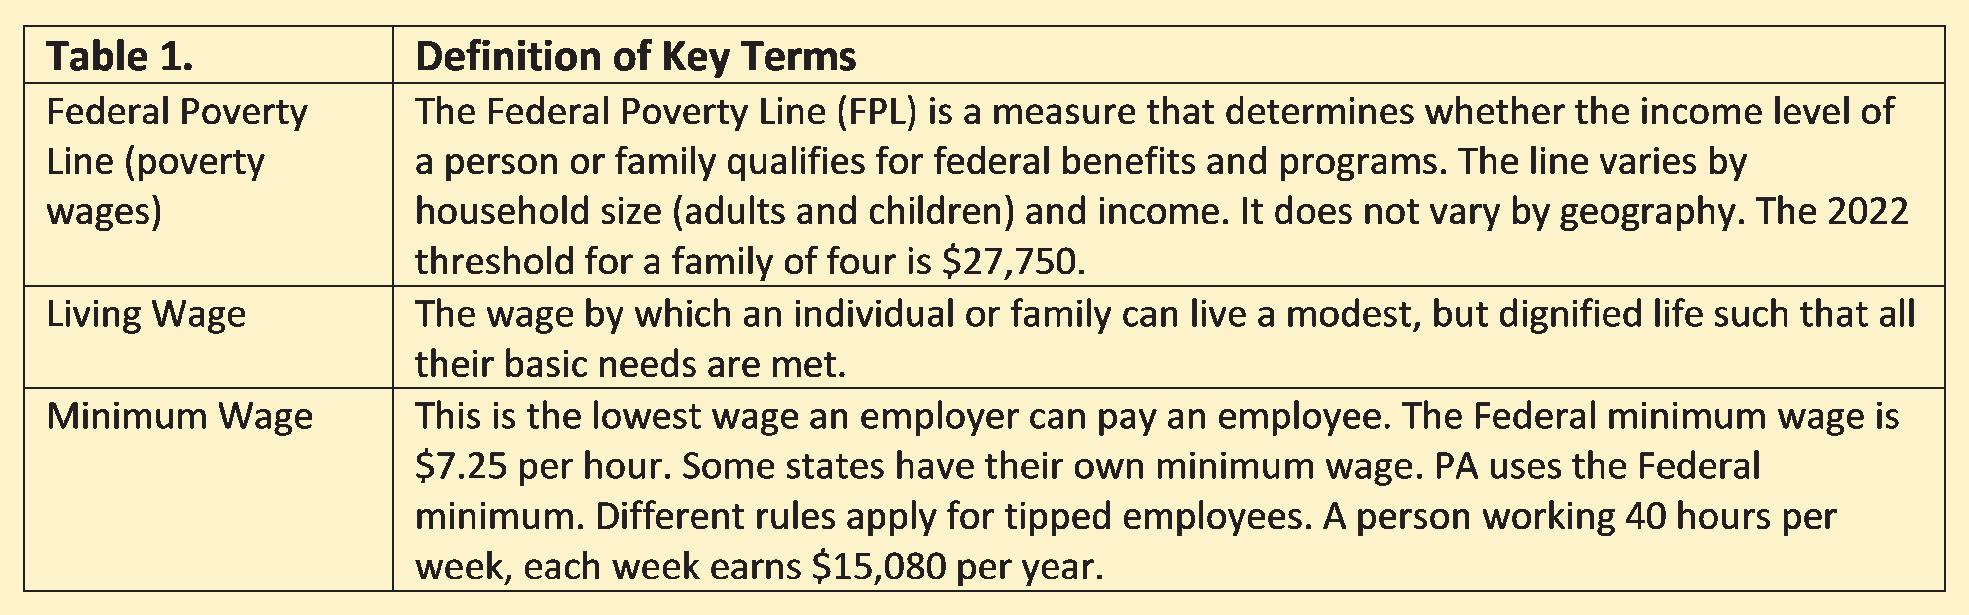
The Reports are based on data drawn from the Living Wage Calculator produced by the Massachusetts Institute of Technology (MIT), the purpose of which is to estimate the cost of living in a given community or region based on typical expenses. The Calculator helps communities determine a local wage rate that allows residents to meet minimum standards of living. Other data sources in the report include information drawn from the U.S. Census Bureau, including the American Community Survey, as well as other federal agency resources. Table 1. provides a definition of key terms.
For families to meet basic needs, living wage data accounts for the costs of several categories of household spending costs in NEPA today: food, childcare (if applicable), medical care, housing, transportation, taxes, and other expenses (which includes a small allowance for household and personal care, reading, and clothing).
Living Wage Report 2022 Update 4
A
For many working families in Pennsylvania, however, meeting even these expenses can prove out of reach. In both 2016 and 2019, our studies found that the minimum wage was not viable as a living wage — and inflation has only risen since — while the minimum wage has remained the same, nationally and in Pennsylvania A . Moreover, for many of the family classifications, even the poverty wage is above the minimum wage. In addition, the median household income for the region in the 2016, 2019 and 2022 reports also fell below the living wage threshold for some family compositions; in 2022 (using 2020 data), this lag extended to all households except those without children. This 2022 Living Wage Report discusses current realities, with comparisons to 2016 and 2019 findings where applicable and available, to highlight potential improvements or heightened challenges.
Living Wage Income Changes from 2019 to 2022
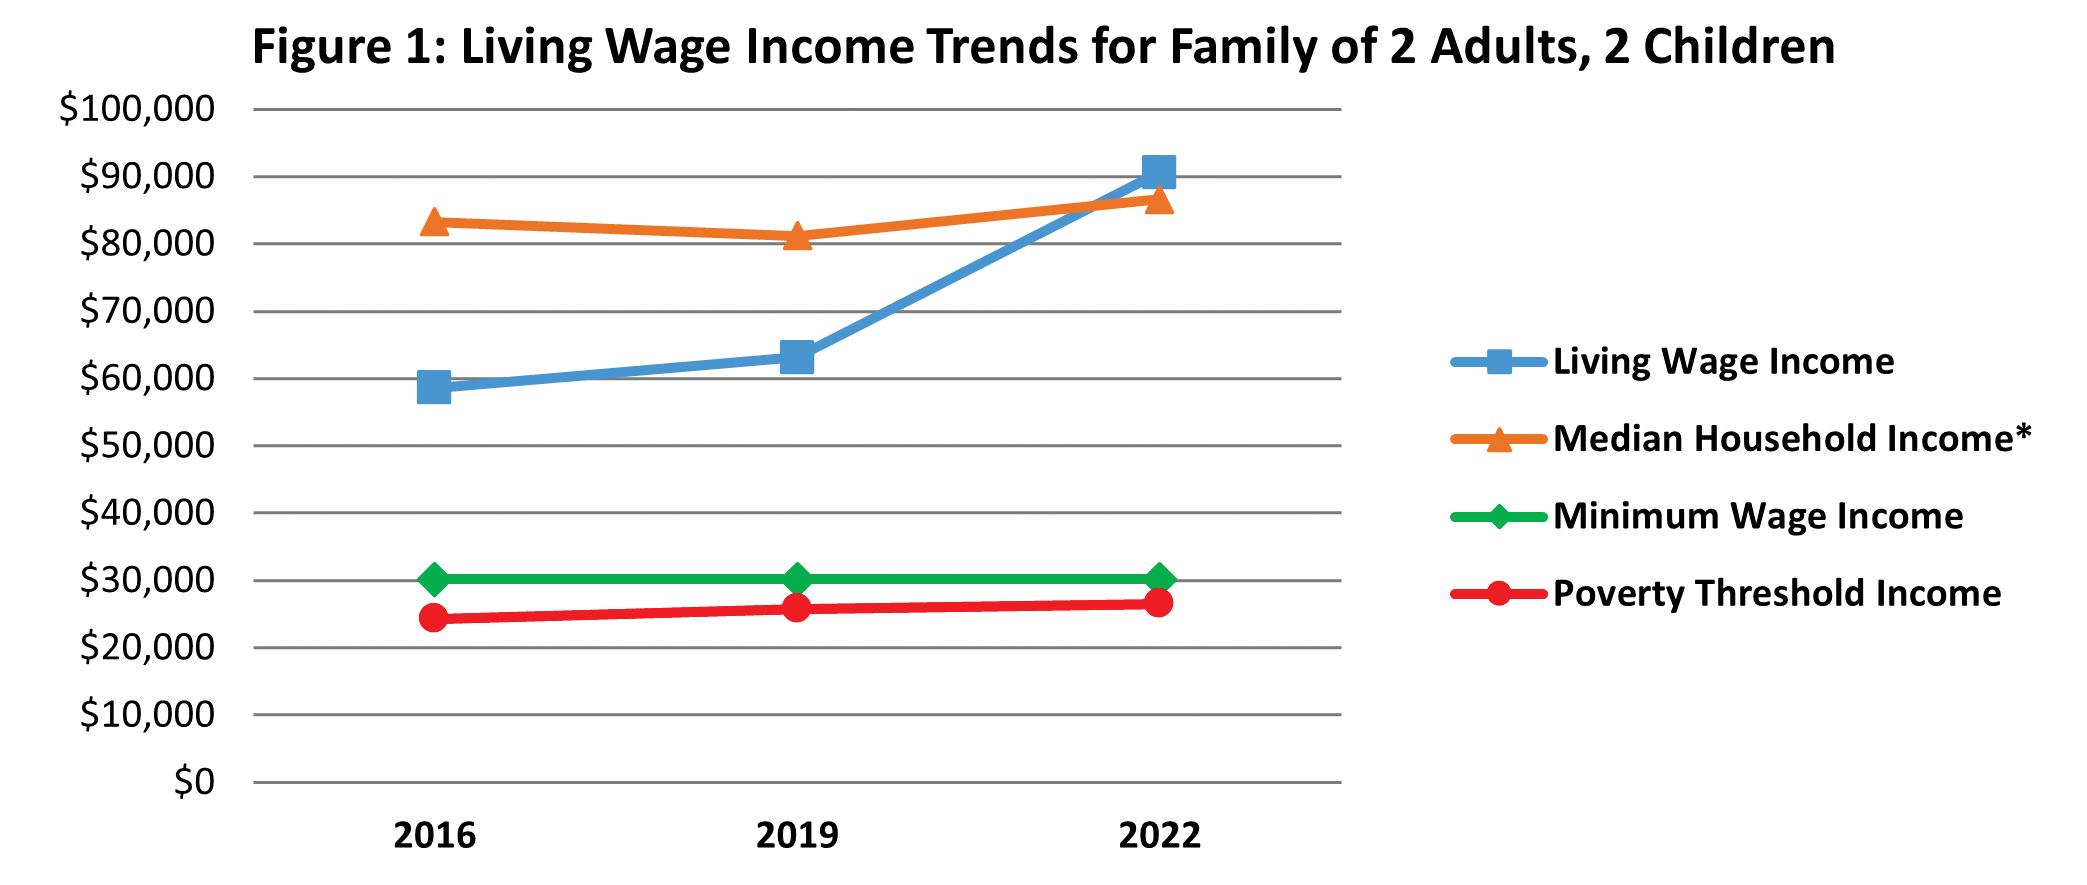
The living wage income need increased for all family classifications across all geographies from the 2019 to 2022 Reports. For instance, the living wage income for a family of two adults (one working) and two children in Lackawanna and Luzerne counties increased from $42,910 in 2019 to $59,717 in 2022 — a significant 39 percent increase. Changes over the three reports can be seen in Figure 1.
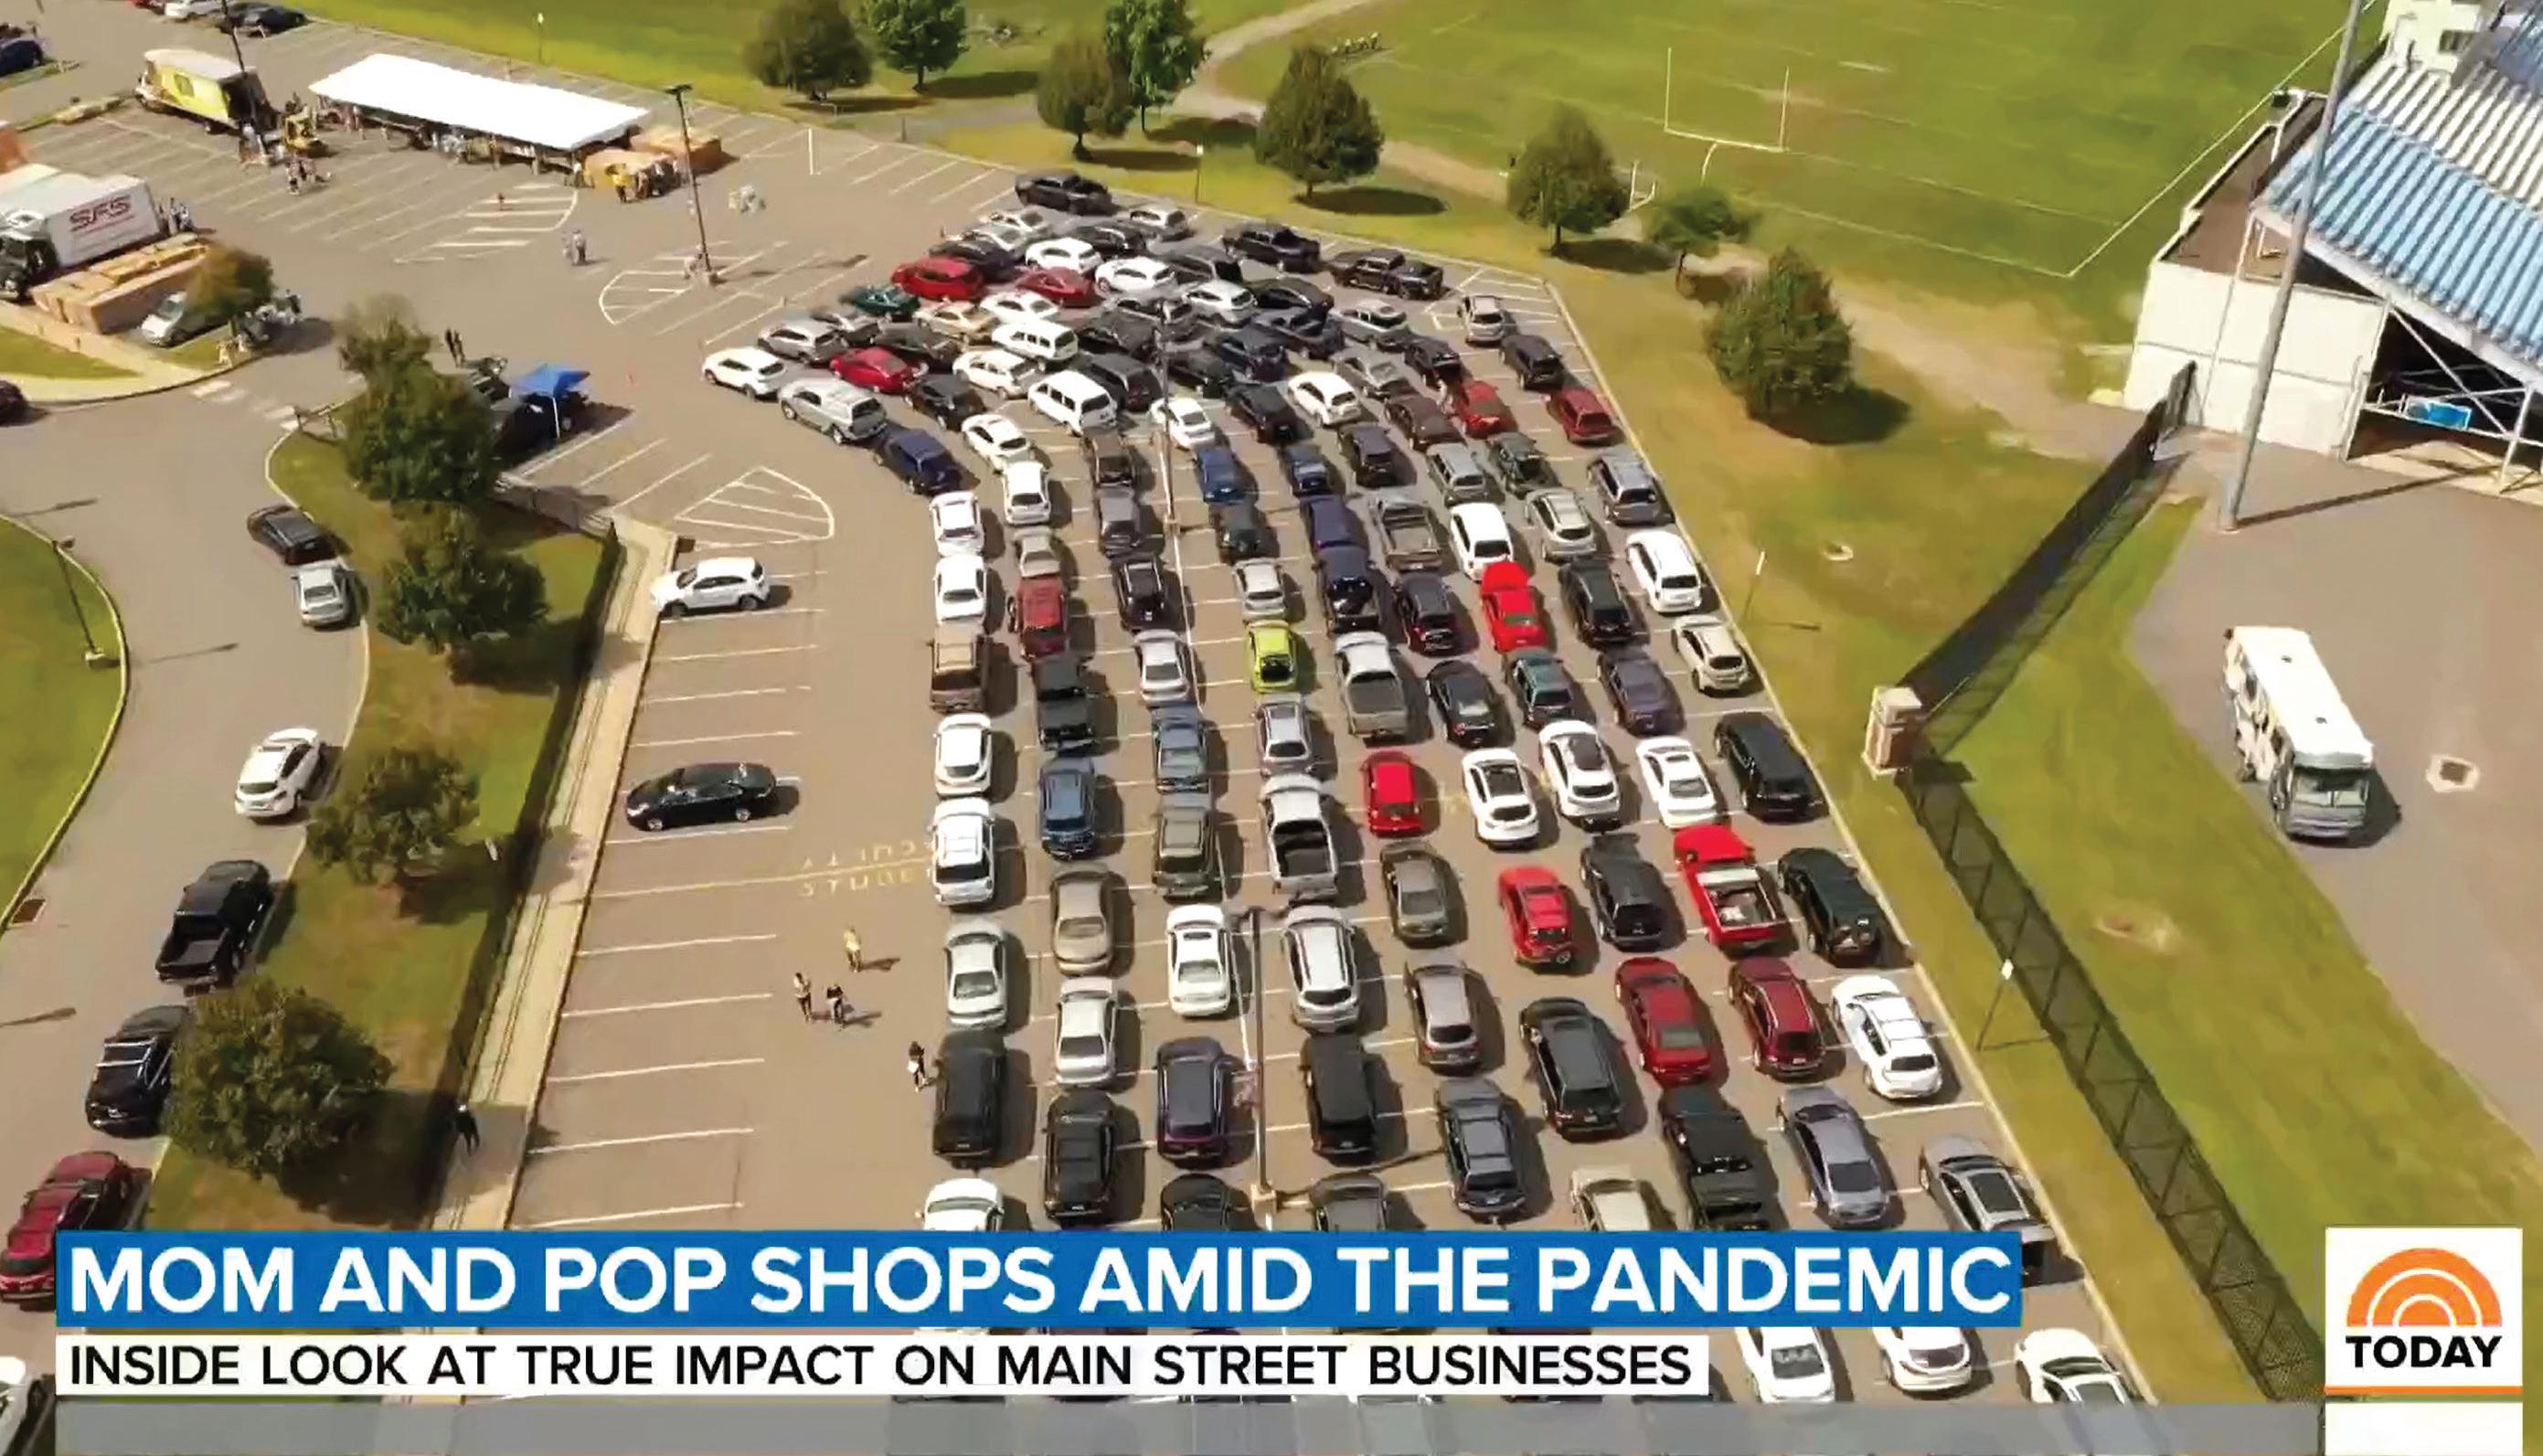
The increasing gap between the federally designated poverty level and the calculated living wage shows, on a statistical level, why the number of requests for assistance at Friends of the Poor have increased exponentially since 2019. What it cannot show, on a personal level, are the faces of hungry children and the exhaustion, pain, and fear in the eyes of their parents. The widening income gap, a global pandemic, soaring inflation, and supply chain issues, have introduced an entirely new population to the realities of poverty in Scranton, PA. This study shines a light on why the work of service providers has not diminished. We sincerely hope that all who read this report use it as motivation and documentation to spark systemic change.”
— Meghan Loftus, President & CEO, Friends of the Poor
The poverty wage is the rate at which any wage below would, on an annual, full-time basis, result in poverty for the earner and his or her dependents.
5
The Institute and The University of Scranton
Many families are not eligible for different necessary services. They are still struggling to make ends meet and would benefit from these policies but are making ‘too much’ money to qualify for programs. Our social services are often cut-off without consideration for inflationary costs or the current economic climate. Additionally, there is very little graduated reduction in support should one’s conditions change. These programs have an all-or-nothing mentality that inhibits individuals and families from ever really exiting poverty.”
— Lori Chaffers, Executive Director, Outreach—Center for Community Resources
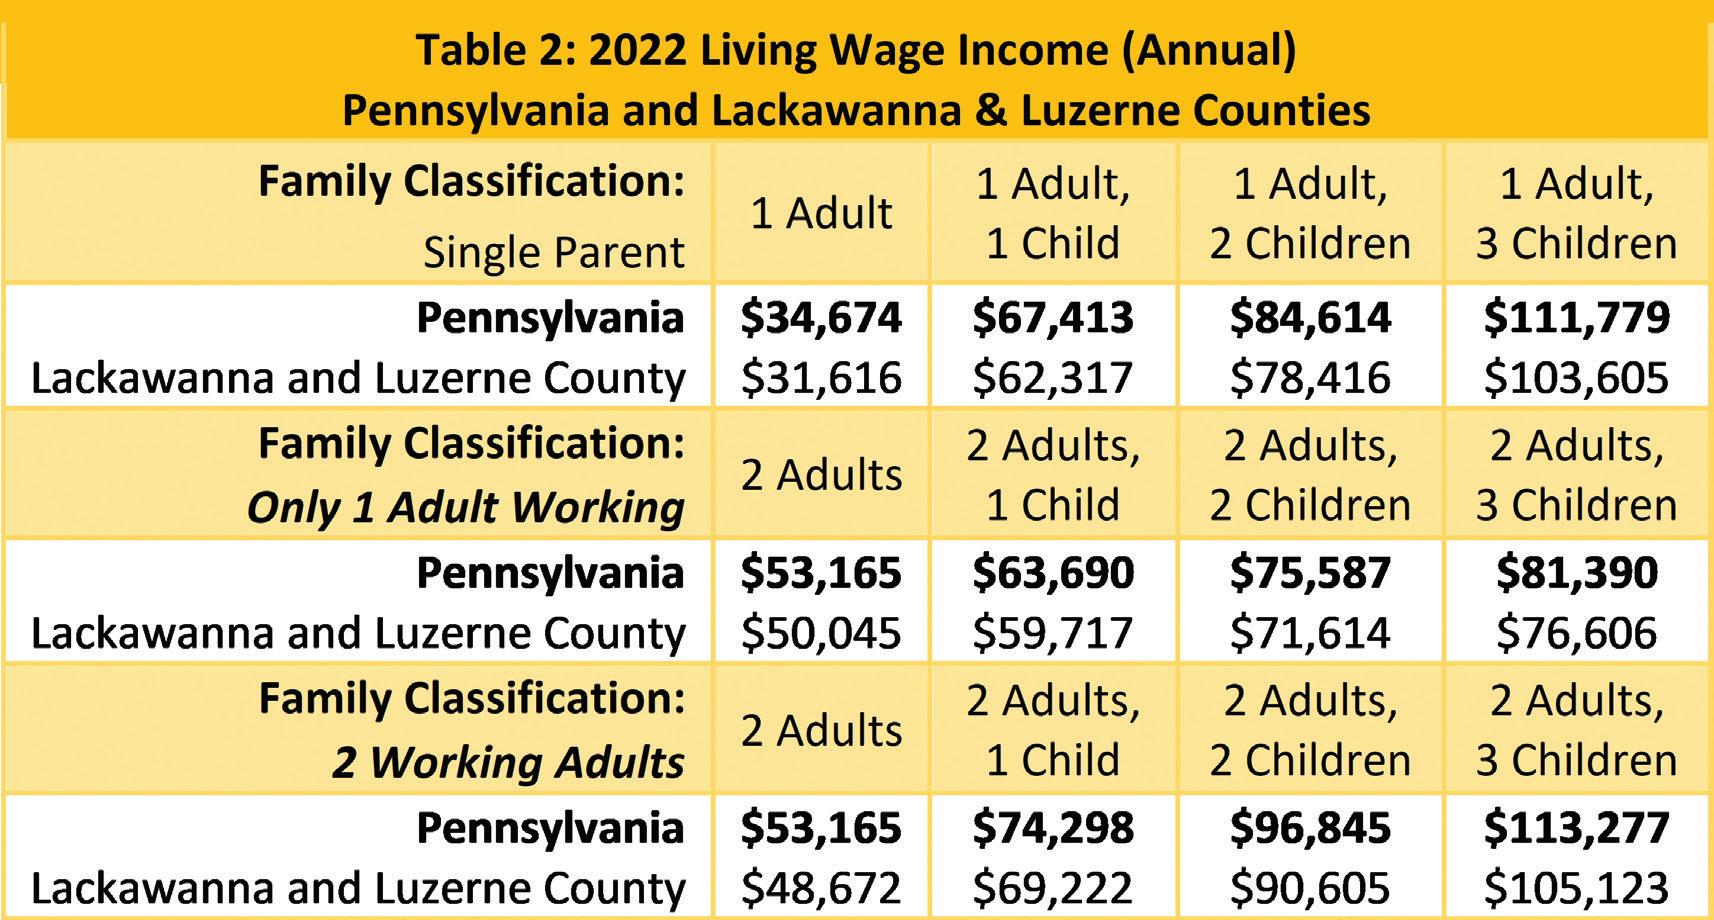
Increases in living wage income can be attributed to a range of economic factors; however, few factors were as influential as inflationary pressure. The Consumer Price Index (CPI), an annual statistical estimate derived from the cost of a sample of consumer goods and services purchased by households, also formed part of the foundation for the Living Wage Calculator. In 2015, the base year for the 2016 Living Wage Study, the CPI stood at 2.37, with inflation ticking slightly up by 0.1 percent for that year. Estimates for the 2018 CPI showed an absolute rise of 5.7 percent, with inflation ticking significantly up to 2.2 percent — at the time, the highest annual inflation rate since 2011. Inflation has continued to increase. As of May 2022, the average price for the same good has risen 8.6 percent in the past 12 months. Table 2 shows the living wage income for 2022, respectively, in Pennsylvania and Lackawanna and Luzerne counties.
Living Wage Calculator, 2022, Dr. Amy K. Glasmeier and the Massachusetts Institute of Technology, http://livingwage.mit.edu/
Living Wage Report 2022 Update 6
Source:
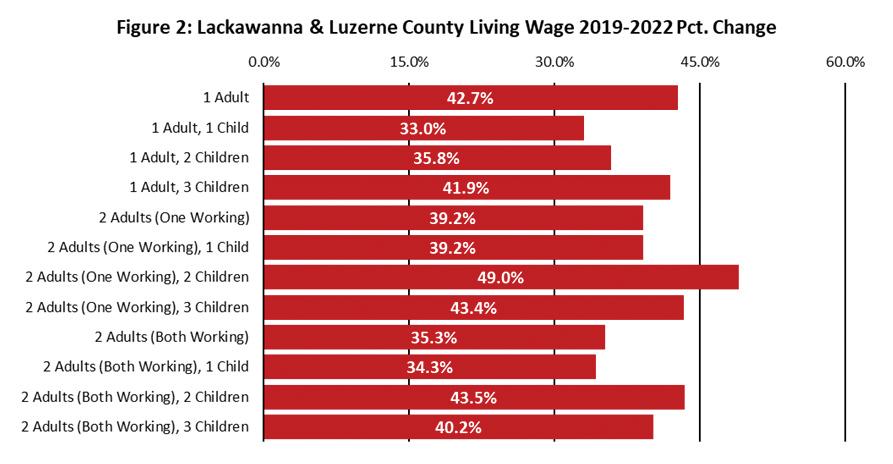
The living wage income across Pennsylvania and, more specifically, in Luzerne and Lackawanna counties, has risen significantly in this three-year period. Across all family types analyzed, the increase in the living wage ranged from 33 to 49 percent, with an average of about 40 percent, as shown in Figure 2. For instance, for the family with two adults (one working) and two children, the living wage income rose from $48,069 in 2019 to $71,614 in 2022, a sizable 49 percent change. Since the 2019 report, which included 2017 data on household income, the median household income only rose by about nine percent — well behind the pace at which the living wage has accelerated B .
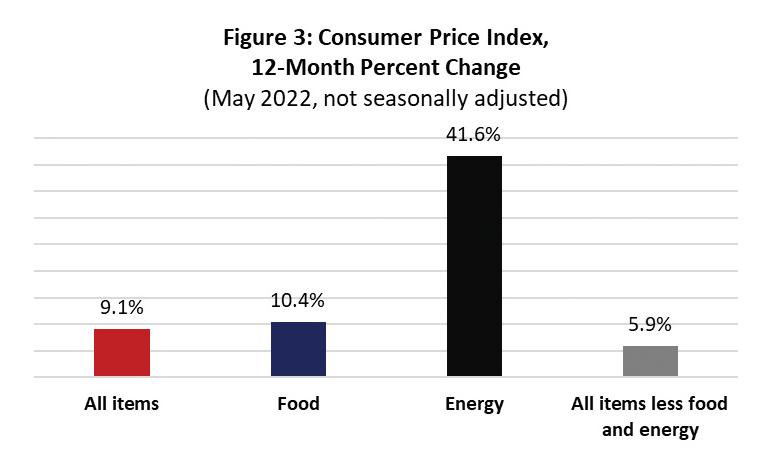
It is helpful to understand which products are most influential as they relate to cost of living. Data from the U.S. Bureau of Labor Statistics, Figure 3 on page 10, shows the percentage change in the CPI over the 12 months before May 2022. Over that period, energy is the category that has experienced the most inflation, most notably due to the rapid increase in fuels, including gasoline pricing. Ripple effects in energy markets are also resulting in higher costs for electricity and fuels used for transportation, home heating and air conditioning. The conflict in Ukraine, which began in February 2022, and resulting decline in the global trade of Russian oil, has been a large contributor to decreasing the supply of fuel available to Americans.
Anyone described as living with economic insecurity or poverty is struggling and, therefore, living a more anxious life. That impacts their ability to set goals, to raise their family with dignity or to feel secure. Due to the pandemic, the cost for food, housing and childcare have increased tremendously. At Saint Joseph’s Center, we saw clients needing to extend their stay at our maternity residential programs. As an employer, we created a multi-faceted wage initiative to increase hourly wages. The competition for hourly wage workers has incentivized many companies to raise wages and provide other benefits which foster economic stability.”
— Sr Maryalice Jacquinot, President and CEO, Saint Joseph’s Center
7
The Institute and The University of Scranton
B 2021
on
data
household income is not yet available from the American Community Survey.
Rising costs in necessities such as food, housing, utilities and gasoline have made a difficult situation far worse for the families we serve at United Neighborhood Centers of NEPA. In the first nine months of 2022, we have served 522 more households than in 2021 for these specific requests. 13,930 additional services have been provided with three months remaining in the year.
Affordable housing is at crisis level in our community and families are making the dreaded decisions about which bills will and won’t get paid in any particular month.”

8
— Lisa Durkin, President and CEO, United Neighborhood Centers

9
“Affordable housing is at crisis level in our community...”
As outlined below, there are several resources available to low- and moderate-income households that do not earn a living wage in NEPA. However, for many of the most ubiquitous assistance programs, there is a gap between income eligibility limits and the living wage threshold. This phenomenon is often characterized by nonprofit organizations as a “benefits cliff” whereby individuals may increase their wages above poverty thresholds and thus lose benefits while still not attaining a living wage. The gap is often filled by already overextended community organizations, further strained in recent years by the pandemic to provide more services to more people, including many who were seeking assistance for the first time. The “cliff” phenomenon also extends to other areas, including medical care. For instance, those at the poverty level are able to access Medicaid, but those who make too much to qualify but still lack a living wage job that includes robust health benefits may forego care that would require paying high deductibles or other service fees.
Impact of COVID-19
Since the 2019 Living Wage Report, the COVID-19 global pandemic has created acute and long-lasting public health impacts that also affect economic insecurity. COVID-19 has been responsible for over 2,100 deaths and counting in Northeast Pennsylvania since the pandemic’s onset in the United States in early 2020. It changed the way companies operate and how employees work, shut down schools temporarily, and closed many small businesses permanently.
While unemployment rates skyrocketed in the early days of the pandemic, they have largely returned to pre-March 2020 numbers (per FRED, the economic research division of the Federal Reserve Bank of St. Louis, unemployment in February 2020 was 5.6 percent). The labor market has become tight again as employers report hiring difficulties, though as of June 2022, the regional unemployment rate was still higher (5.5 percent) than the state (4.5 percent) and the nation’s (3.5 percent), according to the U.S. Bureau of Labor Statistics. Ripple effects from the pandemic and rapid economic recovery include crises in the supply chain and a record pace of inflation. Federal funding in the form of tax credits/relief payments to individuals and families on a scale based on income
Living Wage Report 2022 Update 10
helped to alleviate income gaps and other financial strains; similarly, non-profits, small businesses, and government entities were recipients of various forms of aid to help alleviate the pandemic’s economic stressors. Monthly federal payments helped to reduce poverty for children, including in Northeastern Pennsylvania, according to The Institute’s 2022 Indicators Report based on provisional 2020 data, and demonstrated the value of cash assistance in addressing economic insecurity more broadly. Moreover, as the 2022 Indicators Report noted, a small drop in the poverty rate in Lackawanna County (-2.0 percent) and Luzerne County (-.1 percent) in 2020 as compared to 2019 is “likely influenced by increased assistance programs and direct federal payments implemented in that year” (moreover, U.S. Census Bureau data shows that cash assistance increased from 3.5 percent to 3.9 percent from 2019 to 2020).
COVID’s negative effects hurt families that do not earn a living wage in higher proportions than those that do. Workers earning lower wages were often subjected to exposure to the virus as service workers, and they did not have the same access to healthcare as higher-wage earners. Pandemic-related government supports to families, while successful, have mostly ended, and families are now back in the same predicament as before COVID with systemic inequalities persisting. For example, according to the Center on Budget and Policy Priorities, Black and Latino households were more likely to report that “their household did not get enough to eat,” had difficulty paying rent in late 2021, and had difficulty paying for usual expenses, such as medical expenses, student loans, and car payments.
Cost of Living in NEPA
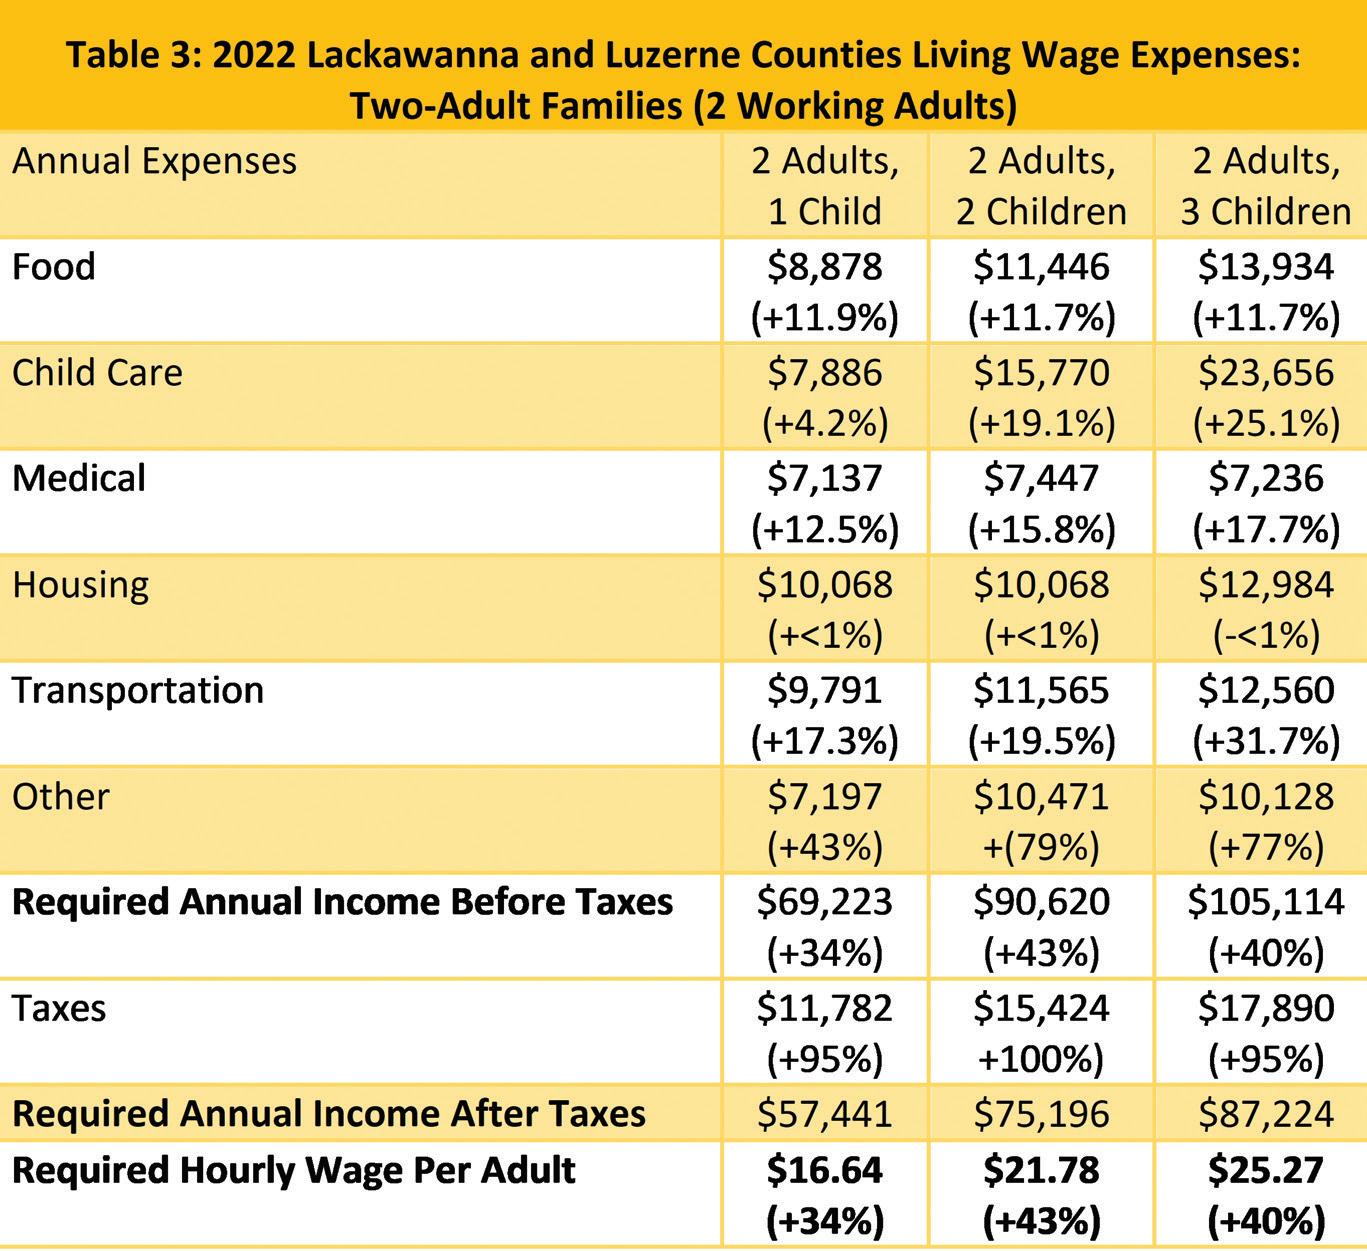
Family economic security provided by a living wage covers a broader spectrum of human needs that allows families to participate fully in society, have emergency savings, and pay taxes. This standard puts families above the poverty level and more than one step away from serious deprivation such as homelessness, foreclosure, hunger, and untreated physical and mental illness. The cost-of-living data, as described in Table 3, are derived from the Living Wage Calculator, with each cost derived from different data sources and calculations. Food expenses (which the calculator assumes is low-cost food prepared at home per the USDA’s low-cost food plan national average) have increased significantly since the 2019 report. For a family composed of two working adults and two children, food costs have increased by 11.7 percent. Housing costs, based on HUD Fair Market Rental costs, rose by 0.6 percent in the same period for the same household size. These two categories reversed the last study’s trend, where food expenses slightly decreased, and housing prices rose more than 20.0 percent; housing data and context is further explored below to better understand how our region fits into current national trends in rising housing costs and affordable housing pressures.
Transportation costs — including not only payments on used cars and trucks, but also gasoline, miscellaneous vehicle expenses, and public transportation — also increased for the same family size, by 19.8 percent. Costs for childcare arrangements that involve either family childcare or low-cost childcare centers rose by 19.1 percent over the same period. The cost of medical expenses, which include health insurance premiums, medical services, drugs, and medical supplies, have gone up by 15.9 percent. Additionally, the cost of other necessities not encompassed in any of the previous categories (and therefore designated as “Other”), which includes clothing, personal care items, and housekeeping supplies, increased by 78.8 percent — the largest increase on record by 59 percentage points, from $5,885 in 2019 to $10,471 in 2022. Of course, even these expansive categories fail to include every single expense that a family incurs each year. For instance, there is no allotment in MIT’s Living Wage Calculator for income going toward savings, college tuition, student loan payments, credit card debt, prepared meals, or vacations. Furthermore, since the last report there has been increased attention on the impacts of “period poverty” and the cost of period supplies, with a 2021 study finding that “38 percent of low-income women report missing work, school or similar events due to lack of access to period supplies.”
The Institute and The University of Scranton
11
We have seen an increased demand for City services, rising costs of housing, and residents falling behind on taxes and fees. We hear from individuals that leave the workforce because the costs of childcare and transportation reduce the cost benefit ratio of working. Landlords have opted out of the Section 8 Housing Program and there is a significant backlog of people waiting for housing vouchers. The lack of affordable housing has reached a crisis level in many parts of the country and the city needs to work to increase affordable options for its residents. The city is also currently developing an Equity Plan to make informed decisions regarding program funding and exploring creative ways to help boost wages.”
— Eileen Cipriani, Director of Community Development, City of Scranton
Source: Living Wage Calculator, 2022, Dr. Amy K. Glasmeier and the Massachusetts Institute of Technology, http://livingwage.mit.edu/. Figures in parentheses indicate percent change from 2019 living wage expenses to 2022.
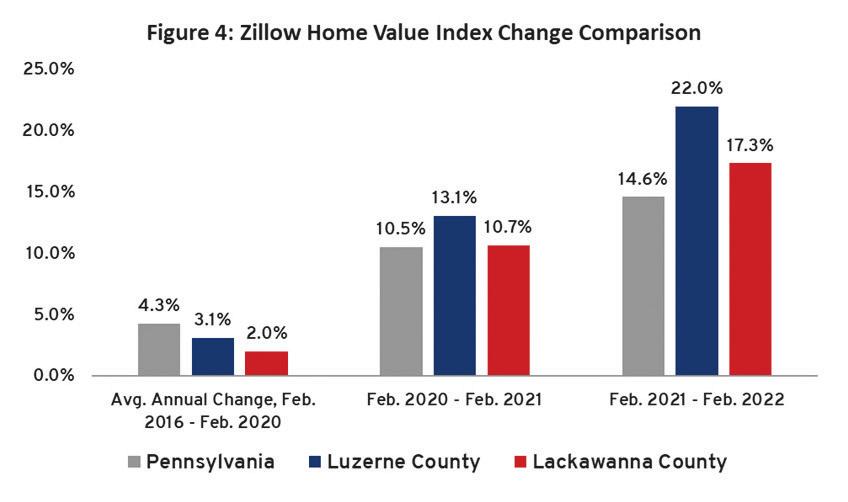
As noted above, given the national and regional focus on housing, and the dramatic pre-pandemic increases we saw in housing costs from the 2016 to the 2019 Living Wage reports (+20.2 percent), a broader analysis is necessary to understand the state of housing in NEPA. While the Living Wage Calculator uses HUD Fair Market Rents as a basis for determining housing costs, there is evidence that the increasing cost of housing in Northeastern Pennsylvania is not fully accounted for. The Institute’s 2022 study on Housing the Workforce examined housing price trends in the region. The Zillow Home Value Index (ZHVI) is a seasonally adjusted, smoothed measure of mid-market housing — single-family homes and condos between the 35th and 65th percentile in price. Beginning around May 2020, home values statewide and regionally began a rapid upward trajectory (see Figure 4). The annual average growth in ZHVI statewide from February 2016 to February 2020 was 4.3 percent per year. Locally, home values grew at a slower pace — 3.1 percent in Luzerne County and 2 percent in Lackawanna County. However, between February 2020 and 2021, this trend reversed: local home value growth outpaced statewide growth. Between 2021 and 2022, the increase in home values accelerated further, and the region again outpaced statewide growth.
Living Wage Report 2022 Update 12
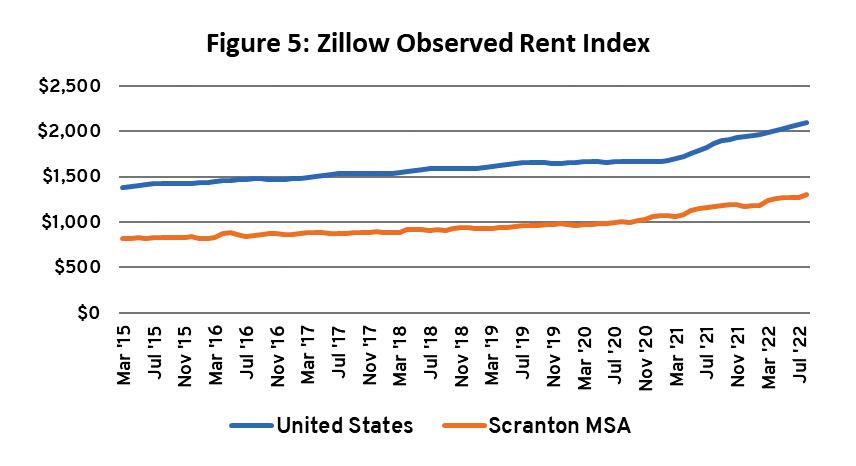
These trends have generally been reflected in rent prices as well. Based on Zillow’s Observed Rent Index (ZORI), a measure of typical observed market rent in a region, we see a dramatic increase in the average rental price in Scranton between 2020 and 2022 (see Figure 5 below). Thus, while housing costs in the Scranton area remain lower relative to other major metro areas in the Northeast, NEPA has nonetheless experienced rapid increases in rental prices, as well as housing values and costs, in this pandemic timeframe that place pressure on all residents including and especially those that do not earn a living wage. Another factor noted in The Institute’s housing research is that there has been very little residential real estate development over the course of the past 40 years. The investments that have been made are largely for market-rate housing that does not serve low- or moderateincome households, especially those who earn too much to qualify for subsidized housing. This strained supply side puts upward pressure on costs.
13
The Institute and The University of
Scranton
Other cost-of-living increases include federal and state taxes, which have risen by nearly 100 percent for the same households over that three-year span. This occurred because although there were no increases to the tax rate itself, pre-tax living wages have increased significantly, and the average tax liability increased with those wages. This put some earners into higher tax brackets. The roughly $70,000 living wage for the head of household in 2022 falls into a higher tax bracket (and thus a higher effective tax rate) than the $50,000 living wage for the same household type in 2019. Even the reduction of tax rates and increase in the size of the standard deduction in the Tax Cuts and Jobs Act were not enough to balance the higher effective tax rate of the new living wage threshold.
The data show that families need a higher living wage in 2022 than in 2019. All living costs have increased. While wages and income levels increased during the pandemic, it is not enough to offset the costs of living; therefore, many families are still not economically secure.
Northeastern PA Living Wage Analysis
As of 2020, Lackawanna County’s median household income is $54,064 — an 11.7-percent increase since the 2019 Living Wage Report (which used 2017 data). Luzerne County’s median household income is $53,194, a 7.9-percent rise during the same period. Despite these gains, both counties’ respective median household incomes still fall beneath the statewide median of $63,627 (which has grown by 11.7 percent as well). While the regional income gap showed signs of narrowing in our last report, the trend has reversed. Lackawanna County’s median household income has fallen from 15.0 percent to nearly 18.0 percent below the statewide median and Luzerne County’s median household income fell from 13.5 percent to 19.6 percent below the statewide median. The median household incomes for both counties now fall short of a living wage income for all family compositions, except those without children, indicating the increased challenges to economic security faced by families in NEPA.
In 2020, 12.2 percent of Lackawanna County and 15.1 percent of Luzerne County residents lived below the federal poverty line, respectively, as compared to 10.9 percent on the state level, according to data from the U.S. Census Bureau’s Small Area Income and Poverty Estimates. These rates represent decreases from 15.4 and 15.2 percent of people living below the federal poverty line, respectively, in 2017. For Lackawanna County, the drop in poverty was both absolute and relative. In addition to a relative decline in the poverty rate, the number of residents estimated to be living in poverty fell by approximately 3,400 from 2017 to 2020 (31,419 to 28,015). In Luzerne County, almost 1,850 fewer people lived below the poverty line in 2020 than in 2017 (46,537 to 44,690).
A narrower examination of Scranton and Wilkes-Barre, the two counties’ respective urban centers, indicates even higher poverty rates. In the city of Scranton, as of 2020, the percentage of residents living in poverty stands at 21.8 percent, a decrease from 23.6 percent in 2017. In Wilkes-Barre, the poverty rate is even higher, at 23.3 percent, but has decreased from 28.6 percent in 2017. Thus, both Wilkes-Barre and Scranton have shown decreases in the percentages of individuals below the federal poverty line.
Of course, 2020 data does not fully reflect the present day, especially given the rapidly shifting economic conditions during the COVID-19 pandemic. This decline in poverty is likely linked with creation or expansion of programs for pandemic relief, such as direct payment checks and expansion of the Earned Income Tax Credit and Child Tax Credit. However, it is anticipated that poverty levels will increase due to the general cost of living and the expiration of these temporary programs. While comparable 2021 data is not yet available, recently released 2021 data from the American Community Survey provides further evidence for a rebound in poverty — the poverty rate in Lackawanna County rose to 14 percent, slightly higher than the average of the previous five years. Further, the official definition of the poverty rate obscures the need for assistance among those who earn more than the federal
Living Wage Report 2022 Update 14
poverty level but not enough to constitute a living wage — a gap that has expanded since prior years’ reports. The region as a whole is also still home to an above-average proportion of individuals living in poverty when compared to the rest of the state.
The required annual income before taxes, and the hourly wage needed to meet the living wage threshold for a family with two adults and one child must have both adults making at least $12.39 an hour and $2,148 per month each. A single parent with one child must make an estimated $22.52 an hour to achieve a living wage.
As Figure 6 demonstrates, there is a significant gap between the existing minimum wage income and a living wage income, as shown below.
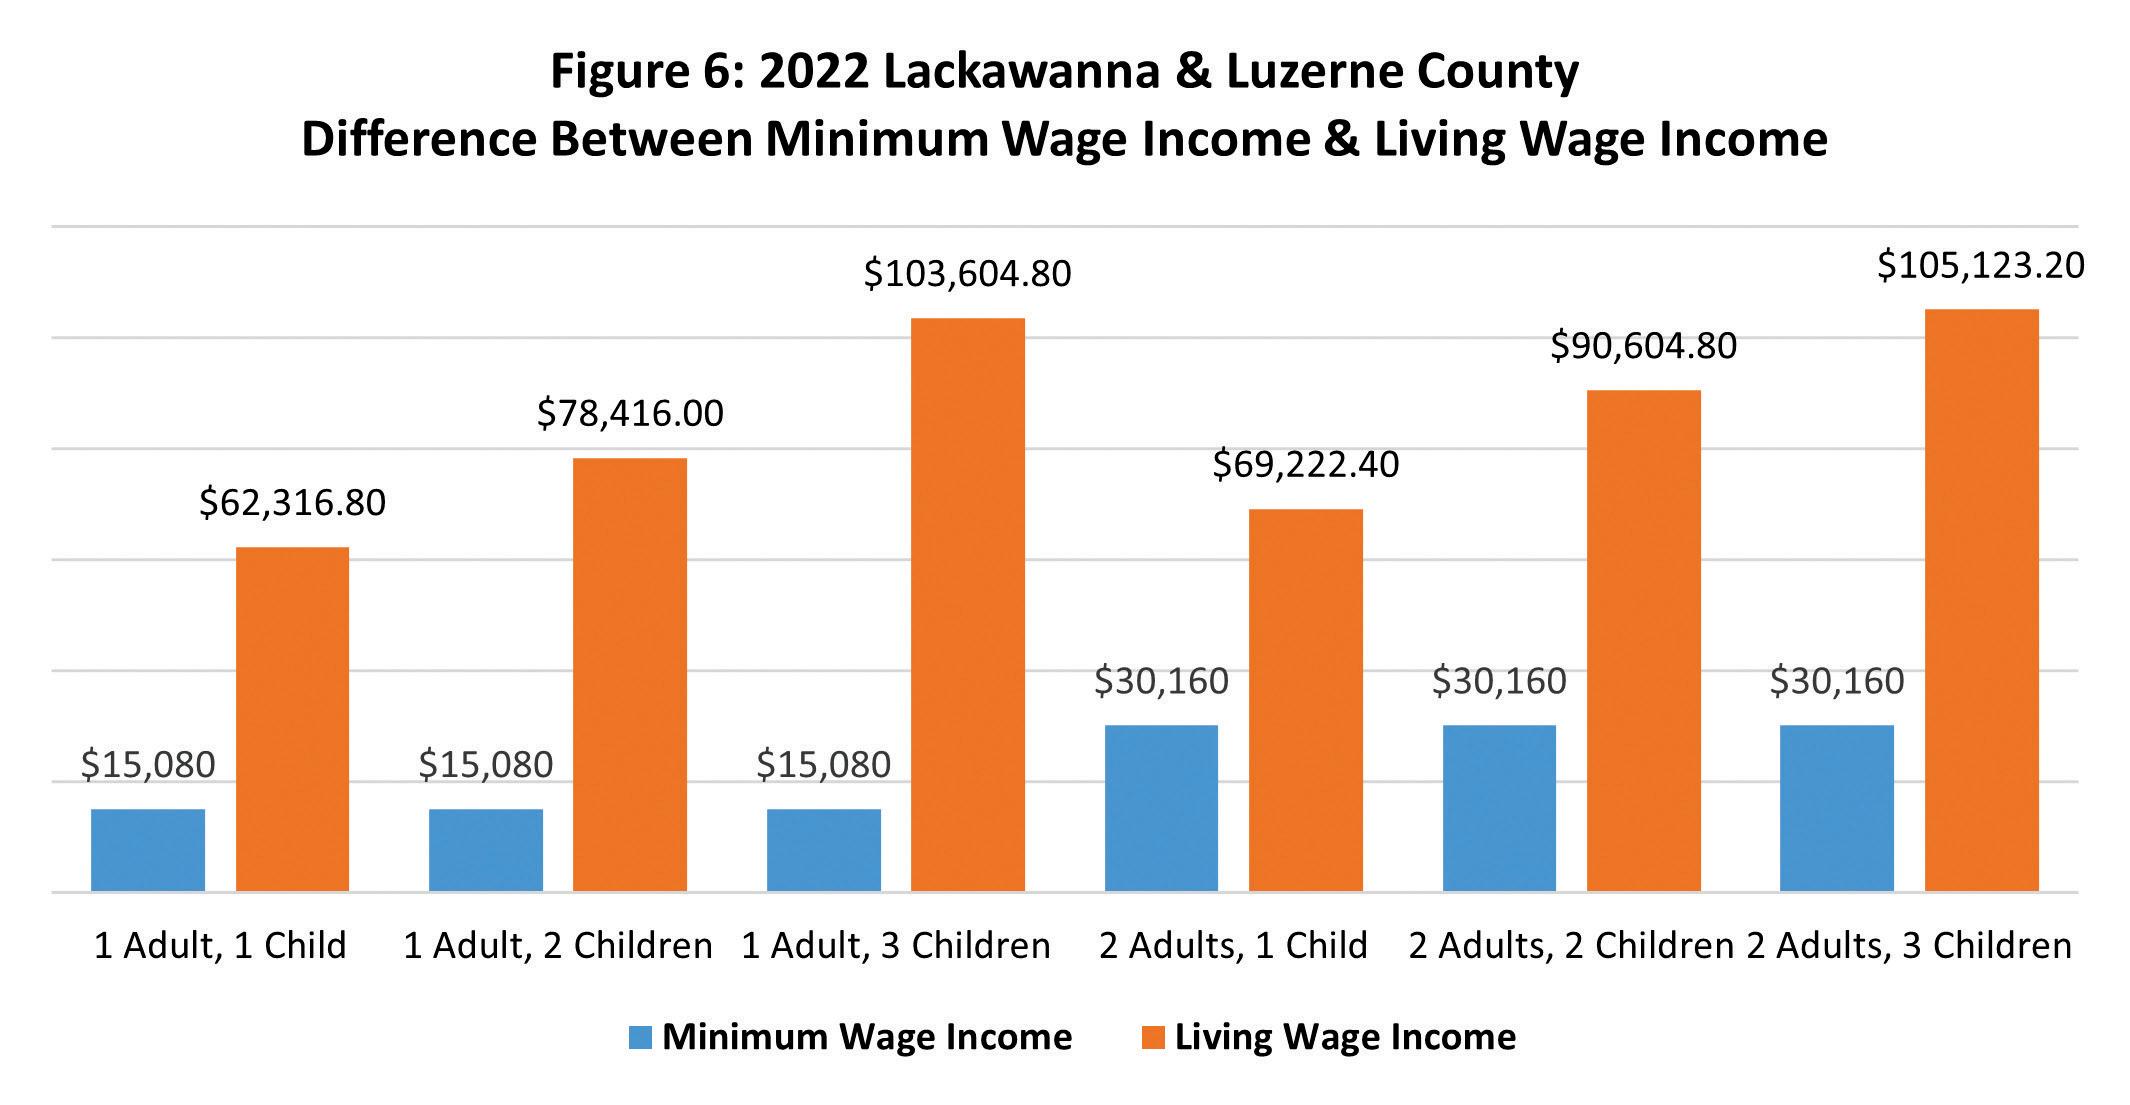
Source: Living Wage Calculator, 2022, Dr. Amy K. Glasmeier and the Massachusetts Institute of Technology, http://livingwage.mit.edu/
In five of six family compositions, the annual living wage income is at least triple that earned at the minimum wage. For the family composition of two adults with one child, the gap is smaller but still significant. Because the minimum wage has not changed since the 2016 report, the gap between minimum wage income and living wage income increased as of 2019, and again as of 2022.
Since production systems may change, political systems must keep working to structure society in such a way that everyone has a chance to contribute his or her own talents and efforts. For ‘there is no poverty worse than that which takes away work and the dignity of work’. In a genuinely developed society, work is an essential dimension of social life, for it is not only a means of earning one’s daily bread, but also of personal growth, the building of healthy relationships, self-expression and the exchange of gifts. Work gives us a sense of shared responsibility for the development of the world, and ultimately, for our life as a people.”
— Pope Francis, 2020, Encyclical Letter “Fratelli Tutti — On Fraternity and Social Friendship”
15
The Institute and The University of Scranton
When other required expenses rise more quickly than the living wage, persons affected will never get ahead. Without changes to the poverty level for important services rendered, people will end up losing access to essential resources because of an increase in their wages, and then that individual or household moves backwards. The federal government needs to tie the living wage to the benefits a person can receive. By readjusting the poverty level, a person will be able to earn a higher wage that keeps up with inflation without losing the essential services that help build lives of self-sufficiency.”
 — Jim Wansacz, Executive Director; Agency for Community EmPOWERment of NEPA (ACE)
16

17
“When other required expenses rise more quickly than the living wage, persons affected will never get ahead...”
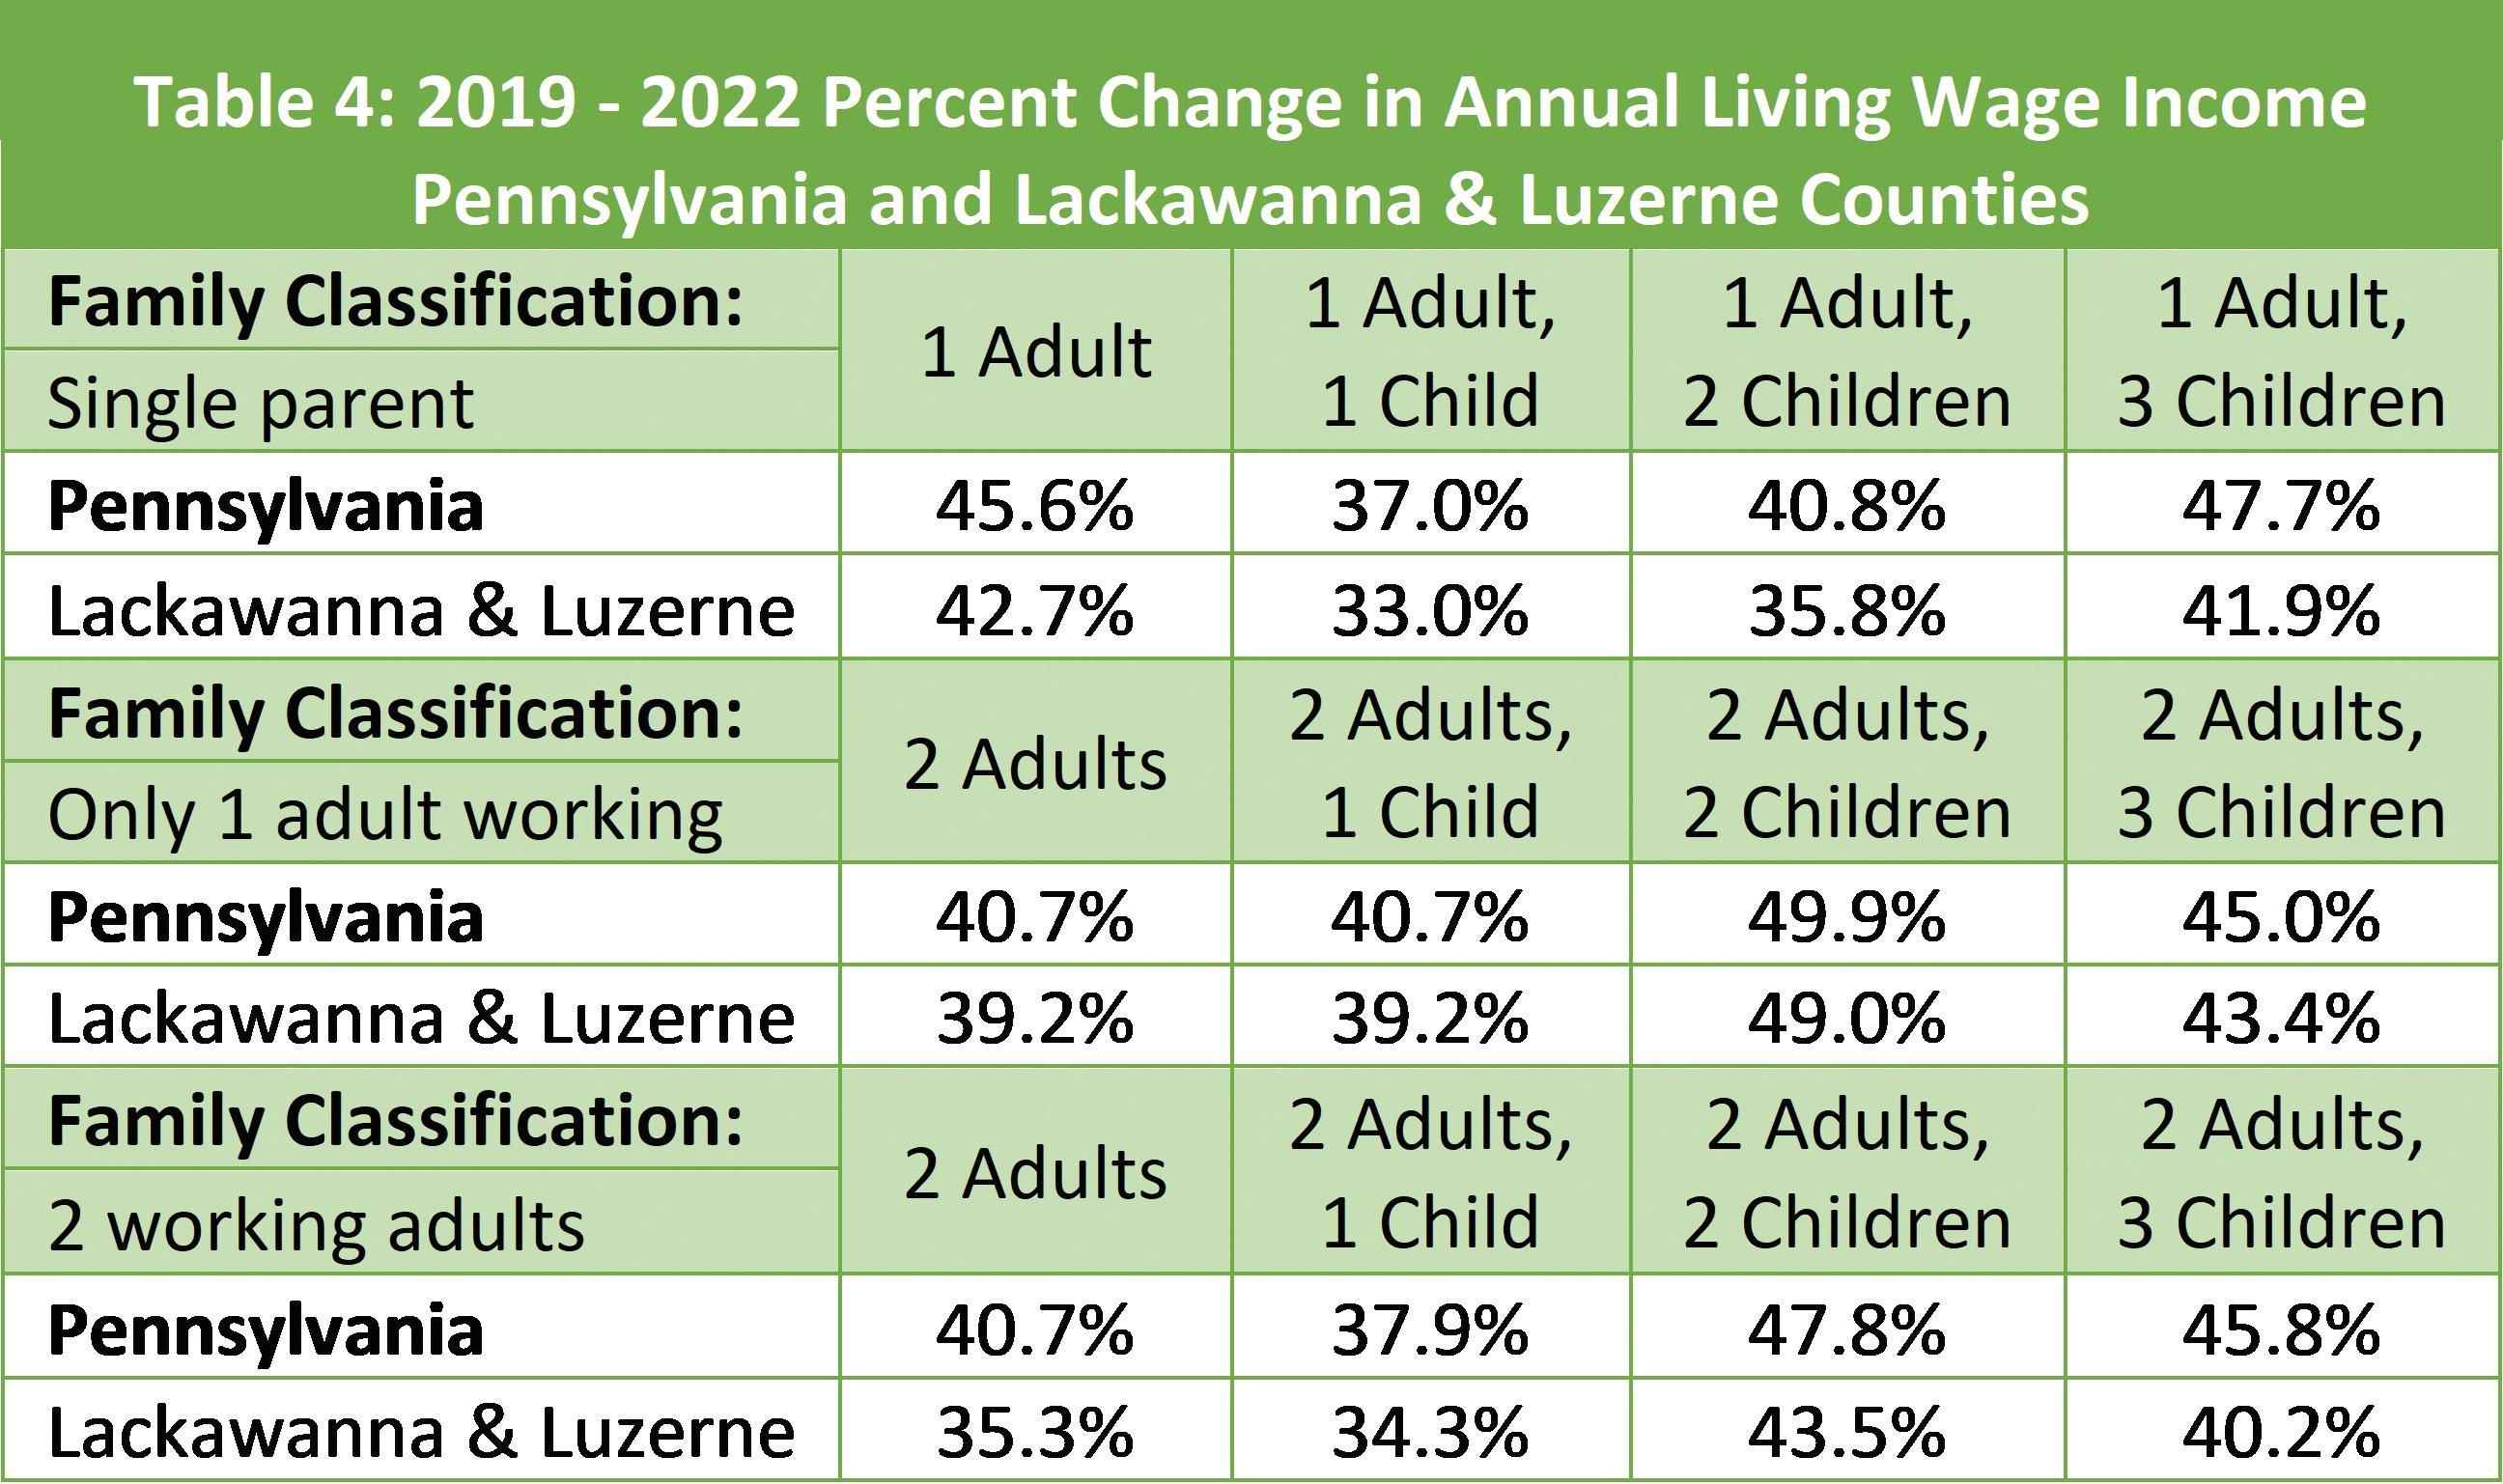
The average income for a worker in the region rose by nearly eight percent between 2016 and 2019; however, the living wage necessary increased anywhere from 7.8 to 13.3 percent in the same period of time, depending on family type. From 2019 to 2022, however, the annual living wage income to meet basic needs in the two-county area rose to a range between 33.0 to 49.0 percent as shown in Table 4. The average household income rose no more than 12.0 percent in that time. Thus, for workers or retirees with a fixed or stagnant income, the gap between the minimum wage and the living wage grows ever wider by the year.
Source: Living Wage Calculator, 2019, 2022, Dr. Amy K. Glasmeier and the Massachusetts Institute of Technology, http://livingwage.mit.edu/
Data for the year 2020 show that over 46.0 percent of households in Lackawanna County and over 47.0 percent of households in Luzerne County have incomes below $50,000. This is higher than the overall percentage for Pennsylvania as a whole, which is less than 40.0 percent. As seen in Table 2 (2022 data) previously, 10 of 12 family compositions evaluated require incomes above $50,000 to reach “living wage” incomes, including all family types with children. However, an estimated 33.3 percent of households in Lackawanna County and 33.8 percent of households in Luzerne County have an annual income under $35,000. To put that in perspective, the lowest annual living wage income for a family with children is nearly $60,000.
Without being able to increase earnings and with the rising cost of living, many of the older adults we serve use NeighborWorks as a way to maintain their homes, which is costly, to provide safety modifications so that they can continue residing in their homes instead of taking on the financial burden of facility living. However, with only their fixed income, older adults are unable to connect themselves with entitlement services to decrease non-discretionary needs such as food and utilities. Additionally, public transportation is not always available and with many older adults having mobility challenges, this makes it difficult to provide for their daily needs.”
— Mary Endrusick, Aging-In-Place Manager, NeighborWorks Northeastern Pennsylvania
Living Wage Report 2022 Update 18
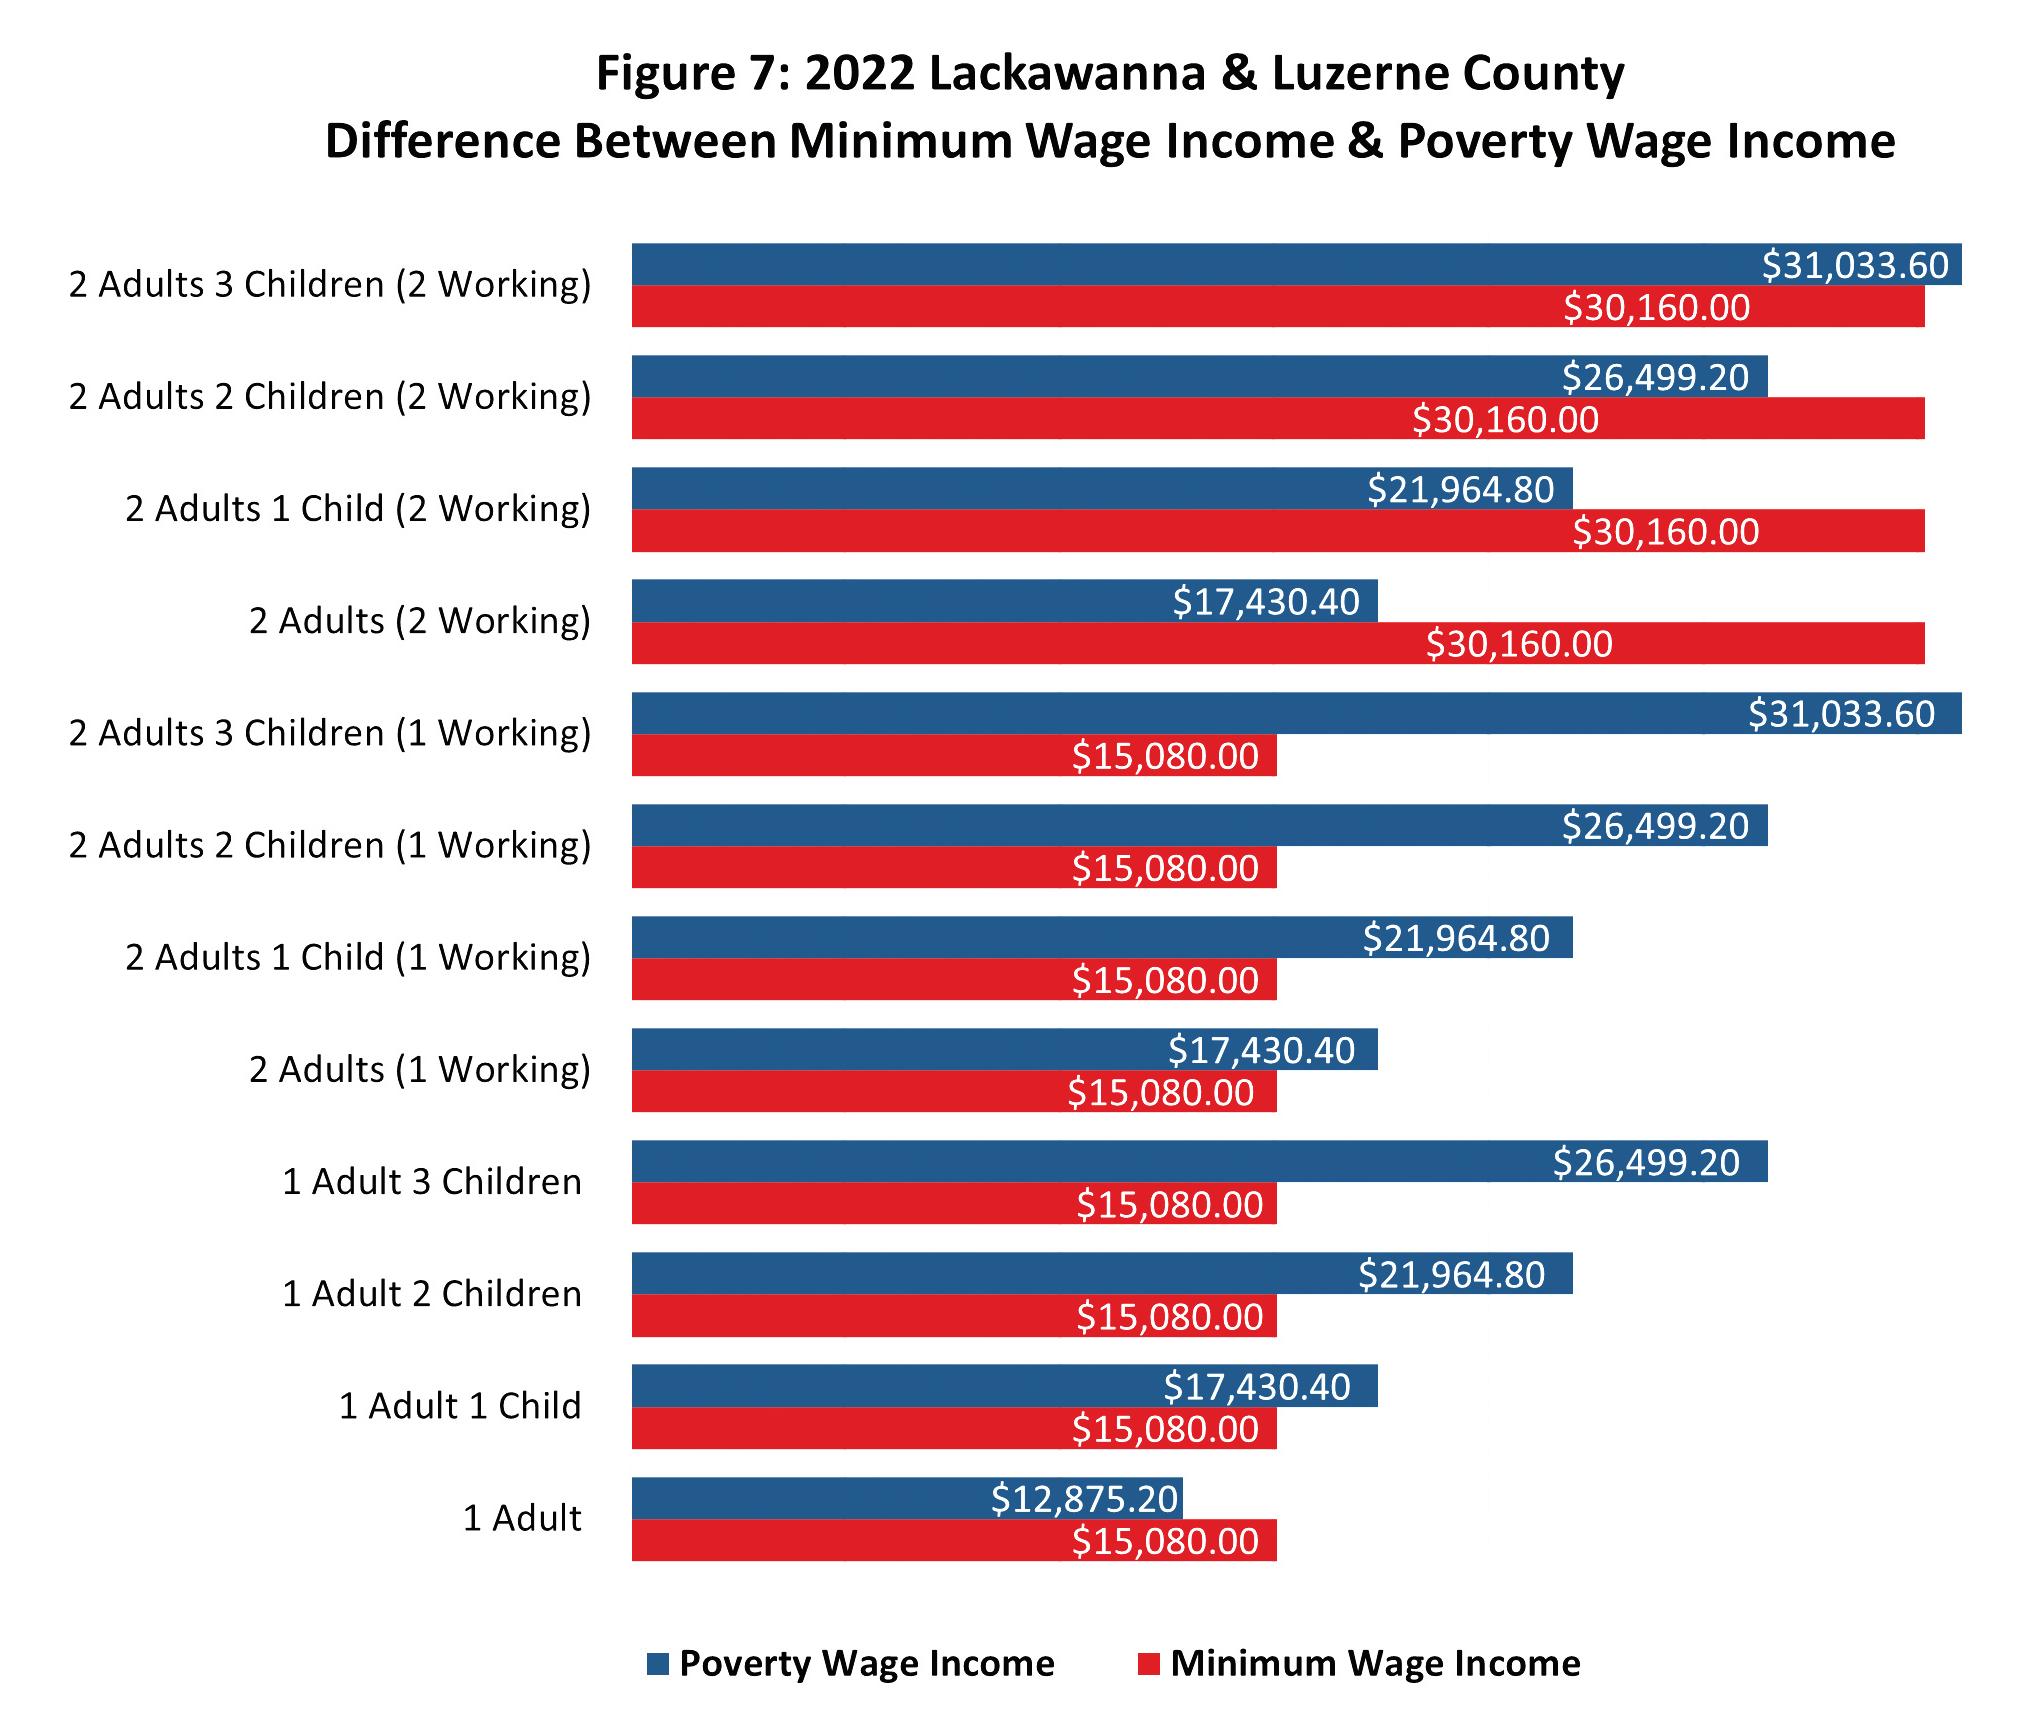
The annual income earned while working full-time at the minimum wage is $15,080. According to the Census Bureau’s 2020 American Community Survey, approximately 11.6 and 11.8 percent of households in Lackawanna and Luzerne counties (respectively) earn less than $15,000 a year. These trends have fluctuated somewhat in recent years, as approximately 14.5 percent and 13.5 percent of households in Lackawanna and Luzerne counties made less than $15,000 a year as of 2017. Whether full-time work at minimum wage provides enough income to live above the federal poverty line depends on the family composition. The difference between what a minimum wage income earns relative to the poverty threshold for each given family classification is portrayed in Figure 7.
The substantial increase in the cost of living that resulted in an increase in the living wage threshold also greatly affects households not in the workforce. Many of the same expenses that rose from prior reports, including food, housing, medical care, transportation, and other expenses, impact households on fixed incomes. While Social Security implemented a 5.9 percent cost-of-living adjustment (COLA) in 2022, costs have increased far more in several spending categories. In Lackawanna County, about four in ten households receive some or all of their income from Social Security. While the focus of this report has historically been wages of working families, the economic security of older adults and others not in the workforce is also greatly affected by rising costs.
This section demonstrates different costs based on family size, with larger families having a higher cost of living, as well as regional rates of poverty that are higher than the state and national rates. The data clearly shows the gap between living wage and minimum wages, demonstrating the inadequacy of the current PA and national minimum wage. It also shows gaps between the median household income and the living wage income for households with children, an important change from past reports that underscores family economic insecurity needs.
19
The Institute and The University of Scranton
Equity Issues
To fully understand the challenges around attaining a living wage, gender and race and ethnicity as well as immigration status must be considered. In single-parent households and households that include people of color in NEPA, we find particular disparities.
While the median household income in Northeastern Pennsylvania is about $54,000, households with Black, Asian, Hispanic/Latino, and multiracial members had median household income well below that level as shown in Table 5.
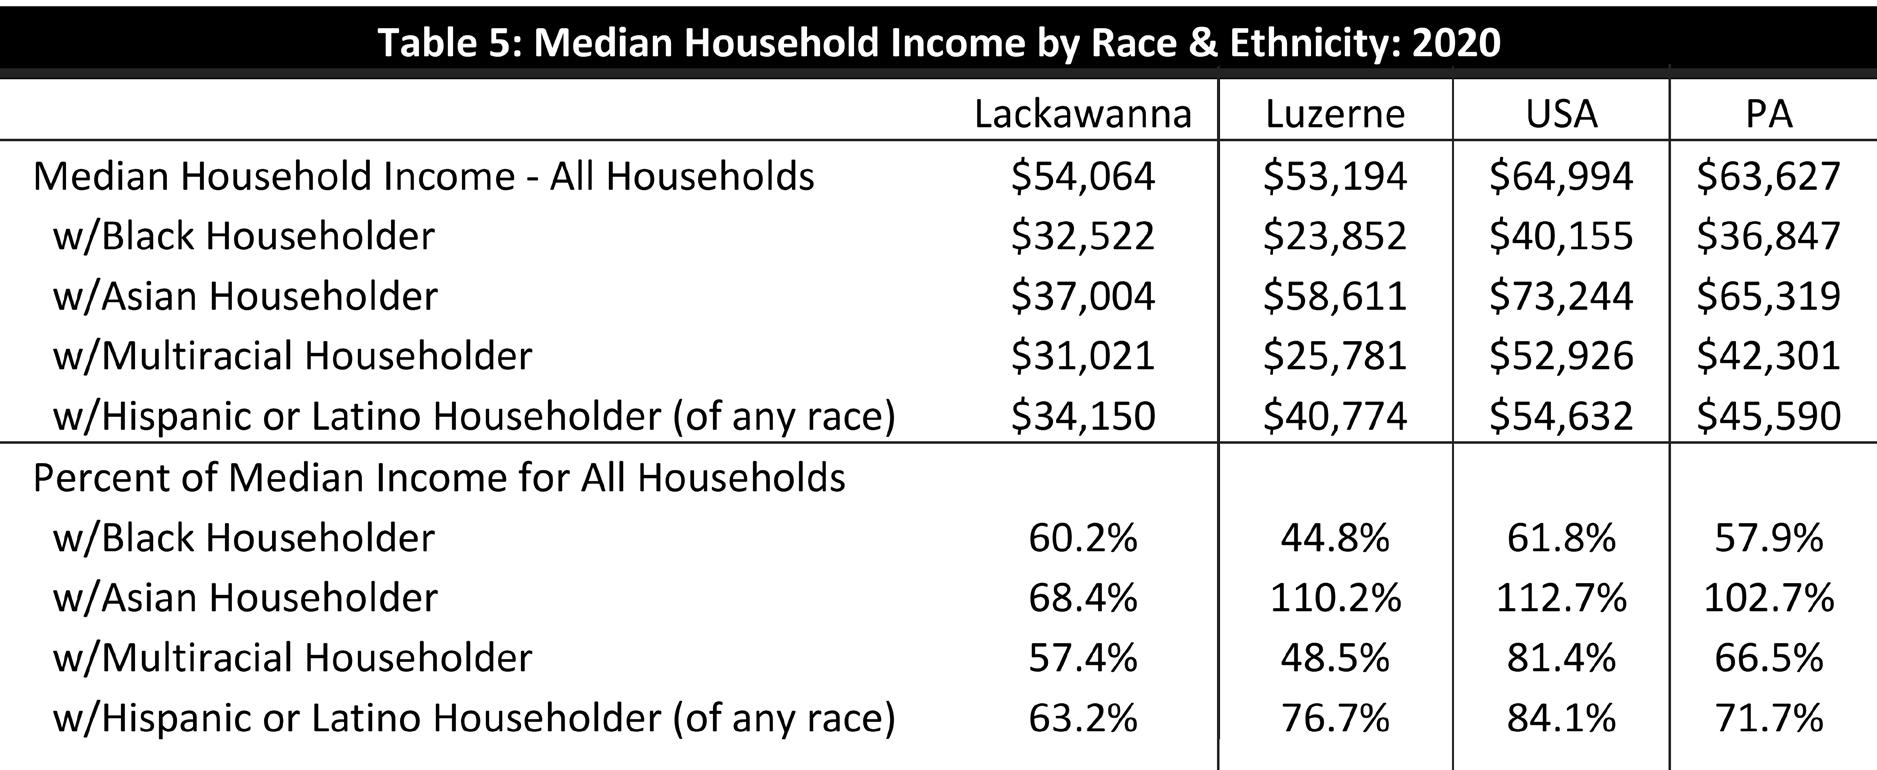
In Lackawanna County, households with Black members had a median income of just over $32,500, only about 60 percent of the overall median, while households with Asian members had a median income of $37,004, about 68 percent of the overall median. This is despite Asian households having higher-than-average incomes nationwide and statewide. In Luzerne County, Black and multiracial households had median incomes of less than half of the overall median, a larger gap than among these groups in the United States and Pennsylvania as a whole.
When looking at poverty rate by race and ethnicity In Northeastern Pennsylvania (Table 6), white non-Hispanic residents have lower poverty rates than the overall population, while Black, Hispanic/Latino, Native American, and multiracial residents were more likely to live below the poverty line. For instance, in Lackawanna County, the poverty rate for whites alone was 10.7 percent in 2020 as compared to 26.3 percent for Black or African American and 39.8 percent for Hispanic or Latino origin of any race, significant differences of 15.6 percent and 29.1 percent, respectively.
Lackawanna 2010 2020
Luzerne 2010 2020 Pennsylvania 2010 2020
Overall Population 13.2% 13.8% 13.7% 14.6% 12.4% 12.0%
White alone (not Hispanic or Latino) 11.4% 10.7% 11.2% 10.7% 9.0% 8.5%
Black or African American 39.1% 26.3% 46.5% 41.1% 27.9% 24.9%
American Indian and Alaska Native 11.4% 24.1% 25.8% 38.9% 24.3% 24.6%
Asian 11.8% 13.3% 12.4% 12.9% 14.7% 13.4%
Native Hawaiian & Other Pacific islander 0.0% 38.9% 0.0% 8.2% 27.7% 22.4%
Some other race 38.1% 27.3% 35.7% 34.1% 35.2% 29.9%
Two or more races 38.0% 31.6% 31.1% 28.0% 26.0% 18.3%
Hispanic or Latino origin (of any race) 38.3% 39.8% 40.5% 30.6% 31.0% 26.5%
Table 6: Poverty Rate by Race & Ethnicity Data
Living Wage Report 2022 Update 20
Source: US Census Bureau ACS 5-year Estimates
While this data does not provide a breakdown of how recent immigrant and refugee populations, including from African, Latin American, Middle Eastern and/or Asian countries of origin, fare in regard to median income or poverty rate, like in other Pennsylvania cities, these communities both contribute to the regional workforce and may also experience barriers in regard to language access and knowing their rights in employment, housing, education and other spheres. In Lackawanna County, there are an estimated 11,859 foreign born residents, including 48 percent born in Asia and 31 percent born in Latin America. Among immigrants overall in Lackawanna County, a comparable share live below the poverty line compared to the native born population, about 14 percent, but a much larger share of immigrants live near-poverty, at 100 to 200 percent of the poverty line: 29 percent compared to 17 percent of native born residents.
Moreover, single-parent households which are largely led by women also reveal disparities. The cost of living is often far greater than the incomes for single-worker households, despite having a lower living wage threshold. For instance, while 13.8 percent of all Lackawanna County residents live in poverty, the rate for people in all families falls to 10.3 percent, and to 4.2 percent for married-couple families. This pattern continues in Luzerne County, where 14.6 percent of all residents fall below the poverty line. Here, the rate for all families is 10.6 percent, while that for married couples is 4.3 percent. According to the “Employment Inequities and Caregiver Barriers in a Post-COVID World” study by The Institute in 2022, single-parent households have always faced greater challenges in relation to poverty. The problem is exacerbated by the fact that women earn less than men and most single-parent households are led by women; however, male-led single-parent households also experience challenges. The study details that this was a pre-COVID issue, and one further exacerbated by the pandemic.
An estimated 7.7 percent of households in Lackawanna County and 7.3 percent in Luzerne County are headed by a single parent as of 2019. In Lackawanna County, women serve as the single parent in households with children under 18 in 73.9 percent of cases, compared to 72.6 percent in Luzerne. Female-led households with children are far more predisposed to poverty, as the poverty rate for these households stands at 38.0 percent and 43.6 percent for Lackawanna and Luzerne counties, respectively. There are an estimated 18,133 such households in the region.
According to the Census Bureau’s 2020 Small Area Income & Poverty Estimates (SAIPE), 12.2 percent of Lackawanna County residents and 15.1 percent of Luzerne County residents live below the poverty line — a total of 68,836 people. This is down from 2017 estimates, which cited 71,334 individuals living in poverty. Though the county-level poverty rates differ slightly between datasets due to differences in timing, methodology, and margins of error in sampled data, a general trend emerges: the regional population living in poverty remains disproportionately high when compared to state averages, and signs of improvement are mixed. The region’s relatively high level of poverty can be accounted for, in part, by the significant number of single-parent families (38.4 percent and 41.6 percent of children in Lackawanna and Luzerne counties, respectively, live in single-parent households, as compared to 33.5 percent for the state), which have a far higher rate of poverty than other families. However, many individuals and families continue to struggle regardless of family composition.
A lot of people come to us at the Black Scranton Project for advice, support, and resources. We face many challenges trying to live out our mission for them. Our namesake alone has been a factor in disqualification for support. Often, this area sees the Black and Brown community as a ‘liability’ rather than an ‘asset’ — these systematic biases need to be dismantled to make room for policy progress. We particularly need action around landlords and rent increases. We’re seeing residents’ rent rise dramatically, but low wages, sub-par housing conditions, and absentee landlords continue to be the norm.”
— Glynis Johns, Founder & CEO, Black Scranton Project
The Institute and The University of Scranton
21
of economic insecurity, poverty,

a living wage’ affect our member organizations and business community particularly as it relates to workforce recruitment, retention, and talent pipeline development for employers. While wages and job opportunities have increased for some employees, we see a need for further funding for workforce development, including career pathways and readiness support, improved public transportation, and more stable child care, which has seen a staffing shortage.”
Living Wage Report 2022 Update 22
The issues
and
— Amy S Luyster, Vice President, The Greater Scranton Chamber of Commerce
“The issues of economic insecurity, poverty, and a ‘living wage’ affect our member organizations and business community...”
Who are the Minimum Wage Earners & Others Who Lack a Living Wage?
What are the Available Jobs and Wages?
According to the U.S. Department of Labor, American workers earning minimum wage or below tend to be female, 16 to 24 years old, high school educated or less, and never married. The percentage of hourly paid workers with wages at or below the minimum wage did not differ significantly by race or ethnicity. As of 2020, there were 1.1 million workers with wages at or below the federal minimum wage, which is 1.5 percent of all hourly paid workers in America. This has been decreasing over the years, as it was 2.3 percent in 2017. In Pennsylvania, 11.0 percent of minimum wage workers are single parents, and an additional 14.0 percent are married with at least one or more children.
It is important to note that these figures do not include near-minimum wage workers — those who earn more than minimum wage yet still fall below the living-wage threshold. According to the Bureau of Labor Statistics, the occupations with the highest percentage of workers earning the minimum wage or below are service occupations, including food preparation and serving-related occupations. Over eight percent of those in the leisure and hospitality industry earned the minimum wage or below; the majority of these workers were in restaurant and food services.
In Lackawanna and Luzerne counties, five occupational categories with average salaries beneath the living wage for a single, childless worker ($31,616) include farming, fishing and forestry occupations ($20,400 and $20,800, for Lackawanna and Luzerne counties, respectively), food service occupations ($21,600 for both), personal care and service ($23,900 and $23,700), building and grounds cleaning and maintenance occupations ($27,500 and $27,600), sales and related occupations ($28,400 for both), and healthcare support occupations ($28,600 and $29,000). These six categories employ 29,033 workers in Lackawanna County and 37,952 in Luzerne County. Almost none of the broad categories of occupations, as defined by 2-digit SOC codes, in either Lackawanna or Luzerne counties, have a sufficient average salary to provide a living wage for a single worker supporting three children ($103,605). However, the mean salary in management occupations, buoyed by high figures in the top ten of salaries, does clear that mark ($105,900 and $105,600 in Lackawanna and Luzerne counties, respectively).
Over half of healthcare support positions (employing 16 percent of the two-county workforce) earn incomes at or beneath the living wage for a single, childless adult — roughly the same proportion as workers in sales and related occupations. Furthermore, approximately three-quarters of workers with personal care and service and food preparation and serving-related occupations earn incomes beneath the living wage threshold for a single, childless adult in Lackawanna or Luzerne counties.
Five major job categories of the NEPA economy are well-positioned for employment growth, including healthcare, business and financial operations, management, architecture and engineering, and computer and mathematical occupations. These categories include some family-sustaining jobs. Within the healthcare industry, there is significant demand for practitioners and technical occupations (average wages of $80,500 and $79,000 in Lackawanna and Luzerne counties, respectively), with a projected shortage of 157 jobs over the next 10 years in the two-county area. In private businesses, management occupations (average wages of $105,600 and $105,900, respectively) have a projected supply shortage of 76 employees, while business and financial operations occupations ($67,000 average wage) are projected to need 52 extra workers. Computer and mathematical occupations (average wages of $77,600 and $77,200, respectively) will face a shortage of 43 employees. These positions largely require at least a four-year degree in the field, but there are occupations with a growing demand and livable wages that do not. These include installation, maintenance and repair ($47,000 average salary), and construction and extraction occupations ($51,850 average salary).
The Institute and The University of Scranton
23
New economic development policies should seek to attract employers close to existing housing. Development partners should look for smaller sites integrated into existing neighborhoods. Creation of more multi-use zoning will allow for greater employment opportunities closer to where people live, rather than farther-off sites that put heavy transportation costs onto employees. Stronger public transportation, especially buses that respond to the work schedules and locations of today, is required. Improved sidewalks, trails, and bike lanes will also allow people safe and reliable transportation alternatives.”
— Gus Fahey, President, Valley in Motion
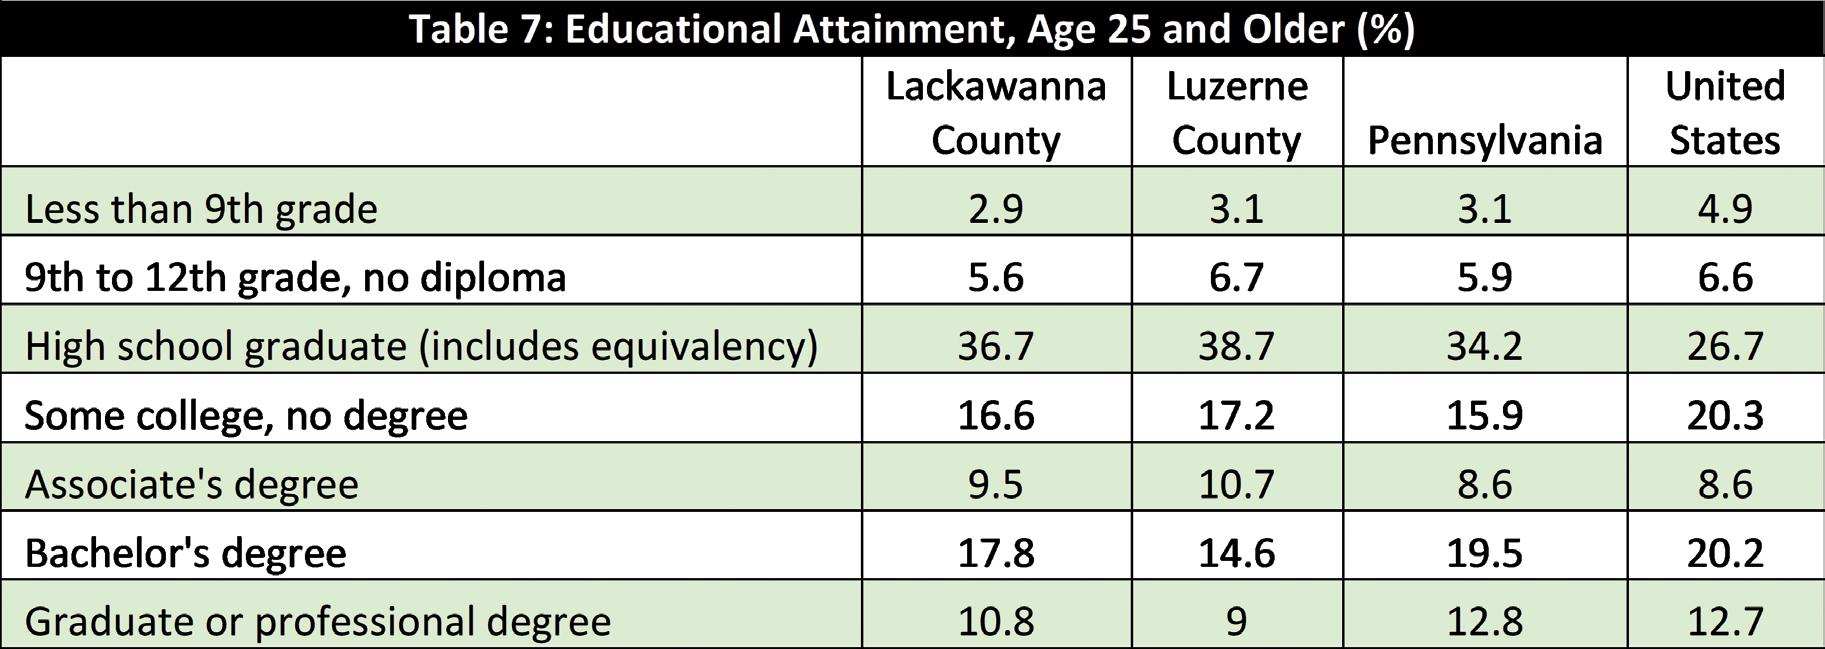
Higher education attainment in Northeastern Pennsylvania lags behind the state and national averages, and numerous studies indicate a correlation between higher wages and college degree attainment. According to U.S. Census Bureau data for people 25 years and older, 28.7 percent of individuals in Lackawanna County and 23.6 percent of individuals in Luzerne County have a bachelor’s degree or higher, as compared to 32.3 percent at the state level and 32.9 percent at the national level. However, the percentage of higher-educated individuals has grown since publication of the previous report. At the same time, while high school dropouts have trended steadily downward in the region from the 2016-2017 school year through 2020-2021, the lingering impacts of the pandemic on education could be contributing to disparities not fully captured in available data. An Institute study on pandemic impacts on education and the workforce concluded that “The COVID-19 pandemic has affected and will continue to affect the delivery of knowledge and skills at all levels of education. Although many children and adult learners will likely compensate for this interruption of traditional educational services and adapt to new modalities, some will struggle.” Some local agencies report increased interest in GED programs among youth; altogether, the impacts of the pandemic on K-12 and higher education are likely to continue to reverberate for some time.
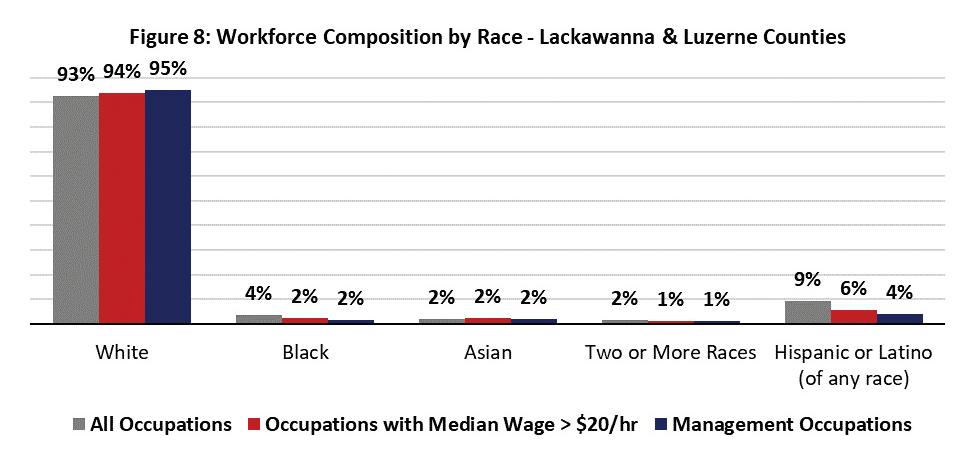
While race/ethnicity is not a significant factor among minimum wage earners, it is a factor in broader income disparities and differences in wages that connect to job type. Black, multiracial, and Hispanic/Latino workers are underrepresented among management occupations, and occupations with a median wage above $20 per hour.
Living Wage Report 2022 Update 24
White workers comprise 93 percent of the overall workforce in the two-county region, but 94 percent of workers in occupations where the median wage is greater than $20 per hour and 95 percent of workers in management occupations. Conversely, Black workers comprise four percent of the workforce but only two percent of workers in management and higher-wage occupations. Hispanic or Latino workers comprise nine percent of the workforce, but only four percent of management workers are Hispanic or Latino.
Differences across racial and ethnic groups can also be found in homeownership rates. While about 70 percent of white, non-Hispanic households in the region own their homes as opposed to renting, this is true for only 16 percent of Black households in Lackawanna County and 20 percent in Luzerne County. Similarly, only 21 percent of Hispanic or Latino households in Lackawanna County and 34 percent in Luzerne County are homeowners. Homeownership is frequently a means to build wealth among families. Furthermore, those who rent their homes are likely to be most vulnerable to rapid inflationary pressures, as rents can quickly increase beyond the level of affordability.
8: Homeownership Rate by
Ethnicity, Nativity
Owner-occupied housing units 66.1% 64.3% -2.7% 69.9% 68.0% -2.8% 71.0% 68.9% -3.0%
White alone 68.8% 68.8% 0.1% 72.2% 72.7% 0.7% 75.5% 74.5% -1.3%
Black or African Americam 21.4% 16.1% -24.6% 21.5% 20.3% -5.4% 47.4% 43.2% -8.9%
American Indian and Alaska Native 0.0% 54.4% — 0.0% 51.6% — 55.1% 52.3% -5.0%
Asian 50.8% 42.4% -16.6% 67.0% 65.0% -3.1% 57.3% 58.4% 1.9%
Native Hawaiian & Other Pacific Islander — — — — 0.0% — — 41.8% —
Some other race 22.6% 36.8% -62.4% 41.4% 36.5% -11.9% 39.5% 39.4% -0.4%
Two or more races 41.5% 31.9% -23.1% 50.8% 30.9% -39.1% 49.5% 45.0% -9.1%
Hispanic or Latino origin 17.2% 20.8% -20.6% 36.1% 33.9% -6.2% 43.6% 41.2% -5.4%
Foreign born 47.4% 42.1% -11.2% 56.8% 45.0% -20.8% 59.3% 56.5% -4.7%
Native born 66.9% 65.5% -2.1% 70.5% 69.7% -1.1% 71.8% 69.9% -2.6%
The
The
of Scranton 25
Institute and
University
Table
Race,
Data Source: US Census Bureau ACS 5-year Estimates Lackawanna Luzerne Pennsylvania 2010 2019 % Chng. 2010 2019 % Chng. 2010 2019 % Chng.
The poor are not people ‘outside’ our communities, but brothers and sisters whose sufferings we should share, in an effort to alleviate their difficulties and marginalization, restore their lost dignity and ensure their necessary social inclusion. On the other hand, as we know, acts of charity presuppose a giver and a receiver, whereas mutual sharing generates fraternity. Almsgiving is occasional; mutual sharing, on the other hand, is enduring. The former risks gratifying those who perform it and can prove demeaning for those who receive it; the latter strengthens solidarity and lays the necessary foundations for achieving justice.”
— Pope Francis, 2021, “Message of His Holiness Pope Francis for the Fifth World Day of the Poor”

26
“The poor are not people ‘outside’ our communities, but brothers and sisters whose sufferings we should share, in an effort to alleviate their difficulties and marginalization...”
Resources for Economically Insecure Families
Federal, state, and local resources are available for individuals and families who do not earn a living wage. Although many perceive these resources as available to only those living in extreme poverty, many programs aid working families and individuals who do not earn a living wage. That said, many social programs’ income eligibility requirements are so low that many families unable to earn a living wage do not qualify for assistance. This creates a gap in services, in which individuals and families who need assistance are unable to access the help they need. Additionally, as the living wage has grown rapidly due to inflation, income limits for some programs have not been adjusted as quickly.
To deliver these services, the government often relies on non-profit social service organizations, with nearly 120 of these organizations in the Scranton area alone. Programs for economically insecure families include, but are not limited to the following:
CHILD AND DEPENDENT CARE TAX CREDIT

• FEDERAL: The federal Child and Dependent Care Tax Credit helps families defray the cost of providing care to children and other dependents. The credit is worth between 20 percent—35 percent from up to $3,000 of expenses paid for one child/dependent or up to $6,000 of expenses paid for two or more children/dependents. In 2021, this credit was expanded by the American Rescue Plan to include up to $8,000 paid for care of one child/ dependent or up to $16,000 paid for care of two or more children/dependents. This expanded credit has since expired.
• STATE: Starting in 2023, Pennsylvania residents will be able to claim childcare expenses on their state returns, in addition to the amount claimed on their federal tax returns. The state-level Child and Dependent Care Enhancement program is modeled on the federal tax credit, with the same eligibility requirements and rules.
• Effectiveness: Although the intent of these tax credits/rebates is to offset the cost of childcare, “the existing structure of the credit fails to meaningfully help low-income families afford childcare.” 34 The 2021 expansion of the credit allowed more assistance, but further expansion and restructuring of the credit is necessary.

CHILD CARE WORKS SUBSIDIZED CHILD CARE PROGRAM
• The Child Care Works program is a subsidized childcare program that helps low-income families pay for childcare.
• Effectiveness: Childcare subsidies reduce costs for families and help to ensure the employment of parents. Additionally, subsidies may increase the quality of care for low-income children.35
27
The Institute and The University of Scranton
CHILD TAX CREDIT
• The federal Child Tax Credit is intended to help supplement the income of working families with children. The credit is worth up to $2,000 per eligible child (through age 16) and is claimed on a federal tax return. The credit was expanded in 2021 under the American Rescue Plan to provide $3,600 for children under age six and $3,000 for children ages six through 17. The expansion also allowed families to claim up to half of the credit in advance through monthly payments, and it allowed families with little or no income to claim the credit. As with the expanded childcare tax credit, the expansion of the Child Tax Credit has also since expired.
• Effectiveness: According to the Economic Policy Institute 36, the Child Tax Credit significantly reduces taxes on lowand middle-income families. Additionally, the Brookings Institute 37 found that the expansion of the tax credit under the 2021 American Rescue Plan led to “improved nutrition, decreased reliance on credit cards…and also made long-term educational investments for both parents and children.” The monthly payments allowed families to use the tax credit to cover routine expenses, reducing child poverty.
HEAD START AND EARLY HEAD START
• Head Start is a federally funded program that offers early childhood education and health/social services to families with children between three and five years old.
• Early Head Start serves pregnant women and families with children under the age of three.
• Effectiveness: Head Start improves educational outcomes and increases the chances that a child graduates high school, attends college, and obtains employment.38
SCHOOL NUTRITION PROGRAMS
• Children from qualifying lower-income families can receive a free or reduced-price school breakfast, lunch, and after school snack.
• Effectiveness: The importance of school meals became widely apparent during the COVID-19 pandemic when school closures caused significant increases in child hunger. School meals provided free to all children improve child nutrition and improve students’ academic performance and discipline.39
SUPPLEMENTAL NUTRITION ASSISTANCE PROGRAM (SNAP)
• The Supplemental Nutrition Assistance Program is a program intended to supplement the food budget of lowincome households. During the COVID-19 pandemic, many children did not attend school in person, limiting their access to free or reduced-price meals. In response, the federal government implemented Pandemic Electronic Benefit Transfer (P-EBT), which allowed eligible school-aged children to receive temporary nutrition benefits loaded onto EBT cards to purchase food.
• Effectiveness: According to the Center on Budget and Policy Priorities 40, SNAP is a highly effective and efficient program. Eligibility requirements are less restrictive than many other social benefits programs, allowing a “wide range of low-income households, including families with children, elderly people, and people with disabilities” to participate. SNAP is effective in improving the health and well-being of children and families and alleviating food insecurity.
Living Wage Report 2022 Update 28
HOUSING VOUCHER PROGRAMS
• Housing choice vouchers, which subsidize the costs of housing for low-income individuals and families, are available to families whose income does not exceed 50 percent of the median income for the county or metropolitan area in which the family lives.
• Effectiveness: Housing voucher programs reduce homelessness, help to alleviate poverty, increase safety, and improve the long-term educational and health benefits of children and families. However, due to lack of funding, “only about one in four families eligible for a voucher receives any form of federal rental assistance.” 41
CITY OF SCRANTON AND LACKAWANNA COUNTY HOMEBUYER PROGRAMS
• Both the Scranton and Lackawanna County Homebuyer programs offer first-time house buyers a forgivable loan to help with down payments and/or closing expenses.
• Effectiveness: Homeownership is one of the primary means through which families build long-term financial security. According to the Urban Institute, down payments are one of the most significant barriers in homeownership for firsttime buyers. 42 Alleviating the burden of securing down payments helps to open homeownership to low- and middleincome families. Additionally, this assistance helps families that have been affected by historical and continuing housing discrimination because of race/ethnicity.
LOW-INCOME HOME ENERGY ASSISTANCE PROGRAM (LIHEAP)
• LIHEAP helps lower-income households to help pay energy bills.
• Effectiveness: Participation in the program increases energy security and protects participants from dangerous utility shut offs. 43
HEALTHCARE SUBSIDIES AND MEDICAL ASSISTANCE PROGRAMS
• HEALTHCARE SUBSIDIES: The federal health insurance marketplace created by the Affordable Care Act offers the public the opportunity to enroll in a variety of health insurance plans. Many households below the living wage threshold that do not qualify for other social programs can qualify for reduced healthcare premiums on Healthcare.gov.
• MEDICAL ASSISTANCE PROGRAMS: Medicaid is a healthcare program for low-income Americans that pays for healthcare services (sometimes with co-pays or small premiums).
• Effectiveness: Medical assistance programs are shown to improve both immediate and long-term health across a variety of indicators (especially for children and people of color). In comparison to private insurance, “Medicaid also provides more comprehensive benefits [and] significantly lower out-of-pocket cost to beneficiaries,” all while providing “access to care that is comparable to private insurance.” States that have expanded their medical assistance programs have better health outcomes than those that have not. 44
29
The Institute and The University of Scranton
The
Institute for Public Policy & Economic Development
EARNED INCOME TAX CREDIT (EITC)
• The Earned Income Tax Credit is a federal program that is intended to supplement the income of low- to moderateincome workers and families.
• Effectiveness: As is the case with the Child Tax Credit, the EITC helps to alleviate poverty and provides health and psychological benefits by providing a cash benefit directly to families.45 Additionally, according to the Centers for Disease Control and Prevention, “23 states with an EITC saw a connection between EITC and reduction in low birthrate by 4 to 11 percent.” 46 PA does not currently have a state-level EITC benefit.
TEMPORARY ASSISTANCE TO NEEDY FAMILIES (TANF)
• The Temporary Assistance to Needy Families program is a block grant program that provides federal funding to the states to provide cash assistance and social support to families with children.
• Effectiveness: Notably, the cash benefits provided by the states via TANF are small and insufficient in covering the basic needs of recipients. 47 Typically, cash assistance is a less popular policy proposal than in-kind benefits, such as food assistance, in which the spending of benefits is tightly regulated. That being said, cash assistance is a highly effective intervention in addressing poverty. Thus, to be most effective, TANF cash assistance should be easier to access and include more benefits.
Starting in March 2020, the federal, state, and local governments expanded a number of the above programs to include more generous benefits and to include an expanded number of recipients. These expansions were meant to address the COVID-19 pandemic and the accompanying economic challenges. Many of those program expansions have since lapsed. Evaluations of the current and future success of these programs should consider the return of these programs and their benefits to their pre-COVID status.
Residents who could afford a modest apartment working in the service industries not only lost wages during the height of the pandemic, but they also soon discovered that area rents have far exceeded fair market rates. We are now servicing this population through rental and utility assistance funds provided by various pandemic-related programs that are slated to end or the funds exhausted by the end of 2022. Affordable housing and expanded public transportation are required. If public transportation cannot be expanded, having housing co-located with services, healthy groceries and other providers is a sustainable model. Scranton is undergoing a renaissance of sorts with luxury apartments in high demand. While this is positive for the overall economy, the gentrification that is occurring, as a result, is increasing wage inequity. Without stable affordable housing, no other polices can be successfully implemented.”
— William Browning, Executive Director, Lackawanna County Department of Health & Human Services
Living Wage Report 2022 Update 30
Individuals seem to be struggling more with the rising costs of everything, unable to make ends meet with what they are earning. When their wages do rise, they may lose SNAP and medical benefits. Some may be able to purchase medical insurance, but deductibles are often too large, creating a deterrent to seeking care. In recent years, we have seen the needs we address at Scranton Primary increase.”
31
— Joseph Hollander, CEO, Scranton Primary Health Care
“Individuals seem to be struggling more with the rising costs of everything, unable to make ends meet...”
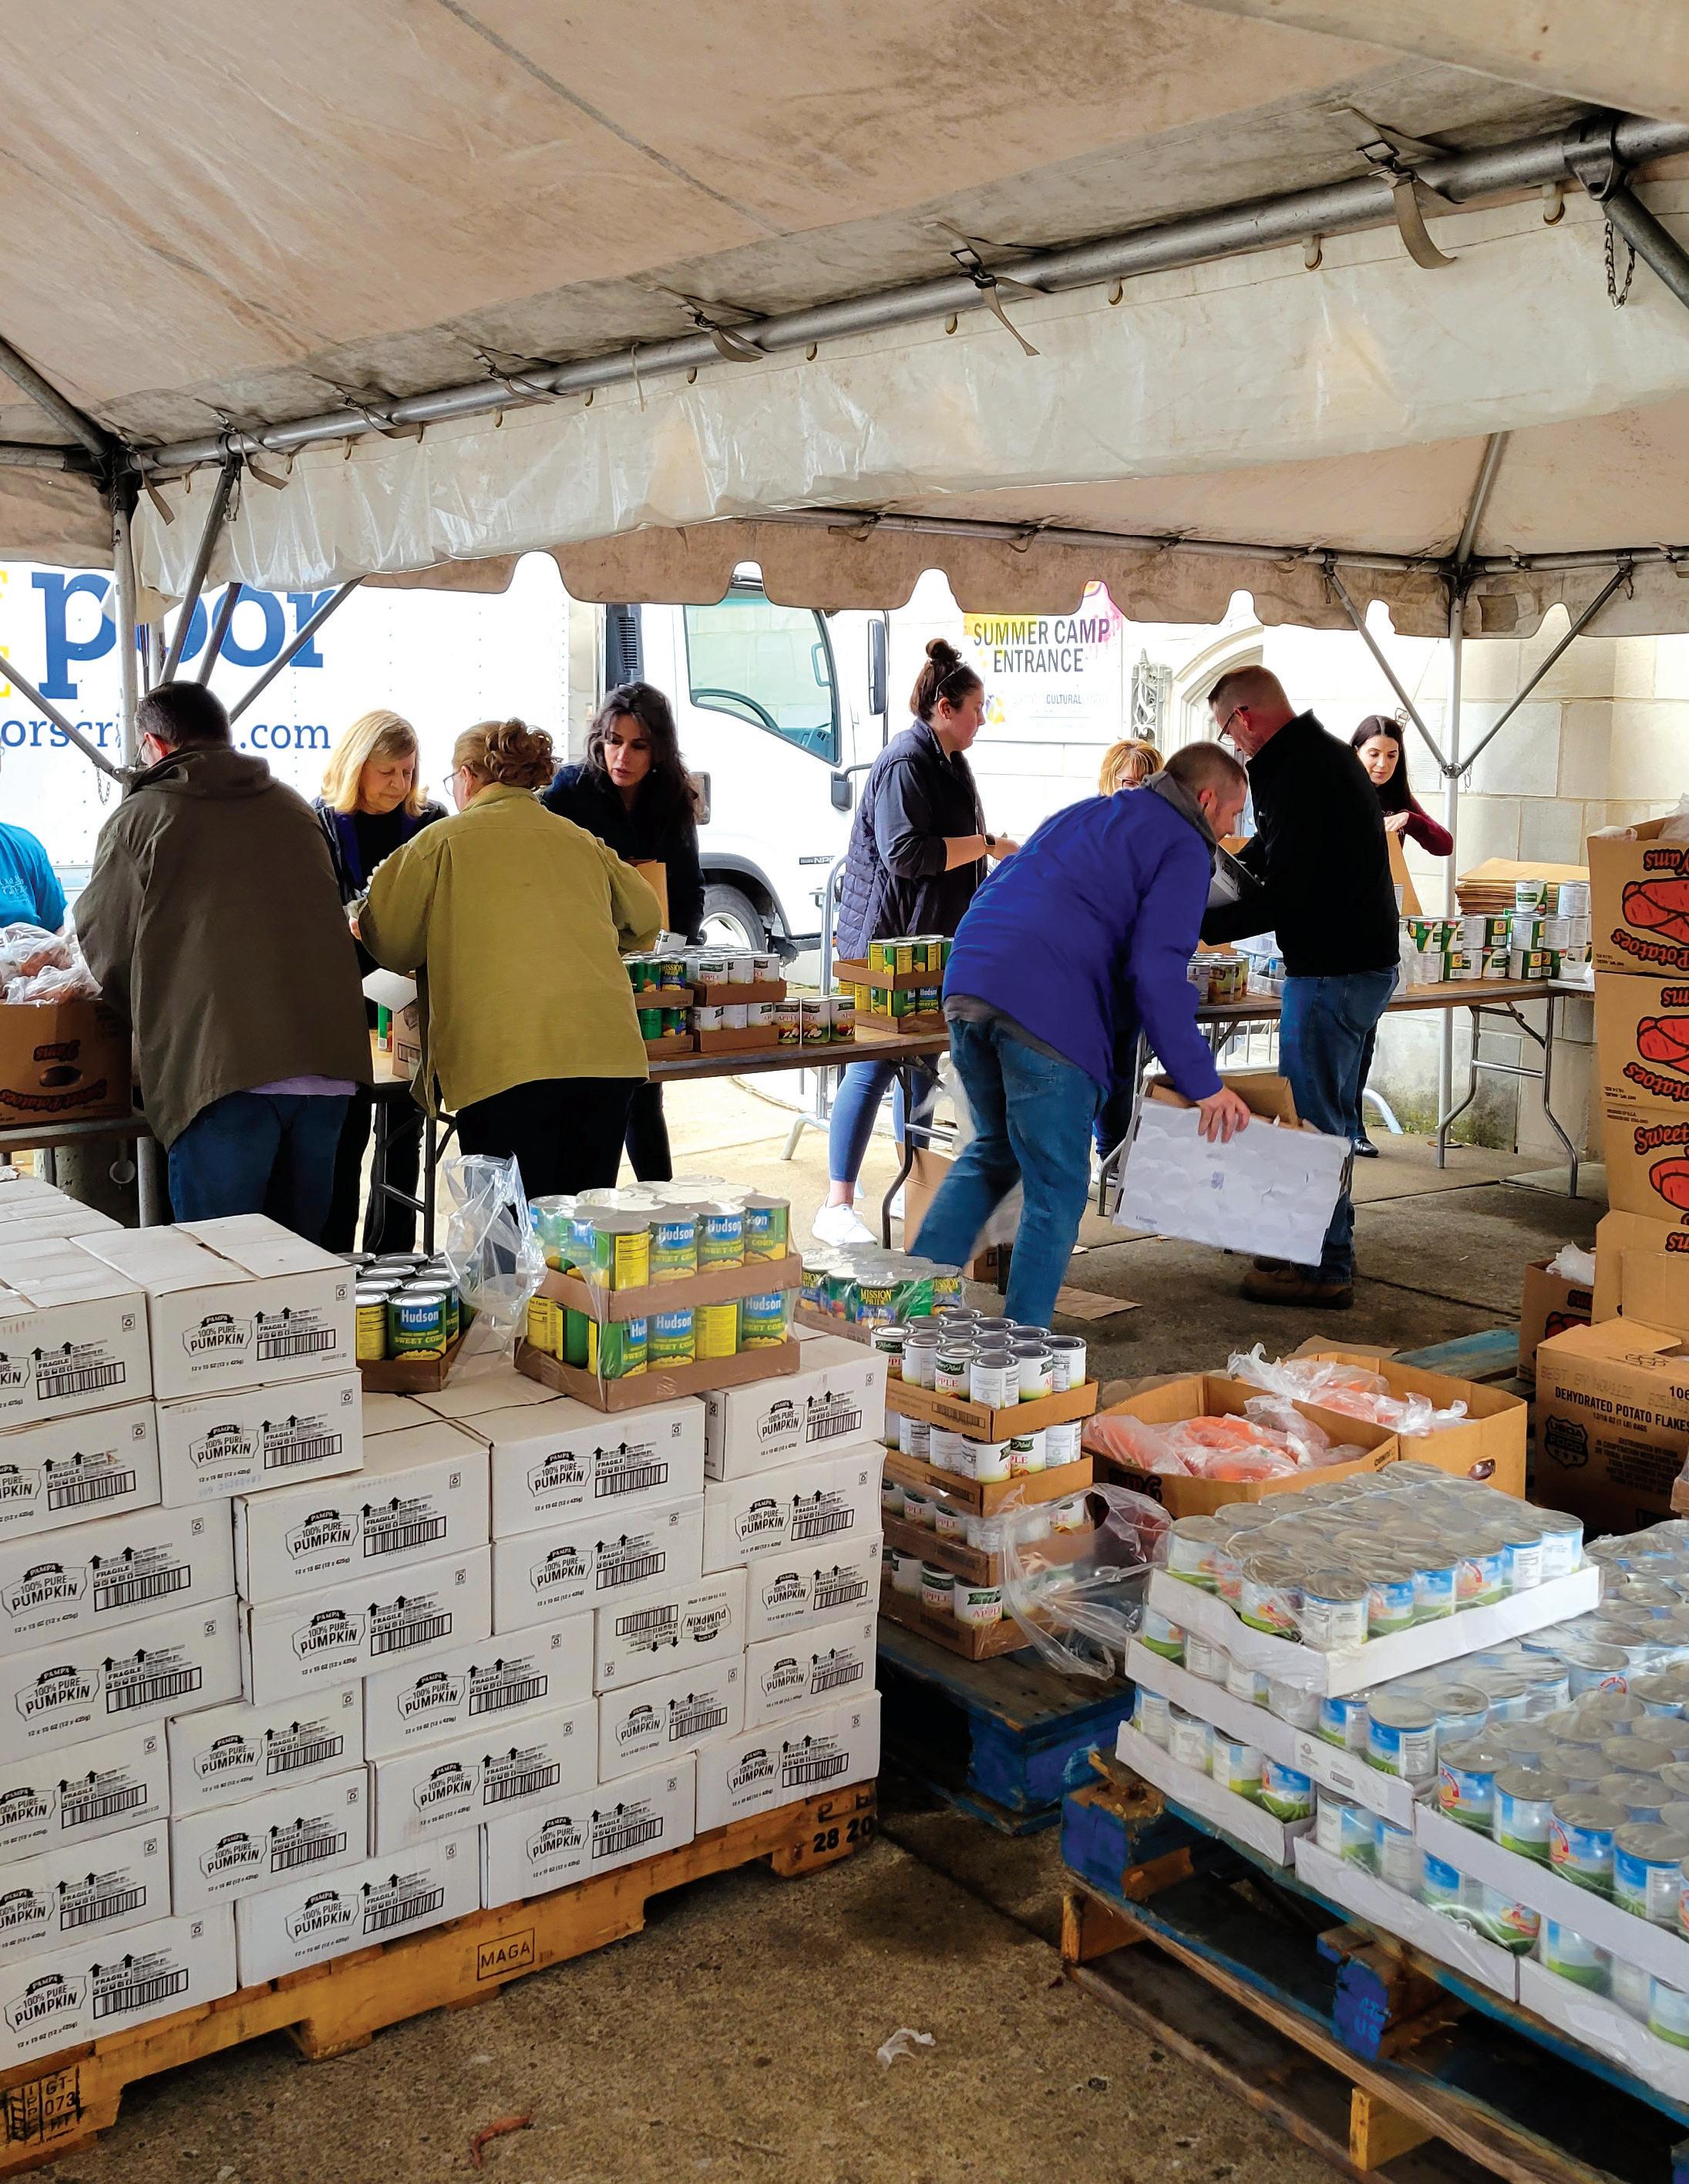
— Photo from Friends of the Poor COVID-19 Food Distribution

32
Recommendations
To achieve greater economic security for families in NEPA, a multi-pronged approach is required that involves public policy changes, economic and workforce development efforts, government programs, and private charitable activities. The following recommendations reflect conclusions drawn from the data in this report and based on principles of Catholic Social Teaching in regard to poverty, just wages, and economic justice. 48
1. Support Expanded Housing Assistance and Housing Affordability
Expand access to social programs that address issues of housing affordability, including changes to zoning, development of more housing options across income levels, expansion of mixed-income social housing, and homeownership counseling and cash assistance.
While house rental costs, as measured by the Living Wage Calculator, over the time period of the 2019-2022 reports increased only slightly, increases were observed when looking at Zillow’s Observed Rent Index (ZORI). According to the 2022 Scranton Strategic Economic Development plan, “Scranton’s Median Household income is over $1,300 per month lower than PA’s, yet median monthly rent is just $149 lower…In fact, 48 percent of renters are cost burdened.” Additionally, while the prices of homes in Northeastern Pennsylvania are relatively affordable compared to other parts of the country, less than half of Scranton houses are owner-occupied.
Federal and local attention should be paid to ensuring that there is an adequate supply of affordable housing for low-income renters across different neighborhoods and localities 49; this should include addressing the conditions of deteriorating housing stock and additional tenant education. As revitalization efforts continue on the regional and municipal levels, there is opportunity to develop more affordable properties through redevelopment and infill development strategies targeting a variety of price points and in support of low-income residents as well as programs and activities that address blight removal.50 Given the link between housing and transportation, policymakers should look to models of housing co-located with services such as grocery stores, daycares, and healthcare facilities; in some European examples, this is accomplished through a public sector focus on the built environment and walkability 51. An Institute demand study on affordable and accessible housing documented an increasing demand for affordable housing development.52 Further, communities can revise zoning codes to designate not only “uses” of land and buildings,53 but also to require affordable housing units; some states utilize an “80/20 Program”54 to provide low-interest financing to multifamily rental developers who commit to designating at least 20 percent of a development’s units to low-income households.
The Institute’s 2022 study on affordable housing for working- and middle-class households noted that there are funding streams currently in use to incentivize development of lower-income housing. However, the market pressure for developers to pursue higher-end (and potentially more profitable) options may leave a gap in the supply between subsidized low-income housing and new, market-rate construction 55
NEPA cities and counties should consider a variety of tools to increase affordable and achievable housing, including public-private partnerships, zoning changes, further promoting developer incentives, and requiring or otherwise encouraging mixed-income development that includes both market-rate and affordable housing. Additionally, we should continue to support programs like the City of Scranton and Lackawanna County Homebuyer programs, which provide first-time homebuyers with counseling and cash assistance towards building a down payment or covering closing costs.
33
The Institute and The University of Scranton
2. Foster Equity and Inclusivity
Promote practices by government, non-profit, and other agencies to ensure equitable access to services and benefits, including reviewing local and regional policies and their implementation. This should involve centering the voices and experiences of BIPOC, economically disadvantaged, and formerly incarcerated populations and seeking to better understand causes of and solutions to racial disparities, including discrimination or other barriers.
Northeastern Pennsylvania is an increasingly diverse region with income and other disparities that fall along race and ethnic differences as noted throughout this 2022 Report. According to The Institute’s 2022 Indicator Report, between 2010 and 2020, the share of residents in both counties identifying their race as white alone fell from 92 to 83 percent in Lackawanna County and from 91 to 79 percent in Luzerne County. In both counties, 2020 Census numbers indicate a large growth in Hispanic/Latino residents, up to 8.5 percent in Lackawanna and 14.4 percent in Luzerne. In the city of Scranton specifically, Hispanic or Latino represent 15.1 percent, Black or African American represent 5.7 percent, and Asian 5.1 percent.
While many families in Northeastern Pennsylvania do not earn a living wage, Black and Hispanic/Latino households are beginning from a greater position of vulnerability on average due to lower median household income (43 and 31 percent lower than white households, respectively), lower rates of homeownership, less representation in jobs with wages of $20 per hour or more, and greater poverty rates. In general, these social inequities appear at least as significant locally as they are statewide and nationwide.
The National League of Cities’ Advancing Racial Equity in Your City municipal action guide recommends examining racial biases in municipal department services, convening community stakeholders to understand perspectives on racial impacts of city policies, engaging residents of color and white residents to understand how policies in the past and currently impact different groups, and integrating an understanding of structural and institutional racism.56
Additional strategies to reduce barriers to access may include: standing commissions or working groups to address discrimination or other barriers to access; additional language translation resources for recent immigrant and refugee populations; and regular DEI and cross-cultural trainings for employers, banks and others involved in lending related to homeownership. We should consider policies and practices that can help formerly incarcerated individuals gain greater access to employment and address the disproportionate impact of the criminal justice system on communities of color and the impact that can have on attaining a living wage job.
With a similar population to Scranton, the city of Jacksonville, North Carolina, was awarded by the National League of Cities during the 2018 City Cultural Diversity Awards. According to the League, “Jacksonville’s ‘One City, Our City, My City’ campaign was designed to promote respect, caring and collaboration between all citizens in Jacksonville and encourages them to learn about their neighbors’ cultures.”57 Through events, pledges, and regular meetings between the mayor and leaders in the city’s faith community, the initiative is moving the city closer to its vision of a “unified and caring community.”58 According to Scranton’s 2022 Strategic Economic Development Plan, the city intends to develop a City Equity Plan that “will address resilience and how equity is a driver of economic measures.” Specifically, the plan will “consider how to promote inclusion and belonging in the city.”
Plans and initiatives like these are important first steps in helping a community to acknowledge the value of its diversity, recognize racial disparities and better understand their causes, and to begin the process of securing greater inclusion for communities of color. These steps should then be followed by advocacy for substantive policy changes at the local, state, and federal level.
‘For immigrants whose first language is not English, it can be very difficult to keep up with policy information and changes. They may not be aware of their rights, making them susceptible to losing jobs or otherwise missing employment opportunities, public benefits, or subsidized housing. Improving language access and translation services are important tools in fostering economic security, and while many low-income immigrant families qualify for services related to home energy or food, if they are undocumented their immigration status may make them ineligible.”
— Jenny Gonzalez, Students Together Achieving Remarkable Success (S.T.A.R.S.) Program Director
Living Wage Report 2022 Update 34
3. Increase Wages
To foster and maintain more family-sustaining jobs, raise the Pennsylvania and/or federal minimum wage and further increase economic development and workforce activities, including strategic higher education and K-12 collaborations to ensure a match between regional skills and needs.
As indicated from our analysis of the minimum and living wages in the Commonwealth, the minimum wage does not meet the basic needs required by families and falls short of a living wage. A “living wage” changes depending on how many people are in a family. However, for the family classifications studied, reaching a living standard is nearly impossible earning $7.25 an hour, especially among families with children. A single, childless worker in either Lackawanna or Luzerne county earning a mean wage of approximately $30,000 would find themselves struggling to meet the living wage income threshold in the region ($31,616); if that worker were to have just one child, they would find themselves over $32,000 beneath the living wage for that household size ($62,317).
As of June 2022, Pennsylvania is one of just 14 states still at the $7.25 federal minimum wage 59. All its neighboring states (Maryland, West Virginia, Ohio, New York, New Jersey, and Delaware) have higher rates, ranging from $8.75 (WV) to $13.20 (NY). In 2022, Governor Wolf’s plan to raise the minimum wage for commonwealth employees was successfully implemented (raising their pay to $15 an hour). However, that executive action applies only to commonwealth employees. According to the PA Budget and Policy Center, there is “overwhelming support” from Pennsylvanians (73 percent agree) for raising the minimum wage to $15 per hour over the next four years. With inflation in the U.S. currently close to a four-decade high, the minimum wage must increase in order to prevent and alleviate poverty.
The best way to help families thrive in today’s economy is to increase wages. This can be done through further economic development activities that seek to increase jobs with meaningful, family-sustaining wages and through increases to the state and/or federal minimum wage. Workforce development programs should be continued and expanded, particularly to address needed technical and soft skills. These programs have the potential to help low-wage workers improve their skill sets, attain higher-paying jobs, and spur economic growth in the region while filling workforce gaps that exist in growing, well-paying occupations in healthcare, logistics, utilities as well as other sectors.
4. Support Cash Assistance for Low-Income Families
Support expanded tax credits and cash assistance that assist with basic costs for low-income families.
Federal and state income tax credits, such as the Earned Income Tax Credit (EITC) or the Pennsylvania Child and Dependent Care Enhancement program, help to ease the economic burdens of working families by providing them with regularly occurring cash assistance via a tax refund. While the EITC helps to alleviate poverty and provides health and psychological benefits by providing a cash benefit directly to families, the sums provided are small and occur only once per year. The funds are also not generally available to the unemployed or some young adults with no children. Similarly, the Child Tax Credit (CTC) and the PA and federal childcare and dependent care tax credits do not adequately subsidize the cost of childcare (about $300 per child, per week in PA).60 In September 2022, the U.S. Conference of Catholic Bishops called for expanding the CTC to promote “family stability.61”
Between 2020-2021, a number of social service programs were expanded in response to the pandemic. The EITC was expanded to allow workers without children, younger workers, and senior citizens. Additionally, the amount of the credit increased and was given to a broader range of workers. The federal CTC was also expanded, providing more cash to families on a monthly basis. Unemployment compensation was expanded, extending unemployment benefits to workers who are ordinarily ineligible, extending the benefits period by 13 weeks, and providing supplemental pay. Lastly, on three occasions, the government provided direct cash payments to residents making less than $75,000 (single) or less than $150,000 (married). While this is not an exhaustive list of COVID-19 relief programs, these are all examples of programs in which recipients were provided expanded or new cash assistance. According to the Center on Budget and Policy Priorities, data indicate that “relief measures reduced poverty, helped people access health coverage, and reduced hardships like inability to afford food and meet other basic needs.”62 We should consider how more permanently expanding access to cash aid would help ease economic burdens, improve lives, and promote more equity.
The Institute and The University of Scranton
35
5. Support Expanded Food and Basic Necessities Assistance
To address the rising costs and inconsistent availability of food and basic necessities, we should support expanded assistance in these areas.
Food assistance programs like the Supplemental Nutrition Assistance Program, improve the health and wellbeing of children and families and alleviate food insecurity. We should also support the continued offering of free or reduced-cost meals for school-aged children. School meals provided free to all children improve child nutrition and improve students’ academic performance and discipline. Furthermore, we should support and advocate for programs like the Summer Food Service Program, which provides free meals to kids age 18 or younger in low-income areas, reimbursing program operators who offer meals. Programs like these ensure that children are fed meals and snacks throughout the year — not just during the school year. Both the Scranton School District and the Wilkes-Barre Family YMCA currently offer summer food programs; however, we should ensure that all children are reached, particularly children in rural areas without adequate transportation.
While food assistance programs, alone, help families to reallocate their resources to afford other basic necessities not generally covered by government programs, the growing cost of items like menstrual products, toiletries, and diapers causes many families to forgo these necessities. By supporting the expansion of diaper banks, period supply banks, and hygiene banks, we lower the risk of infection and missed school or work days that can place additional financial stress on families.
6. Expand Access to Existing Social Safety Net Programs
Expand access to existing social safety net programs and ensure that federal, state, and local poverty measures adequately address the realities of low-income Americans.
When applying for social benefits, many individuals are met with administrative burdens, such as long wait times, complicated applications, and requirements for in-person interviews, that prevent them from accessing benefits for which they are eligible. Even once someone proves eligibility and begins to receive benefits, requirements such as regular income/job updates and meetings with case workers can become so burdensome that recipients opt out of assistance. This means that many eligible families are not receiving the benefits they need. For example, in 2020, only 21 families out of every 100 families living in poverty received TANF cash assistance.63 Even for SNAP — a more flexible and expansive social program — national participation rates are around 72 percent for the working poor.64
Social programs, including government programs and services offered by non-profits, should be regularly monitored for administrative burdens that may unfairly exclude beneficiaries from the program. Funding and staffing should be carefully increased and allocated to promote efficiency and effectiveness.
In addition to administrative burdens, the process through which many programs determine who is eligible for assistance relies on income and asset calculations that exclude many from needed assistance. For example, the federal poverty line is based on the calculation of three times the expected cost of groceries, adjusted for family size. This calculation does not include direct measures for the cost of clothing, transportation, housing, and other daily needs, and it does not vary by residence. Instead, we might rely on the Supplemental Poverty Measure, which includes non-cash benefits; direct measures of cost for things like utilities, taxes, clothing; and is adjusted by residence. As national Catholic agencies working in anti-poverty efforts have recommended, the federal government should “consider creating an additional index that specifically evaluates expenditure patterns for low-income communities” or work on addressing “other deficient components of the [official poverty measure] calculation.”65
Many of the same issues of eligibility that restrict access to government benefits also apply to programs administered by non-profit organizations. Regional non-profits, faith-based institutions, and others working in antipoverty should apply the principles outlined above to their own programs. Though programs funded through public charities or private foundations suffer from resource limitations, efforts should be made to ensure that families earning less than a living wage are covered to the greatest extent possible, even if they earn above the official federal poverty line.
Living Wage Report 2022 Update 36
7. Support Programs
Policies that Help Workers to Obtain and Keep Jobs with Family-Sustaining Wages
and
Reduce disparities in K-12 and post-secondary education, equip workers with the skills they need to obtain jobs with family-sustaining wages, and provide transportation and childcare support for families to ensure gainful employment.
The COVID-19 pandemic has caused shifts in education and workforce development. One study found that half of all employers will need reskilling by the year 2025.66 Public-private partnerships and innovative approaches can be used to help students with barriers to education get access to job skills. Postsecondary institutions, private philanthropy, and employers can all share ownership of programs that alleviate these barriers, such as child care, transportation, and housing, to allow disadvantaged students a path to increase their wages. Given the strength and variety in Northeastern Pennsylvania’s institutions of higher education, colleges and universities should explore further avenues for collaboration with K-12 schools, the business sector, and across the higher education sector itself to improve high school graduation rates, post-secondary degree completion, and ensure that regional academic offerings address the range of workforce needs.
Funding mechanisms for public schools, which are largely based on local property taxes, create “have and have not” communities and disparities in curriculum, teacher salaries, and extracurricular activities. As a result, there is unequal access to resources that enable students to graduate prepared for postsecondary education or the workforce. Policymakers should consider legislative opportunities to reduce these disparities.67
Policymakers should also seek to eliminate barriers to gainful employment, such as unreliable transportation and costly childcare. Accessible and affordable transportation options are directly linked to employment opportunities.68 Workers without access to cars and workers with cars that spend a significant portion of their resources on transportation often face instability in employment and have fewer opportunities to accept jobs with higher wages. Policymakers should invest in expanding safe and reliable public transportation options and should consider instituting policies that encourage new development and job creation closer to residential areas.
Lack of affordable childcare is another barrier workers face when trying to find and keep employment. As noted above, policymakers at the federal and state level should expand child and dependent care tax credits to help subsidize the high cost of care for children and other dependents. Furthermore, all levels of government should fund the creation and expansion of safe and affordable childcare options. Minimizing barriers to gainful employment will help families to accept and keep jobs that pay family-sustaining wages.
Many local recent immigrants work in factories and the food industry. During the pandemic, many factory workers were considered ‘essential’ workers and others who worked in restaurants were out of work, both of which put pressure on families. Access to transportation for school and work, bilingual and culturally competent mental health services, and medical insurance — especially for undocumented individuals — are also critical issues.”
— Alejandra Marroquin, Community Organizer at Geisinger Commonwealth School of Medicine
37
The Institute and The University of Scranton
‘The Church’s love for the poor…is a part of her constant tradition.’ This love is inspired by the Gospel of the Beatitudes, of the poverty of Jesus, and of his concern for the poor…Those who are oppressed by poverty are the object of a preferential love on the part of the Church which, since her origin and in spite of the failings of many of her members, has not ceased to work for their relief, defense, and liberation.”
— Catechism of the Catholic Church, excerpts from nos. 2444 and 2448
How Should We Respond
Learn about local needs and inequities, advocate for policies and programs to support those who are economically insecure, and accompany low-income neighbors through volunteer and other community engagement programs.
As employers, elected officials, students, and private citizens, we all have a role to play in attending to the needs of vulnerable populations. For more families to attain a “living wage” in Northeastern Pennsylvania, a combination of institutional, governmental, and private charitable activities is needed to increase wages and support low-income families. Catholic Social Teaching asserts that all people have a right to participate in society and calls on people of goodwill to consider how they can help to alleviate social inequities.
The social teaching of the Catholic Church has long asserted the centrality of human dignity in assessing issues related to poverty and economic life.69 As the U.S. Catholic Bishops wrote in 1986 in “Economic Justice for All: Pastoral Letter on Catholic Social Teaching and the U.S. Economy,” “The dignity of the human person, realized in community with others, is the criterion against which all aspects of economic life must be measured.”70 In its 2002 pastoral letter on poverty, “A Place at the Table,” the Bishops emphasized the principle of solidarity — that “we see every ‘other’ as our neighbor, who must share in the ‘banquet of life to which all are equally invited by God’” — and the key role of work, which “should not leave people poor but should provide wages sufficient to achieve a standard of living that is in keeping with human dignity.” In May 2022, Sister Donna Markham, OP, Ph.D., President and CEO of Catholic Charities USA, wrote to Congress urging them to “please remember those who are the most vulnerable.71”
As a Catholic and Jesuit institution, The University of Scranton is committed to an educational mission that includes the service of faith and the promotion of justice.72 In the 2019-2029 Apostolic Preferences of the Society of Jesus, Society General Arturo Sosa, S.J., prioritized walking with the poor in a way that promotes social justice “and the change of economic, political, and social structures that generate injustice.73” This kind of approach prioritizes not only policy advocacy but also human encounter, including volunteer service activities, academic engagement through community based-learning courses, and other collaborations and initiatives that center the voices of those experiencing economic insecurity, racial inequities, and other disparities. The University raises awareness of and advocates for public policies in keeping with emphases within Catholic Social Teaching on principles of human dignity, community and the common good, dignity of work and the rights of workers, solidarity, the option for the poor and vulnerable, and the role of government and subsidiarity.74

38
Conclusions
This study has found that it costs more to reach a living wage in 2022 in Northeastern Pennsylvania than it did in 2019 or 2016 as a result of increases in basic costs, inflationary pressures and wages that have not necessarily kept pace with expenses. More households across the region are earning incomes beneath the living wage; they lack economic security and may find it difficult to pay essential needs. For example, a family of two adults and two children in the region needs $75,196 to reach the living wage threshold in 2022, up 43.6 percent from 2019 and 54.7 percent since 2016. The regional population living in poverty remains disproportionately high when compared to state averages, and signs of improvement are mixed. Since the 2019 report, the median household income only rose by about nine percent — well behind the pace at which the living wage has accelerated. With inflation at its highest level since 1981, many families are struggling to access basic necessities 75. Moreover, longstanding racial disparities are present as we analyze the poverty rate, median household income, workforce composition, and homeownership across different races/ethnic groups.
Across all family compositions, a minimum wage or even near-minimum wage job will generally be insufficient to allow the family to achieve economic security. Notably, the 2022 report also shows that the median household incomes for both counties now fall short of a living wage income for all family compositions, except those without children. Many agencies report more clients seeking more services with the economic effects of the pandemic ongoing. Characteristic of Northeastern Pennsylvania’s generous community spirit, there are many resources available to residents of the region who have income challenges through a robust non-profit sector and government assistance programs. However, income eligibility guidelines for many assistance programs are often significantly below the living wage threshold. On the federal level, monthly payments distributed during the COVID-19 pandemic demonstrated the power that cash assistance can have for low-income families, but these payments have largely ended while the economic impacts of the pandemic are ongoing. As a result, there are numerous families in Northeastern Pennsylvania who fall into this very real gap of having too much income to quality for meaningful assistance, but too little to achieve economic security; they may experience a “benefits cliff” in relation to various assistance programs as well as medical care and housing. As the region increasingly makes economic development progress, continued attention should be paid to fostering equity and inclusion, increasing wages, expanding the availability of family-sustaining jobs, and addressing rising costs that impact low-income residents. In particular, this report has highlighted rising costs in relation to healthy foods, transportation and childcare and the most recent data points to an acute need for affordable housing that calls for new policies and approaches such as mixedincome housing. Together, government, businesses, the social service sector and individuals can ensure that a greater share of Northeastern Pennsylvanians can live a modest but dignified life.
The gospel mandate of ‘serving the least of our brothers and sisters’ calls us to care for our society’s most vulnerable members. Individuals and governments have a special obligation to prioritize the basic needs of the poor. Our policies must protect the poor and vulnerable and promote the common good by caring for the well-being of each member of our national family. CCUSA recognizes that Congress is faced with many difficult choices, but we urge you to please remember those who are the most vulnerable.”
— Sister Donna Markham OP, Ph D , President and CEO, Catholic Charities USA (CCUSA), 2022, Letter on Appropriations Bill
The Institute and The University of Scranton
39
Endnotes
1 Jesuit Social Research Institute, “Too Much for Too Many: What does it cost families to live in Louisiana?” JustSouth Quarterly (Winter 2014). Loyola University New Orleans College of Social Sciences, Accessed July 25, 2022, from: https://jsri.loyno.edu/too-much-too-many.
2 Glasmeier, Amy K. “Living Wage Calculator.” Massachusetts Institute of Technology, Accessed August 12, 2022, from: https://livingwage.mit.edu/.
3 U.S. Bureau of Labor Statistics Mid-Atlantic Information Office, “Consumer Price Index Historical Tables for U.S. City Average.” U.S. Bureau of Labor Statistics, Accessed July 25, 2022, from: https://www.bls.gov/regions/midatlantic/data/consumerpriceindexhistorical_us_table.htm.
4 Glasmeier, Amy K. “Living Wage Calculator — Calculation for Scranton—Wilkes-Barre—Hazleton, PA.” Massachusetts Institute of Technology, Accessed July 25, 2022, from: https://livingwage.mit.edu/metros/42540.
5 U.S. Bureau of Labor Statistics Graphics for Economic News Releases, “Charts related to the latest ‘Consumer Price Index’ news release.” U.S. Bureau of Labor Statistics, Accessed July 25, 2022, from: https://www.bls.gov/charts/consumer-price-index/consumer-price-index-by-category.htm#.
6 The Institute, The COVID-19 Pandemic: 2 Years Later (May 2022). The Institute for Public Policy & Economic Development, Accessed July 25, 2022, from: https://www. institutepa.org/wp-content/uploads/2022/05/Indicator-2022_The-Institute.pdf.
7 Santhanam, Laura. “‘I could live normally’: How child tax credit payments brought relief to these families” PBS NewsHour, 9 February 2022, https://www.pbs.org/ newshour/nation/how-child-tax-credit-payments-helped-these-families-stay-afloat?fbclid=IwAR1KxNh1yIF9id81a-GDdYcm-klUHmM1XHEvOu4RaoAHfYUGsTyKQoB7ymg.
8 U.S. Census Bureau, “Data on Cash Assistance within Lackawanna County.” U.S. Census Bureau Accessed July 25, 2022, from: https://data.census.gov/cedsci/ table?q=cash%20assistance%20lackawanna%20county%20&tid=ACSCP5Y2020.CP03.
9 Center on Budget and Policy Priorities COVID Hardship Watch, “Tracking the COVID-19 Economy’s Effects on Food, Housing, and Employment Hardships” Center on Budget and Policy Priorities, Updated 10 February 2022, https://www.cbpp.org/research/poverty-and-inequality/tracking-the-covid-19-economys-effects-on-foodhousing-and.
10 Ibid.
11 Glasmeier, Amy K. “Living Wage Calculator User’s Guide/Technical Notes.” Massachusetts Institute of Technology, Accessed July 25, 2022, from: https://livingwage. mit.edu/resources/Living-Wage-Users-Guide-Technical-Documentation-2022-05-10.pdf.
12 MIT Department of Urban Studies and Planning, “Living Wage Calculator User’s Guide / Technical Notes.” Massachusetts Institute of Technology. Accessed July 25, 2022, from: https://livingwage.mit.edu/resources/Living-Wage-Users-Guide-Technical-Documentation-2022-05-10.pdf.
13 The Alliance for Period Supplies, “Period Poverty Awareness Week.” from: https://allianceforperiodsupplies.org/ppaw-2/.
14 El-Sibaie, Amir. 2019-2020 Tax Brackets: 2019 Federal Income Tax Brackets & Rates. 10 November 2021, Tax Foundation Center for Federal Tax Policy. Accessed July 25, 2022, from: https://taxfoundation.org/2019-tax-brackets/.
15 Foster, Sarah. 2021-2022 Tax Brackets and Federal Income Tax Rates. 7 April 2022, Bankrate. Accessed July 25, 2022, from: https://www.bankrate.com/taxes/ taxbrackets/#:~:text=There%20are%20seven%20tax%20brackets,35%20percent%20and%2037%20percent.
16 U.S. Census Bureau American Community Survey. “Income in the Past 12 Months (In 2021 Inflation-Adjusted Dollars)” U.S. Census Bureau, Accessed July 26, 2022, from: https://data.census.gov/cedsci/table?t=Income+and+Poverty&g=0400000US42_0500000US42069%2C42079.
17 U.S. Census Bureau American Community Survey. “Poverty Status in the Past 12 Months.” U.S. Census Bureau, Accessed July 25, 2022, from: https://data.census.gov/ cedsci/table?t=Income+and+Poverty&g=1600000US4269000%2C4285152&tid=ACSST5Y2020.S1701.
18 U.S. Census Bureau American Community Survey. “Income in the Past 12 Months (In 2021 Inflation Adjusted Dollars)” U.S. Census Bureau, Accessed July 26, 2022, from: https://data.census.gov/cedsci/table?t=Income+and+Poverty&g=0400000US42_0500000US42069%2C42079.
19 The Pew Charitable Trusts’ Philadelphia Research Initiative, Philadelphia’s Immigrants Who they are and how they are changing the city (June 2018). The Pew Charitable Trusts, https://www.pewtrusts.org/-/media/assets/2018/06/pri_philadelphias_immigrants.pdf.
20 U.S. Census Bureau. (n.d.). Selected Characteristics of the Native and Foreign-Born Populations. Explore census data. Retrieved October 4, 2022, from https://data. census.gov/cedsci/table?q=S0501%3A%20SELECTED%20CHARACTERISTICS%20OF%20THE%20NATIVE%20AND%20FOREIGN-BORN%20POPULATIONS.
21 U.S. Census Bureau American Community Survey. “Poverty Status in the Past 12 Months of Families.” U.S. Census Bureau, Accessed July 26, 2022, from: https://data. census.gov/cedsci/table?t=Income+and+Poverty&g=0400000US42_0500000US42069%2C42079&tid=ACSST5Y2020.S1702&moe=false.
Living Wage Report 2022 Update 40
22 U.S. Census Bureau American Community Survey. “Median Income in the Past 12 Months (In 2020 Inflation-Adjusted Dollars)” U.S. Census Bureau, Accessed July 26, 2022, from: https://data.census.gov/cedsci/table?t=Income+and+Poverty&g=0400000US42_0500000US42069%2C42079&tid=ACSST5Y2020.S1903&moe=false.
23 U.S. Census Bureau American Community Survey. “Poverty Status in the Past 12 Months of Families.” U.S. Census Bureau, Accessed July 26, 2022, from: https://data. census.gov/cedsci/table?t=Income+and+Poverty&g=0400000US42_0500000US42069%2C42079&tid=ACSST5Y2020.S1702&moe=false.
24 U.S. Census Bureau. SAIPE State and County Estimates for 2020 (16 December 2020). U.S. Census Bureau, Accessed July 26, 2022, from: https://www.census.gov/ data/datasets/2020/demo/saipe/2020-state-and-county.html.
25 U.S. Census Bureau American Community Survey. “Children Characteristics.” U.S. Census Bureau, Accessed July 26, 2022, from: https://data.census.gov/cedsci/table ?t=Families+and+Living+Arrangements&g=0400000US42_0500000US42069%2C42079&tid=ACSST5Y2020.S0901&moe=false.
26 U.S. Bureau of Labor Statistics. (2021, February 1). Characteristics of Minimum Wage Workers, 2020. U.S. Bureau of Labor Statistics. Retrieved July 26, 2022, from: https://www.bls.gov/opub/reports/minimum-wage/2020/home.htm.
27 Minimum Wage Advisory Board Center for Workforce Information & Analysis. Analysis of the Minimum Pennsylvania Wage (March 2022), Commonwealth of Pennsylvania Minimum Wage Advisory Board. Accessed July 26, 2022, from: https://www.workstats.dli.pa.gov/Documents/Minimum%20Wage%20Reports/ Minimum%20Wage%20Report%202022.pdf.
28 U.S. Bureau of Labor Statistics BLS Reports. (2021, February 1). “Characteristics of Minimum Wage Workers 2020.” 1 February 2021, U.S. Bureau of Labor Statistics, Accessed July 26, 2022, from: https://www.bls.gov/opub/reports/minimum-wage/2020/home.htm.
29 Chmura Economics. (2022). Occupation Wages, Average Annual. JobsEQ, 2022, https://jobseq.eqsuite.com/landing/economic-development/all-tools/occupationwages?_num=16568841037974.
30 Ibid.
31 U.S. Census Bureau American Community Survey. “Educational Attainment.” U.S. Census Bureau, Accessed July 26, 2022, from: https://data.census.gov/cedsci/table ?t=Educational+Attainment&g=0100000US_0400000US42_0500000US42069%2C42079&tid=ACSST5Y2020.S1501&moe=false.
32 Pennsylvania Department of Education Division of Data Quality. “Dropouts.” Pennsylvania Department of Education, Accessed September 27, 2022, from: https:// www.education.pa.gov/DataAndReporting/Dropouts/Pages/default.aspx.
33 The Institute. (2022). COVID-19: The Impact on K-12 Learning and Post-Secondary Workforce Development. Retrieved from: https://www.institutepa.org/educationand-workforce-development/
34 The Bipartisan Policy Center, “The Effects of the Child and Dependent Care Tax Credit on Child Care Affordability” https://bipartisanpolicy.org/download/?file=/wpcontent/uploads/2021/05/BPC_CDCTC_Report_V3.pdf.
35 Ryan, Rebecca A, et al. “The Impact of Child Care Subsidy Use on Child Care Quality.” National Center for Biotechnology Information, National Library of Medicine, 1 January 2012, from: https://www.ncbi.nlm.nih.gov/pmc/articles/PMC3160790/.
36 Hungerford, Thomas L., and Rebecca Thiess. “The Earned Income Tax Credit and the Child Tax Credit: History, Purpose, Goals, and Effectiveness.” Economic Policy Institute, 25 September 2013, from: https://www.epi.org/publication/ib370-earned-income-tax-credit-and-the-child-tax-credit-history-purpose-goals-andeffectiveness/.
37 Brookings Institution and the Social Policy Institute at Washington University St. Louis. “The impacts of the 2021 expanded child tax credit on family employment, nutrition, and financial well-being.” Brookings Institution, 13 April 2022, from: https://www.brookings.edu/research/the-impacts-of-the-2021-expanded-childtax-credit-on-family-employment-nutrition-and-financial-well-being/#:~:text=Overall%2C%20we%20find%20that%20families,for%20both%20parents%20and%20 children.
38 Whitmore Schanzenbach, Diane, and Lauren Bauer. “The long-term impact of the Head Start program.” Brookings Institution, 19 August 2019, from: https://www. brookings.edu/research/the-long-term-impact-of-the-head-start-program/.
39 Ruffini, Krista. “Schoolwide free-meal programs fuel better classroom outcomes for students.” Brookings Institution, 11 February 2021, from: https://www. brookings.edu/blog/brown-center-chalkboard/2021/02/11/schoolwide-free-meal-programs-fuel-better-classroom-outcomes-for-students/.
40 Rosenbaum, Dottie. “SNAP Is Effective and Efficient.” Center for Budget and Policy Priorities, 11 March 2013, from: https://www.cbpp.org/research/snap-is-effectiveand-efficient.
The Institute and The University of Scranton
41
41 Fischer, Will. “Research Shows Housing Vouchers Reduce Hardship and Provide Platform for Long-Term Gains Among Children.” Center for Budget and Policy Priorities, 7 October 2015, from: https://www.cbpp.org/research/housing/research-shows-housing-vouchers-reduce-hardship-and-provide-platform-for-long-term.
42 Goodman, Laurie et al. Barriers to Accessing Homeownership Down Payment, Credit, and Affordability (2018) Urban Institute, from: https://www.urban.org/research/ publication/barriers-accessing-homeownership-down-payment-credit-and-affordability-2018.
43 Murray, Anthony G. and Bradford F. Mills. The Impact of Low Income Home Energy Assistance Program (LIHEAP) Participation on Household Energy Insecurity (January 2012) Contemporary Economic Policy 32, no. 4, from: https://www.researchgate.net/publication/254384671_The_Impact_of_Low_Income_Home_Energy_ Assistance_Program_LIHEAP_Participation_on_Household_Energy_Insecurity.
44 Katch, Hannah. “Medicaid Works: Millions Benefit from Medicaid’s Effective, Efficient Coverage.” Center for Budget and Policy Priorities, 2 June 2017, from: https:// www.cbpp.org/research/health/medicaid-works-millions-benefit-from-medicaids-effective-efficient-coverage.
45 Marr, Chuck et al. “EITC and Child Tax Credit Promote Work, Reduce Poverty, and Support Children’s Development, Research Finds.” Center for Budget and Policies Priorities, 1 October 2015, from: https://www.cbpp.org/research/federal-tax/eitc-and-child-tax-credit-promote-work-reduce-poverty-and-support-childrens.
46 Office of the Associate Director for Policy and Strategy, Centers for Disease Control and Prevention. “Earned Income Tax Credits | Health Impact in 5 Years | Health System Transformation” Centers for Disease Control and Prevention, from: https://www.cdc.gov/policy/hst/hi5/taxcredits/index.html#:~:text=A%202019%20 study%20showed%2023,by%204%20to%2011%20percent.&text=The%20same%20study%20found%20that,all%20had%20refundable%20tax%20credits.
47 Shrivastava, Aditi and Gina Azito Thompson. “TANF Cash Assistance Should Reach Millions More Families to Lessen Hardship.” Center for Budget and Policy Priorities, 18 February 2022, from: https://www.cbpp.org/research/family-income-support/tanf-cash-assistance-should-reach-millions-more-families-to-lessen.
48 Pope Francis. “Selected Quotes of Pope Francis (Jesuit Schools Q&A,).” United States Conference of Catholic Bishops Department of Justice, Peace and Human Development, Updated 2018, from: http://www.usccb.org/beliefs-and-teachings/what-we-believe/catholic-social-teaching/upload/pope-francis-quotes1.pdf.
49 National Low Income Housing Coalition Legislative Action Center. “Key Legislation.” National Low Income Housing Coalition, from: https://nlihc.org/take-action.
50 See specific recommendations regarding blight removal strategies within Lackawanna County: Comprehensive Blight Strategy (December 2018). Lackawanna County Land Bank and NeighborWorks Northeastern Pennsylvania, at: https://www.nwnepa.org/programs-services/neighborhood-revitalization.html. For further affordable housing strategies, see (Re)Building Downtown: A Guidebook for Revitalization (December 2015). Smart Growth America, at: https://www. smartgrowthamerica.org/app/legacy/documents/rebuilding-downtown.pdf.
51 Hirt, Sonia. 2012. “Mixed Use by Default: How Europeans (Don’t) Zone.” Journal of Planning Literature 27(4): 375-393.
52 The Institute. A Demand Analysis of Accessible and Affordable Housing in Northeastern PA (May 2015), The Institute for Public Policy & Economic Development, from: http://www.institutepa.org/wp-content/uploads/2021/11/accessbile-housingthe-institute-2015.pdf.
53 The Institute. The Intersection of Transit and Land Use Planning (May 2018), The Institute for Public Policy & Economic Development, from: http://www.institutepa. org/wp-content/uploads/2021/11/pluti18.pdf.
54 Homes and Community Renewal, Housing Finance Agency. “The 80/20 Housing Program.” Office of the New York State Comptroller, 17 May 2017, from: https://www. osc.state.ny.us/state-agencies/audits/2017/05/31/8020-housing-program.
55 The Institute. Housing the Workforce: Creating and Revitalizing Housing for a Growing Region (May 2022), The Institute for Public Policy & Economic Development. Accessed August 4, 2022, from: https://www.institutepa.org/wp-content/uploads/2022/05/Housing-the-Workforce.pdf.
56 National League of Cities’ Race, Equity, and Leadership Initiative. Municipal Action Guide: Advancing Racial Equity in Your City (2017), National League of Cities, from: https://www.nlc.org/wp-content/uploads/2017/10/NLC-MAG-on-Racial-Equity.pdf.
57 National League of Cities. “How Six Cities Promote Diversity and Inclusion for Residents.” National League of Cities, from: https://www.nlc.org/article/2018/03/26/ how-six-cities-promote-diversity-and-inclusion-for-residents/.
58 Jacksonville Mayor’s Office and Jacksonville City Council. “One City, Our City, My City.” City of Jacksonville, North Carolina, Updated 4 June 2020, from: https:// jacksonvillenc.gov/onecity.
59 Jacquinot, Landon. “State Minimum Wages.” National Conference of State Legislatures, 9 Mar. 2022, from: https://www.ncsl.org/research/labor-and-employment/ state-minimum-wage-chart.aspx#State%20Minimum%20Wages. For additional information on the federal poverty line, see the following charts from the U.S. Department of Health & Human Services: https://aspe.hhs.gov/topics/poverty-economic-mobility/poverty-guidelines.
60 Sirinides, Philip M. and Gregory J. Collins. The Cost of Child Care in Pennsylvania (August 2020), Institute of State and Regional Affairs, The Pennsylvania State University at Harrisburg, and Muhlenberg College, from: https://s35729.pcdn.co/wp-content/uploads/2020/12/Cost_of_Care_Report_FINAL.pdf.
Living Wage Report 2022 Update 42
61 USCCB Public Affairs Office. “Labor Day 2022 Statement Focuses on Promoting the Welfare of Working Families.” United States Conference of Catholic Bishops, 31 August 2022, from: https://www.usccb.org/news/2022/labor-day-2022-statement-focuses-promoting-welfare-working-families.
62 Center for Budget and Policy Priorities. “Robust COVID Relief Achieved Historic Gains Against Poverty and Hardship, Bolstered Economy.” Center for Budget and Policy Priorities, 24 February 2022, from: https://www.cbpp.org/research/poverty-and-inequality/robust-covid-relief-achieved-historic-gains-against-poverty-and.
63 Shrivastava, Aditi and Gina Azito Thompson. “TANF Cash Assistance Should Reach Millions More Families to Lessen Hardship.” Center for Budget and Policy Priorities, 18 February 2022, from: https://www.cbpp.org/research/family-income-support/tanf-cash-assistance-should-reach-millions-more-families-to-lessen.
64 USDA Food and Nutrition Service. Reaching Those in Need: Estimates of State Supplemental Nutrition Assistance Program Participation Rates in 2018 (May 2021), U.S. Department of Agriculture, from: https://fns-prod.azureedge.us/sites/default/files/resource-files/Reaching2018-Summary.pdf.
65 Catholic Charities USA Advocacy & Social Policy Initiatives. “Catholic Charities USA asks Office of Management and Budget to keep in mind low-income communities when assessing Official Poverty Measure.” Catholic Charities USA, 20 June 2019, from: https://www.catholiccharitiesusa.org/advocacy_update/catholic-charitiesusa-asks-office-of-management-and-budget-to-keep-in-mind-low-income-communities-when-assessing-official-poverty-measure/.
66 The Institute. COVID-19: The Impact on K-12 Learning and Post-Secondary Workforce Development (May 2022), The Institute of Public Policy & Economic Development, from: https://www.institutepa.org/education-and-workforce-development/.
67 Ibid.
68 The Leadership Conference Education Fund. July 2011. “Getting to Work: Transportation Policy and Access to Job Opportunities,” The Leadership Conference Education Fund, from: http://civilrightsdocs.info/pdf/docs/transportation/getting-to-work-july20.pdf.
69 Pope Benedict XVI. Caritas in Veritate (2009), United States Conference of Catholic Bishops Department of Justice, Peace, and Human Development, from: http:// www.usccb.org/about/domestic-social-development/resources/upload/poverty-common-good-CST.pdf.
70 U.S. Conference of Catholic Bishops. Economic Justice for All: Pastoral Letter on Catholic Social Teaching and the U.S. Economy (1986), U.S. Conference of Catholic Bishops, from: http://www.usccb.org/upload/economic_justice_for_all.pdf.
71 Catholic Charities USA Advocacy & Social Policy Initiatives. Letter on fiscal year 2023 labor, health and human services, and education (Labor-HHS) appropriations bill.” Catholic Charities USA, 13 May 2022, from: https://www.catholiccharitiesusa.org/advocacy_update/letter-on-fiscal-year-2023-labor-health-and-humanservices-and-education-labor-hhs-appropriations-bill/.
72 Rev. Peter-Hans Kolvenbach, S.J., Superior General, Society of Jesus. “The Service of Faith and the Promotion of Justice.” (2000), from: http://onlineministries. creighton.edu/CollaborativeMinistry/Kolvenbach/Kolvenbach-SantaClara.pdf.
73 Arturo Sosa, S.J., Superior General, Society of Jesus, “Universal Apostolic Preferences of the Society of Jesus, 2019-2029.” Updated 2022, from: https://jesuits. global/en/documents/send/8-uap-docs/63-universal-apostolic-preferences.
74 Catholic Charities of St. Paul and Minneapolis. “Major Themes from Catholic Social Teaching.” (2015), Catholic Charities Twin Cities, from: https://www.cctwincities. org/education-advocacy/catholic-social-teaching/.
75 DeSilver, Drew. “In the U.S. and around the World, Inflation Is High and Getting Higher.” Pew Research Center, 15 June 2022, from: https://www.pewresearch.org/ fact-tank/2022/06/15/in-the-u-s-and-around-the-world-inflation-is-high-and-getting-higher/.
*Photo Credit, pages 22 and 31: Friends of the Poor Scranton
The path we seek to follow with the poor is one that promotes social justice and the change of economic, political, and social structures that generate injustice; this path is a necessary dimension of the reconciliation of individuals, peoples, and their cultures with one another, with nature, and with God … Accompanying the impoverished requires us to improve our studies, our analysis, and our reflection in order to understand in depth the economic, political, and social processes that generate such great injustice; we must also contribute to the elaboration of alternative models.”
— Universal Apostolic Preferences of the Society of Jesus, 2019-2020, Letter from Fr. Arturo Sosa, S.J. Superior General
The Institute and The University of Scranton
43


Living Wage Report 2022 Update
To walk with the poor, the outcasts of the world, those whose dignity has been violated, in a mission of reconciliation and justice.”
— Universal Apostolic Preferences of the Society of Jesus, 2019-2020, Letter from Fr. Arturo Sosa, S.J. Superior General
