
TRACY LOVIG LUXURY MARKET REPORT A TLAN T A MAY 2024

TRACY LOVIG
REALTOR®, CLHMS GUILD
When looking for an expert agent in Metro Atlanta, GA, look to Tracy Lovig. As a professional go-getter, Tracy is widely recognized for her in-depth knowledge of the Metro Atlanta real estate market. Her laser focus on the area is renowned. Tracy is an ICON agent, which puts her in the top 4% of 90,000 agents for eXp Realty worldwide. She is also an Atlanta REALTORS® Lifetime Top Producer. Over Tracy’s career, she has helped 100’s of families sell and buy homes.
“My goal is to make a dfference in the lives of others, both professionally and personally. Helping others isn’t about notoriety or making money; it is truly about positively affecting people’s lives. What better way to help change someone’s life than through homeownership?”
Tracy was born in Marietta, GA, and raised in Acworth, GA. Her lifelong knowledge of the area is unsurpassed.
Tracy’s direct, engaged, and authentic personality shines through in her work as a REALTOR®. When you need intelligent, practical, and sensible advice about buying or selling your home from one of Atlanta’s top REALTORS®, Tracy is there for you.
AREAS SPECIALIZED
Acworth | Canton | Holly Springs |Milton | Alpharetta | Roswell | John’s Creek | Woodstock | Ball Ground
AFFILIATIONS AND HONORS
Tracy’s success and dedication to assisting her buyers and sellers has earned her the following distinctions:
• Guild Certified Luxury Home Marketing Specialist
• eXp Luxury Charter Member
• eXp Realty ICON Agent
• Atlanta Board of REALTORS® Lifetime Top Producer

CERTIFICATION AND EDUCATION
Certified Luxury Home Marketing Specialist
• Certified Pricing Strategy Advisor
• Certified eXp Express Offers Agent eXp Relocation Certification
• eXp REO Certification
• Red Book Contract Specialist Condominium Sales Specialist
• REO Specialist Designation
• Certified BPO Specialist
• Accredited Short Sale Designation
• Luxury Distress Property Designation
• Res.net REO Certified Agent
• Bachelor of Science in Business Management, Kennesaw State University
Direct: 678.687.4024 Office: 888.959.9461 x633 tracy.lovig@exprealty.com www.tracyloving.com
TABLE OF CONTENTS
PAGE 4 LUXURY REPORT EXPLAINED
PAGE 5 WELCOME MESSAGE
PAGE 6-9 NORTH AMERICAN LUXURY MARKET REVIEW
PAGE 10 13-MONTH MARKET TRENDS
PAGE 11 SINGLE-FAMILY HOMES MONTHLY OVERVIEW
PAGE 12 ATTACHED HOMES MONTHLY OVERVIEW
PAGE 13-16 MONTHLY STATISTICS BY CITY
PAGE 17 LOCAL LUXURY MARKET REVIEW
PAGE 18-19 SINGLE-FAMILY HOMES - Monthly Statistics
PAGE 20-21 ATTACHED HOMES - Monthly Statistics
PAGE 22 THANK YOU

– LUXURY REPORT EXPLAINED –
The Institute for Luxury Home Marketing has analyzed a number of metrics — including sales prices, sales volumes, number of sales, sales-price-to-list-price ratios, days on market and price-per-square-foot – to provide you a comprehensive North American Luxury Market report.
Additionally, we have further examined all of the individual luxury markets to provide both an overview and an in-depth analysis - including, where data is sufficient, a breakdown by luxury single-family homes and luxury attached homes.
It is our intention to include additional luxury markets on a continual basis. If your market is not featured, please contact us so we can implement the necessary qualification process. More in-depth reports on the luxury communities in your market are available as well.
Looking through this report, you will notice three distinct market statuses, Buyer's Market, Seller's Market, and Balanced Market. A Buyer's Market indicates that buyers have greater control over the price point. This market type is demonstrated by a substantial number of homes on the market and few sales, suggesting demand for residential properties is slow for that market and/or price point.
By contrast, a Seller's Market gives sellers greater control over the price point. Typically, this means there are few homes on the market and a generous demand, causing competition between buyers who ultimately drive sales prices higher.
A Balanced Market indicates that neither the buyers nor the sellers control the price point at which that property will sell and that there is neither a glut nor a lack of inventory. Typically, this type of market sees a stabilization of both the list and sold price, the length of time the property is on the market as well as the expectancy amongst homeowners in their respective communities – so long as their home is priced in accordance with the current market value.
REPORT GLOSSARY
DAYS ON MARKET: Measures the number of days a home is available on the market before a purchase offer is accepted.
LUXURY BENCHMARK PRICE: The price point that marks the transition from traditional homes to luxury homes.
NEW LISTINGS: The number of homes that entered the market during the current month.
PRICE PER SQUARE FOOT: Measures the dollar amount of the home's price for an individual square foot.
SALES RATIO: Sales Ratio defines market speed and determines whether the market currently favors buyers or sellers. A Buyer's Market has a Sales Ratio of less than 12%; a Balanced Market has a ratio of 12% up to 21%; a Seller's Market has a ratio of 21% or higher. A Sales Ratio greater than 100% indicates the number of sold listings exceeds the number of listings available at the end of the month.
SP/LP RATIO: The Sales Price/List Price Ratio compares the value of the sold price to the value of the list price.
REMAINING INVENTORY: The total number of homes available at the close of a month.
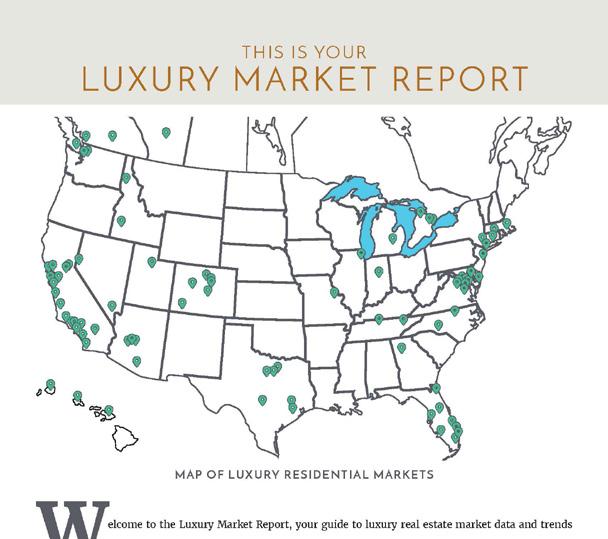
MAP OF LUXURY RESIDENTIAL MARKETS
elcome to the Luxury Market Report, your guide to luxury real estate market data and trends for North America. Produced monthly by The Institute for Luxury Home Marketing, this report provides an in-depth look at the top residential markets across the United States and Canada. Within the individual markets, you will find established luxury benchmark prices and detailed survey of luxury active and sold properties designed to showcase current market status and recent trends. The national report illustrates a compilation of the top North American markets to review overall standards and trends.
Copyright © 2023 Institute for Luxury Home Marketing | www.luxuryhomemarketing.com | 214.485.3000
The Luxury Market Report is a monthly analysis provided by The Institute for Luxury Home Marketing. Luxury benchmark prices are determined by The Institute. This active and sold data has been provided by REAL Marketing, who has compiled the data through various sources, including local MLS boards, local tax records and Realtor.com. Data is deemed reliable to the best of our knowledge, but is not guaranteed.
THIS IS YOUR LUXURY
MARKET REPORT W
NORTH AMERICAN LUXURY REVIEW
The
Evolving Path of Luxury Real Estate
In recent years, the high-end housing market has seen significant growth and transformation, with new trends and developments as well as historic levels of demand shaping the industry.
As we move into the height of the 2024 spring market, we review the way the market is trending statistically and investigate how the luxury real estate segment continues to evolve and adapt to changing consumer demands, technological advancements, and economic factors.
Consistent Demand
Despite lingering uncertainty outside the luxury real estate market, the increasing level of inventory and number of sales, combined with the steadiness of prices, has resulted in a display of consistent demand for luxury properties during the first four months of 2024.
The number of sold luxury properties has risen both month over month since the start of 2024 as well as monthly in comparison to 2023. April’s figures for single-family homes have more than doubled, increasing by 104.4% since January and by 32.1% compared to April 2023. Attached homes have risen a little less, at 86.5% since January, but by 32.4% compared to April 2023.
This sales trend has been greatly assisted by the increased level of new inventory entering the market, up by 160% since January and by 37.5% compared to April 2023 for single-family homes. Attached home inventory saw a much slower increase over the last four months of only 18.4%; however, year over year, there was an increase of 44.4%. These increases are a clear indicator that, in general, sellers have become more confident that their luxury home will sell.
While an increase in new inventory has resulted in a greater number of sales, the significant increase of sales and new inventory proves that the demand for luxury properties continues, enabling the market to remain strong.
Sold prices also indicate stability in the current market overall; the monthly median price for both single-family and attached properties has barely shifted. But more significantly, the homes being

Evolving Expectations and Preferences
sold are very close to their list price, with the return of the SP/LP ratio in the 99% percentile range for the first time in a year.
Positive Outlook and Predictions
Industry experts agree that the luxury real estate market will experience continued growth in 2024, with many predicting the trend to continue into the next few years. Despite fluctuations in the global economy, the demand for high-end properties remains strong, with the U.S. and Canada being prime markets for luxury real estate investment.
Factors contributing to the positive outlook include:
• An increase in wealthy individuals and families seeking upscale properties.
• Foreign investors looking for safe and stable investments.
• A rise in international buyers attracted to the North American lifestyle and world-renowned prestigious neighborhoods.
• Technological advancements driving innovation and enhancing the luxury home experience.
• The resilience of the luxury market during times of economic uncertainty.
The luxury property market encompasses a variety of high-end residential options, including luxury homes, penthouses, condominiums, and expansive estates. This segment offers luxurious amenities, stunning views, and exceptional craftsmanship, catering to buyers in search of elegance and refinement.
However, one of the primary reasons behind the sustained strength of the luxury market is the continuously evolving expectations and preferences of affluent consumers. Over the past few years, their changing decisions have had significant impacts on the luxury real estate landscape, and it is these influences that are reshaping the market once again.
The emerging trends in the market suggest a shift towards creating spaces that offer more than just luxury; they are about curating experiences that align with the profound values and lifestyles of discerning clientele.
It is predicted that the luxury homes of the future will integrate sustainability, cultural richness,
personalization, and social responsibility, transcending conventional concepts. Essentially, sellers of high-end real estate market in 2024 and beyond, should start to provide unique, immersive experiences that deeply resonate with individuals seeking more than just a residence but a reflection of their ideals and aspirations.
Exclusive and Tailored
A major trend in luxury real estate is the concept of a curated lifestyle. The growing market for personal luxury goods is not only influencing fashion but also reshaping the luxury real estate sector.
Similar to the bespoke services offered by high-end fashion houses, future luxury homes may offer even more extensive customization options, allowing buyers to personalize all aspects of their property. This trend acknowledges the desire for a more tailored living experience, where homes reflect individual tastes and needs. Additionally, these homes are expected to be designed with adaptability in mind, capable of evolving to accommodate various life stages or changing needs, blending luxury with practicality.
Inspiring and Reflective Architecture
The increasing interconnectedness of our world is influencing luxury real estate, leading to the emergence of a ‘cultural fusion’ style. This trend involves blending architectural and interior design elements from various cultures, creating homes that are not only luxurious but also culturally rich. Ultra-luxury homes will appeal to a globally minded demographic that values and appreciates cultural diversity and richness.
The luxury real estate market is also increasingly mirroring trends in luxury hospitality, emphasizing culturally enriched experiences. This approach blends local heritage with global design influences, resulting in unique, destination-specific luxury experiences now embraced in residential properties.
Whether located near established global landmarks, a remote destination, or in a new development by a celebrated architect, the affluent are looking for bespoke design elements and innovative features.
It seems that since remote work is here to stay, buyers have been paying even more attention to the architecture and layout of a home.
Blending Luxury and Sustainability
The shift towards intentional and sustainable architecture is also reflected in interior design trends. Energy-efficient buildings, sustainable materials, and green living are prioritized by homebuyers.

Future kitchens are envisioned as culinary masterpieces designed for gourmet enthusiasts, featuring professional-grade amenities and immersive dining experiences. In these luxury residences, the kitchen evolves into the heart of the household, blending the art of cooking with the warmth of home, creating an indulgent yet welcoming environment.
Currently, luxury real estate blends sustainability with luxury, integrating natural elements, advanced technology, and eco-friendly amenities. In the future, homes will also be designed to include private natural reserves and innovative, eco-friendly amenities like private natural reserves, eco-friendly water transportation systems, and services with zero-carbon footprints.
Privacy and Security
Privacy and security are increasingly important for luxury buyers, leading to a trend towards creating exclusive enclaves offering seclusion and safety. This exclusivity will also ensure tranquility and isolation which are highly valued by those seeking refuge from the public eye.
Luxury developments incorporate amenities like private clubs and wellness centers, maximizing privacy and minimizing the need for residents to venture into public spaces. Properties in remote or exclusive locations are also in high demand because they can offer a perfect blend of tranquility and spectacular views.
As the luxury real estate market continues to thrive and adapt to changing preferences and trends, staying informed and working with a trusted professional will be key for affluent home buyers and sellers. These luxury advisors keep a pulse on the emerging trends which allows their clients to make informed decisions and seize opportunities in this dynamic and exciting market.

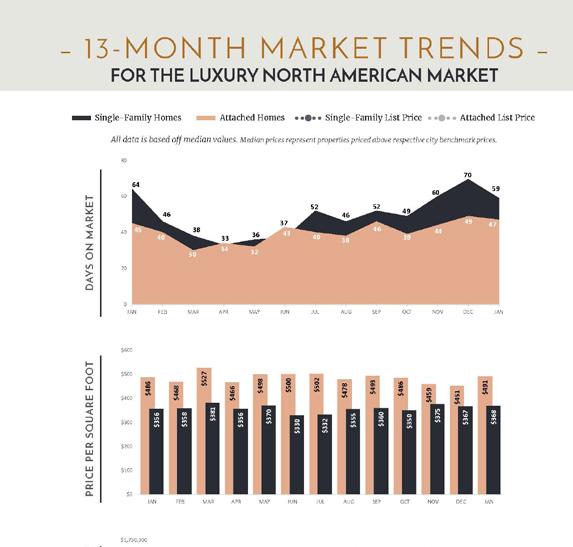
– 13 - MONTH MARKET TRENDS –
FOR THE LUXURY NORTH AMERICAN MARKET
Single-Family Homes Attached Homes Single-Family List Price Attached List Price
All data is based off median values. Median prices represent properties priced above respective city benchmark prices.
$1,900,000
$1,700,000
$1,500,000
$1,300,000
$1,100,000
$900,000
$700,000
$500,000
DAYS ON MARKET SALES
PRICE VS. LIST PRICE
0 5 10 15 20 25 30 35 40 45 APR MAY JUN JUL AUG SEP OCT NOV DEC JAN FEB MAR APR SALES RATIO 0% 5% 10% 15% 20% 25% 30% 35% 40% 45% APR MAY JUN JUL AUG SEP OCT NOV DEC JAN FEB MAR APR
APR MAY JUN JUL AUG SEP OCT NOV DEC JAN FEB MAR APR 21% 12% Seller's Balanced Buyer's
– LUXURY MONTHLY MARKET REVIEW –
A Review of Key Market Differences Year over Year
April 2023 | April 2024
SINGLE-FAMILY HOMES
New Listings Total Sold
SINGLE-FAMILY HOMES MARKET SUMMARY | APRIL 2024
• Official Market Type: Seller's Market with a 30.24% Sales Ratio.1
• Homes are selling for an average of 99.04% of list price.
• The median luxury threshold2 price is $912,500, and the median luxury home sales price is $1,251,700.
• Markets with the Highest Median Sales Price: Telluride ($6,950,000), Vail ($6,900,000), Lake Tahoe ($5,587,500), and Naples ($4,000,000).
• Markets with the Highest Sales Ratio: East Bay (144.1%), Howard County, MD (103.1%), King County, WA (88.1%), and Silicon Valley (82.9%).
1
Sales Ratio defines market speed and market type: Buyer's < 12%; Balanced >= 12 to < 21%; Seller's >= 21%. If >100%, sales from previous month exceeds current inventory. 2The luxury threshold price is set by The Institute for Luxury Home Marketing.
Median List Price $1,697,375 $1,536,225 Median Sale Price $1,300,000 $1,251,700 Median SP/LP Ratio 99.18% 99.04% Total Sales Ratio 29.18% 30.24% Median Price per Sq. Ft. $395 $404 Total Inventory 49,555 63,272 New Listings 17,761 24,459 Total Sold 14,461 19,136 Median Days on Market 17 19 Average Home Size 3,247 3,176
prices represent properties priced above respective city benchmark prices. April 2024 April 2023 April 2024 April 2023
Median
4,675
$48k
Med. Sale Price
6,698 Days on Market
2 Sales Ratio
1.06%
– LUXURY MONTHLY
A Review of Key Market Differences Year over Year
April 2023 | April 2024
2,652
ATTACHED HOMES MARKET SUMMARY | APRIL 2024
• Official Market Type: Seller's Market with a 24.38% Sales Ratio. 1
• Attached homes are selling for an average of 99.08% of list price.
• The median luxury threshold2 price is $700,000, and the median attached luxury sale price is $858,000
• Markets with the Highest Median Sales Price: Manhattan ($4,012,500), Vail ($3,525,000), Naples ($2,480,000), and San Francisco ($2,371,500).
• Markets with the Highest Sales Ratio: Howard County, MD (217.6%), Fairfax County, VA (188.7%), Arlington & Alexandria (145.8%), and Anne Arundel County (124.1%).
Median List Price $968,900 $995,000 Median Sale Price $850,000 $858,000 Median SP/LP Ratio 99.17% 99.08% Total Sales Ratio 24.84% 24.38% Median Price per Sq. Ft. $478 $508 Total Inventory 18,113 24,395 New Listings 5,998 8,650 Total Sold 4,500 5,947 Median Days on Market 18 21 Average Home Size 1,935 1,863
MARKET REVIEW –Median prices represent properties priced above respective city benchmark prices.
April 2024 April 2023 April 2024 April 2023
ATTACHED HOMES New Listings
Total Sold
Med. Sale Price $8k Days on Market 3 Sales Ratio 0.46% 1Sales Ratio defines market speed and market type: Buyer's < 12%; Balanced >= 12 to < 21%; Seller's >= 21%. If >100%, sales from previous month exceeds current inventory. 2The luxury threshold price is set by The Institute for Luxury Home Marketing.
1,447
– LUXURY MONTHLY MARKET REVIEW –
Median prices represent properties priced above respective city benchmark prices. Prices shown for Canadian cites are shown in Canadian Dollars. SINGLE FAMILY HOMES ATTACHED HOMES State Market Name List Price Sold Price DOM Ratio Market List Price Sold Price DOM Ratio Market AB Calgary - - - - - - - - -AZ Chandler and Gilbert $1,076,000 $1,020,000 30 45.6% Seller's - - - -AZ Flagstaff $1,500,000 $1,282,500 87 16.4% Balanced - - - -AZ Fountain Hills $2,648,500 $2,125,000 28 15.8% Balanced $665,000 $637,250 28 32.0% Seller's AZ Mesa $869,900 $885,000 38 30.6% Seller's - - - -AZ Paradise Valley $6,425,500 $3,962,500 93 17.0% Balanced - - - -AZ Phoenix $899,107 $845,000 46 39.3% Seller's - - - -AZ Scottsdale $2,295,000 $1,800,000 48 25.7% Seller's $898,500 $810,000 49 25.7% Seller's AZ Tucson $724,990 $660,000 19 34.9% Seller's - - - -BC Okanagan Valley $1,765,000 $1,470,000 36 4.6% Buyer's - - - -BC Vancouver $4,188,000 $3,362,500 10 8.7% Buyer's $1,898,000 $1,739,000 11 10.4% Buyer's BC Victoria - - - - - - - - -BC Whistler $5,343,500 - - 0.0% Buyer's $2,569,000 $1,990,000 31 9.8% Buyer's CA Central Coast $2,945,000 $2,500,000 12 24.6% Seller's $1,262,500 $1,112,500 9 55.6% Seller's CA East Bay $2,389,000 $2,000,000 8 144.1% Seller's $1,148,000 $1,094,000 8 109.6% Seller's CA Greater Palm Springs $1,975,000 $1,725,000 44 25.1% Seller's - - - -CA Lake Tahoe $2,712,000 $1,695,000 41 19.1% Balanced $1,512,000 $1,822,500 109 13.6% Balanced CA Los Angeles Beach Cities $5,972,500 $3,370,000 21 16.3% Balanced $1,950,000 $1,700,000 24 37.9% Seller's CA Los Angeles City $4,837,500 $3,437,500 21 16.5% Balanced $1,725,000 $1,507,000 26 22.9% Seller's CA Los Angeles The Valley $2,795,000 $2,100,000 34 27.9% Seller's $798,000 $805,000 31 64.0% Seller's CA Marin County $3,500,000 $2,947,500 10 34.7% Seller's $1,197,000 $1,220,000 24 58.3% Seller's CA Napa County $3,400,000 $2,365,000 40 12.6% Balanced - - - -CA Orange County $3,420,000 $2,165,000 16 55.6% Seller's $1,392,500 $1,106,750 17 87.9% Seller's CA Placer County $1,250,000 $1,059,990 12 41.3% Seller's - - - -CA Sacramento $950,994 $905,500 10 47.2% Seller's - - - -CA San Diego $2,475,000 $1,950,000 9 46.9% Seller's $1,299,500 $1,010,000 8 51.7% Seller's CA San Francisco $4,650,000 $3,326,500 12 62.7% Seller's $2,995,000 $2,371,500 19 19.1% Balanced CA San Luis Obispo County $1,795,000 $1,467,500 20 28.8% Seller's - - - -CA Silicon Valley $4,592,500 $3,276,000 8 82.9% Seller's $1,724,000 $1,630,000 7 69.6% Seller's CA Sonoma County $2,500,000 $1,765,280 24 16.4% Balanced $777,098 $730,000 24 40.9% Seller's CA Ventura County $2,485,000 $1,800,000 41 31.1% Seller's $765,000 $760,000 43 73.7% Seller's CO Boulder $2,250,000 $1,650,000 39 30.4% Seller's $979,000 $850,000 34 20.9% Balanced CO Colorado Springs $932,114 $887,250 12 34.3% Seller's $562,000 $550,000 19 29.2% Seller's CO Denver $1,600,000 $1,355,000 8 35.8% Seller's $850,000 $782,000 8 30.3% Seller's CO Douglas County $1,295,000 $1,125,500 14 30.2% Seller's $605,000 $622,000 11 59.7% Seller's CO Durango - - - - - - - - -CO Summit County $3,287,000 $2,679,500 10 17.6% Balanced $1,260,000 $1,349,000 48 14.5% Balanced CO Telluride $6,700,000 $6,950,000 229 13.6% Balanced $4,000,000 $2,295,000 109 11.6% Buyer's CO Vail $7,475,000 $6,900,000 185 14.6% Balanced $3,495,000 $3,525,000 18 30.2% Seller's
– LUXURY MONTHLY MARKET REVIEW –
Median prices represent properties priced above respective city benchmark prices. Prices shown for Canadian cites are shown in Canadian Dollars.
SINGLE FAMILY HOMES ATTACHED HOMES State Market Name List Price Sold Price DOM Ratio Market List Price Sold Price DOM Ratio Market CT Central Connecticut $699,000 $630,000 5 53.1% Seller's - - - -CT Coastal Connecticut $2,250,000 $1,827,500 17 31.3% Seller's $992,707 $850,000 14 47.1% Seller's DC Washington D.C. $4,372,500 $2,805,000 28 19.4% Balanced $1,830,000 $1,527,072 11 25.3% Seller's DE Sussex County Coastal $1,512,500 $1,249,500 9 20.5% Balanced $1,100,000 $947,500 8 72.0% Seller's FL Boca Raton/Delray Beach $2,674,000 $1,850,000 79 18.3% Balanced $1,100,000 $750,000 45 20.7% Balanced FL Brevard County $834,950 $800,000 28 27.9% Seller's $699,900 $767,000 34 13.4% Balanced FL Broward County $1,730,000 $1,412,500 47 15.4% Balanced $699,000 $614,250 52 10.6% Buyer's FL Coastal Pinellas County $2,000,000 $2,185,000 36 19.5% Balanced $1,200,000 $1,180,000 23 16.8% Balanced FL Ft. Lauderdale $5,500,000 $3,939,000 134 8.9% Buyer's $2,399,450 $2,050,000 137 5.6% Buyer's FL Jacksonville Beaches $1,299,000 $1,202,000 22 25.9% Seller's $999,999 $1,250,000 16 28.4% Seller's FL Lee County $1,400,000 $1,250,000 39 15.2% Balanced $850,000 $836,000 38 14.9% Balanced FL Marco Island $2,800,000 $2,407,500 90 17.3% Balanced $1,699,000 $1,837,500 65 18.0% Balanced FL Miami $2,043,000 $1,400,000 57 11.5% Buyer's $1,479,000 $1,300,000 73 8.4% Buyer's FL Naples $5,525,000 $4,000,000 40 9.0% Buyer's $2,395,000 $2,480,000 31 29.2% Seller's FL Orlando $1,299,900 $1,160,000 26 21.6% Seller's $560,000 $559,500 22 15.8% Balanced FL Palm Beach Towns $4,495,000 $2,750,000 78 17.6% Balanced $1,999,000 $1,494,000 47 14.7% Balanced FL Sarasota & Beaches $2,525,000 $1,871,500 34 13.8% Balanced $1,625,000 $1,400,000 41 19.6% Balanced FL South Pinellas County $1,499,900 $1,325,000 27 21.9% Seller's $1,000,000 $1,052,500 42 19.2% Balanced FL South Walton $2,497,000 $2,045,000 42 11.5% Buyer's $1,250,000 $1,537,500 66 11.6% Buyer's FL Tampa $750,000 $705,000 17 27.6% Seller's $899,000 $642,500 41 20.5% Balanced GA Atlanta $1,690,000 $1,197,500 5 28.9% Seller's $729,450 $672,750 19 29.5% Seller's GA Duluth $1,474,000 $1,001,000 5 42.3% Seller's - - - -HI Island of Hawaii $1,992,500 $1,999,999 61 17.5% Balanced $1,700,000 $1,820,000 7 54.1% Seller's HI Kauai $2,915,000 $1,787,000 53 14.2% Balanced $1,472,500 $1,490,000 13 26.0% Seller's HI Maui $3,748,000 $2,250,000 75 14.6% Balanced $1,989,000 $1,850,000 120 18.8% Balanced HI Oahu $2,590,000 $2,300,000 17 51.8% Seller's $995,000 $935,500 40 55.6% Seller's IA Greater Des Moines $650,000 $627,250 23 16.0% Balanced - - - -ID Ada County $824,945 $725,000 7 45.3% Seller's $623,500 $624,950 19 26.4% Seller's ID Northern Idaho $1,729,000 $1,350,000 65 10.6% Buyer's - - - -IL Chicago $1,699,500 $1,250,000 11 44.8% Seller's $1,224,999 $925,000 18 26.9% Seller's IL DuPage County $1,299,000 $913,050 7 65.3% Seller's $766,750 $630,000 4 32.1% Seller's IL Lake County $1,349,000 $899,500 7 40.8% Seller's - - - -IL Will County $676,500 $630,500 8 59.1% Seller's - - - -IN Hamilton County $825,000 $830,000 5 67.2% Seller's - - - -KS Johnson County $824,212 $821,750 8 28.4% Seller's $656,252 $621,278 9 23.1% Seller's MA Cape Cod $2,450,000 $1,625,000 37 22.4% Seller's $1,037,500 $899,999 23 17.3% Balanced MA Greater Boston $3,739,500 $2,850,000 33 22.9% Seller's $2,399,000 $2,142,500 20 16.3% Balanced MA South Shore $1,949,500 $1,480,000 22 48.6% Seller's $899,000 $818,000 31 30.3% Seller's MD Anne Arundel County $1,225,000 $949,000 6 75.2% Seller's $613,000 $577,995 6 124.1% Seller's
– LUXURY MONTHLY MARKET REVIEW –
Median prices represent properties priced above respective city benchmark prices. Prices shown for Canadian cites are shown in Canadian Dollars.
SINGLE FAMILY HOMES ATTACHED HOMES State Market Name List Price Sold Price DOM Ratio Market List Price Sold Price DOM Ratio Market MD Baltimore City $1,104,750 $820,000 3 60.0% Seller's $669,000 $575,000 9 38.5% Seller's MD Baltimore County $1,200,000 $899,950 5 37.6% Seller's $616,985 $552,000 5 95.5% Seller's MD Frederick County $925,000 $878,000 4 25.6% Seller's - - - -MD Howard County $1,189,000 $1,142,000 5 103.1% Seller's $699,990 $664,825 5 217.6% Seller's MD Montgomery County $2,011,448 $1,585,000 6 80.6% Seller's $865,000 $747,500 6 103.8% Seller's MD Talbot County $3,200,000 $1,787,500 13 25.0% Seller's - - - -MD Worcester County $912,000 $945,000 36 19.4% Balanced $650,000 $642,500 27 25.7% Seller's MI Grand Traverse $1,175,829 $922,500 43 18.6% Balanced - - - -MI Livingston County $729,900 $690,000 6 34.0% Seller's - - - -MI Monroe County $699,000 $625,500 43 31.6% Seller's - - - -MI Oakland County $849,000 $672,000 9 44.0% Seller's $649,900 $577,500 15 47.3% Seller's MI Washtenaw County $900,000 $795,000 26 40.1% Seller's $692,450 $636,773 53 48.1% Seller's MI Wayne County $699,999 $625,000 8 63.4% Seller's $739,000 $595,500 10 16.9% Balanced MN Olmsted County $859,900 $804,950 88 16.8% Balanced - - - -MN Twin Cities $1,299,999 $994,500 15 23.4% Seller's - - - -MO Kansas City $725,000 $658,000 7 32.2% Seller's - - - -MO St. Louis $749,000 $657,500 6 72.4% Seller's - - - -NC Asheville $1,095,000 $900,000 6 24.2% Seller's $679,900 $700,000 21 25.5% Seller's NC Charlotte $1,290,000 $954,000 3 57.3% Seller's $631,248 $705,500 19 41.9% Seller's NC Lake Norman $1,335,250 $975,000 16 30.6% Seller's $585,000 $739,500 5 33.3% Seller's NC Raleigh-Durham $1,287,500 $980,000 3 57.2% Seller's - - - -NH Rockingham County $1,399,900 $1,475,000 8 41.1% Seller's $893,000 $949,000 7 43.6% Seller's NJ Bergen County $2,690,000 $1,780,000 20 20.2% Balanced $1,295,000 $1,175,000 37 36.4% Seller's NJ Morris County - - - - - - - - -NJ Ocean County $974,950 $910,000 31 24.9% Seller's $924,900 $815,000 74 38.0% Seller's NM Taos $1,300,000 $1,023,210 116 7.4% Buyer's - - - -NV Lake Tahoe $3,995,000 $5,587,500 100 8.4% Buyer's $1,300,000 $1,150,000 37 36.8% Seller's NV Las Vegas $1,850,000 $1,420,000 28 23.6% Seller's - - - -NV Reno $2,537,500 $1,558,121 54 19.6% Balanced - - - -NY Dutchess & Putnam Counties $995,000 $917,000 29 11.0% Buyer's - - - -NY Manhattan - - - - - $4,650,000 $4,012,500 143 5.0% Buyer's NY Nassau County $1,913,300 $1,452,500 49 17.0% Balanced $1,525,800 $1,385,000 32 17.1% Balanced NY Rockland, Orange, & Ulster $1,250,000 $1,074,500 40 15.7% Balanced - - - -NY Staten Island $1,198,888 $975,000 95 11.3% Buyer's $637,500 $610,000 62 26.6% Seller's NY Suffolk County $1,975,000 $1,200,000 59 12.3% Balanced $775,000 $649,000 17 30.3% Seller's NY Westchester County $2,149,000 $1,455,000 14 28.8% Seller's - - - -OH Cincinnati $869,950 $775,000 2 37.2% Seller's - - - -OH Cleveland Suburbs $739,900 $592,500 26 71.4% Seller's - - - -OH Columbus $874,950 $740,000 5 44.8% Seller's $666,950 $639,950 12 38.9% Seller's
– LUXURY MONTHLY MARKET REVIEW –
Median prices represent properties priced above respective city benchmark prices. Prices shown for Canadian cites are shown in Canadian Dollars.
SINGLE FAMILY HOMES ATTACHED HOMES State Market Name List Price Sold Price DOM Ratio Market List Price Sold Price DOM Ratio Market ON GTA - Durham $1,794,000 $1,495,000 9 21.6% Seller's $829,990 $840,000 10 48.5% Seller's ON GTA - York $2,488,000 $1,930,000 12 26.1% Seller's $799,950 $790,000 18 30.7% Seller's ON Hamilton $1,850,000 $1,650,000 23 14.5% Balanced $1,012,200 $858,000 18 22.5% Seller's ON Mississauga $2,999,000 $2,562,500 14 18.3% Balanced $997,000 $911,000 15 36.9% Seller's ON Oakville $2,998,000 $2,297,500 13 36.5% Seller's $1,199,500 $1,293,500 16 26.3% Seller's ON Toronto $3,880,000 $3,160,425 8 24.2% Seller's $1,249,900 $1,115,000 14 20.4% Balanced ON Waterloo Region $1,450,000 $1,251,700 9 28.0% Seller's $775,000 $752,500 13 20.7% Balanced OR Portland $1,375,000 $1,175,000 13 29.6% Seller's $665,000 $653,250 26 14.5% Balanced SC Charleston $1,850,000 $1,575,000 14 34.4% Seller's $1,175,000 $965,000 22 35.3% Seller's SC Hilton Head $1,950,000 $1,490,000 30 25.1% Seller's $999,000 $897,500 8 34.0% Seller's TN Greater Chattanooga $950,000 $865,000 9 20.3% Balanced - - - -TN Knoxville $949,900 $928,098 12 35.1% Seller's - - - -TN Nashville $1,782,000 $1,400,000 7 28.6% Seller's $750,000 $675,000 11 15.7% Balanced TX Austin $1,299,000 $1,065,000 21 22.5% Seller's $850,000 $835,000 39 12.9% Balanced TX Collin County $750,000 $706,000 13 35.0% Seller's - - - -TX Dallas $1,354,500 $1,245,000 9 37.5% Seller's $694,900 $707,250 25 22.4% Seller's TX Denton County $827,588 $750,000 15 32.0% Seller's - - - -TX El Paso $645,450 $583,244 12 8.2% Buyer's - - - -TX Fort Worth $895,000 $821,000 11 36.1% Seller's - - - -TX Greater Tyler $681,950 $607,950 61 11.2% Buyer's - - - -TX Houston $988,000 $900,000 31 32.5% Seller's $600,000 $630,000 27 34.1% Seller's TX Lubbock $699,900 $583,250 84 16.8% Balanced - - - -TX San Angelo $630,000 $579,900 160 6.5% Buyer's - - - -TX San Antonio $820,000 $775,523 48 22.4% Seller's $680,000 $792,500 26 7.1% Buyer's TX The Woodlands & Spring $895,000 $751,750 31 53.6% Seller's - - - -UT Park City $4,500,000 $3,625,000 80 22.1% Seller's $2,087,500 $2,026,750 37 42.2% Seller's UT Salt Lake City $1,249,000 $1,100,000 27 33.3% Seller's $629,900 $599,000 42 39.5% Seller's UT Washington County $1,549,950 $1,297,500 47 23.1% Seller's - - - -VA Arlington & Alexandria $2,399,900 $1,810,000 7 45.6% Seller's $1,148,900 $1,000,000 5 145.8% Seller's VA Fairfax County $2,350,000 $1,500,000 6 65.7% Seller's $834,990 $705,000 5 188.7% Seller's VA McLean & Vienna $3,100,000 $2,027,500 6 44.2% Seller's $1,050,000 $1,032,450 5 54.5% Seller's VA Richmond $824,999 $810,000 7 52.8% Seller's $582,500 $573,765 11 42.2% Seller's VA Smith Mountain Lake $1,522,500 $1,130,000 11 33.3% Seller's - - - -WA King County $2,200,000 $1,772,500 5 88.1% Seller's $1,157,998 $1,127,975 10 49.6% Seller's WA Seattle $2,283,250 $1,700,000 6 77.3% Seller's $1,449,000 $1,285,000 22 30.3% Seller's WA Spokane $1,149,900 $967,500 16 14.1% Balanced - - - - -
ATLANTA GEORGIA
2024 MAY
Luxury Benchmark Price 1: $850,000
LUXURY INVENTORY VS. SALES | APRIL 2024
$7,500,000+
$6,700,000 - $7,499,999
$5,900,000 - $6,699,999
$5,100,000 - $5,899,999
$4,300,000 - $5,099,999
$3,700,000 - $4,299,999
$3,100,000 - $3,699,999
$2,500,000
$1,400,000 - $1,599,999
$1,200,000 - $1,399,999
$1,000,000 - $1,199,999
$900,000 - $999,999
$850,000 - $899,999
Square Feet3 -RangePrice -Median SoldBeds -Median SoldBaths -Median SoldSold -TotalInventory -TotalSales Ratio -Sold/Inventory0 - 2,999 $926,000 4 3 52 126 41% 3,000 - 3,999 $1,146,500 4 4 65 166 39% 4,000 - 4,999 $1,275,000 5 5 54 150 36% 5,000 - 5,999 $1,280,000 6 5 35 112 31% 6,000 - 6,999 $1,600,000 5 6 22 76 29% 7,000+ $2,425,000 6 7 24 225 11%
SINGLE
1 The luxury threshold price is set by The Institute for Luxury Home Marketing. 2Sales Ratio defines market speed and market type: Buyer's < 12%; Balanced >= 12 to < 21%; Seller's >= 21%. If >100% MLS® data reported previous month’s sales exceeded current inventory. 21 17 7 12 26 45 61 87 78 118 63 109 93 86 70 1 1 0 0 1 5 4 13 8 36 23 37 52 47 30
ATLANTA
- FAMILY HOMES
- $3,099,999
$2,000,000 - $2,499,999 $1,600,000 - $1,999,999
Inventory
Sales
Total
Total Sales Ratio2 : 29%
Seller's Market Total Inventory: 893
Sales: 258
Luxury Benchmark Price 1: $850,000
13 - MONTH LUXURY MARKET TREND 4
MEDIAN DATA REVIEW | APRIL
VARIANCE: 31 % 682 893 Apr. 2023 Apr. 2024 TOTAL INVENTORY
VARIANCE: 4 % $311 $322 SALE PRICE PER SQFT.
58 % 163 258 TOTAL SOLDS VARIANCE: 1 % $1.19m $1.20m SALES PRICE
VARIANCE: 0 % 99.66% 100.00% SALE TO LIST PRICE RATIO
VARIANCE: - 29 % 7 5 DAYS ON MARKET
ATLANTA MARKET SUMMARY | APRIL 2024
• The single-family luxury market is a Seller's Market with a 29% Sales Ratio.
• Homes sold for a median of 100.00% of list price in April 2024.
• The most active price band is $1,000,000-$1,199,999, where the sales ratio is 56%
• The median luxury sales price for single-family homes is $1,197,500.
• The median days on market for April 2024 was 5 days, down from 7 in April 2023.
3Square foot table does not account for listings and solds where square foot data is not disclosed. 4Data reported includes Active and Sold properties and does not include Pending properties.
Solds Median Sales Price Inventory 682 666 689 713 703 785 794 781 636 660 757 781 893 163 266 295 195 231 166 189 147 162 109 127 224 258 $1,185,000 $1,225,000 $1,210,000 $1,150,000 $1,185,000 $1,299,500 $1,190,000 $1,250,000 $1,250,000 $1,180,000 $1,275,000 $1,169,500 $1,197,500 Apr-23 May-23 Jun-23 Jul-23 Aug-23 Sep-23 Oct-23 Nov-23 Dec-23 Jan-24 Feb-24 Mar-24 Apr-24
ATLANTA SINGLE - FAMILY HOMES
VARIANCE:
Apr. 2023
2024 Apr. 2023 Apr. 2024 Apr. 2023 Apr. 2024 Apr. 2023 Apr. 2024 Apr. 2023 Apr. 2024
Apr.
$1,500,000
$1,000,000
LUXURY INVENTORY VS. SALES | APRIL 2024
$510,000
$500,000
Square Feet3 -RangePrice -Median SoldBeds -Median SoldBaths -Median SoldSold -TotalInventory -TotalSales Ratio -Sold/Inventory0 - 1,999 $595,000 2 3 55 231 24% 2,000 - 2,499 $665,000 3 4 65 160 41% 2,500 - 2,999 $727,400 3 4 42 111 38% 3,000 - 3,499 $743,000 4 4 10 55 18% 3,500 - 3,999 $875,000 4 4 5 26 19% 4,000+ $1,125,000 4 6 1 11 9% 15 13 27 84 42 58 88 64 46 86 15 22 24 12 14 0 3 1 16 8 16 30 32 18 26 5 11 4 9 1 $2,500,000+ $2,000,000 - $2,499,999
ATLANTA ATTACHED HOMES
- $1,999,999
- $1,499,999 $900,000 - $999,999 $800,000 - $899,999 $700,000 - $799,999 $650,000 - $699,999 $600,000 - $649,999 $550,000 - $599,999 $540,000 - $549,999 $530,000 - $539,999
- $529,999
$520,000
- $519,999
- $509,999
Inventory Sales Luxury Benchmark Price 1: $500,000 Seller's Market Total Inventory: 610 Total Sales: 180 Total Sales Ratio2 : 30% 1 The luxury threshold price is set by The Institute for Luxury Home Marketing. 2Sales Ratio defines market speed and market type: Buyer's < 12%; Balanced >= 12 to < 21%; Seller's >= 21%. If >100% MLS® data reported previous month’s sales exceeded current inventory.
13 - MONTH LUXURY MARKET TREND 4
MEDIAN DATA REVIEW | APRIL
MARKET
• The attached luxury market is a Seller's Market with a 30% Sales Ratio. • Homes sold for a median of 99.32% of list price in April 2024.
• The most active price band is $510,000-$519,999, where the sales ratio is 75%
• The median luxury sales price for attached homes is $672,750.
• The median days on market for April 2024 was 19 days, up from 9 in April 2023.
496 530 507 548 544 578 596 608 529 549 565 601 610 107 155 173 145 169 158 128 107 104 85 109 168 180 $625,000 $604,050 $625,000 $620,000 $620,000 $649,450 $654,750 $650,000 $662,500 $675,000 $670,000 $646,500 $672,750 Apr-23 May-23 Jun-23 Jul-23 Aug-23 Sep-23 Oct-23 Nov-23 Dec-23 Jan-24 Feb-24 Mar-24 Apr-24 3Square foot table does not account for listings and solds where square foot data is not disclosed. 4Data reported includes Active and Sold properties
does not include Pending properties. VARIANCE: 23 % 496 610 VARIANCE: 68 % 107 180 VARIANCE: 8 % $625k $673k SALES PRICE
VARIANCE: - 1 % 100.00% 99.32% SALE TO LIST PRICE RATIO VARIANCE: - 1 % $312 $308 SALE PRICE PER SQFT.
and
VARIANCE: 111 % 9 19 DAYS ON MARKET
ATLANTA ATTACHED HOMES
ATLANTA
SUMMARY | APRIL 2024
Apr. 2023 Apr. 2024 Apr. 2023 Apr. 2024 Apr. 2023 Apr. 2024 Apr. 2023 Apr. 2024 Apr. 2023 Apr. 2024 Apr. 2023 Apr. 2024
TOTAL INVENTORY TOTAL
SOLDS Luxury Benchmark Price 1: $500,000
Solds Median Sales Price Inventory


TRACY LOVIG 678.687.4024 | tracy.lovig@exprealty.com | www.tracyloving.com Thank you for taking time to view this report. For more information about this report and the services I can offer you and your luxury property, please give me a call at 678.687.4024. - Tracy Lovig
