


The SIMMS Team, Coastal Properties Group / Forbes Global Properties 238 Beach Drive NE, St. Petersburg FL 33701
We sell real estate, and we’re good at it. We listen carefully and talk straight – believing that’s how we can best serve you.
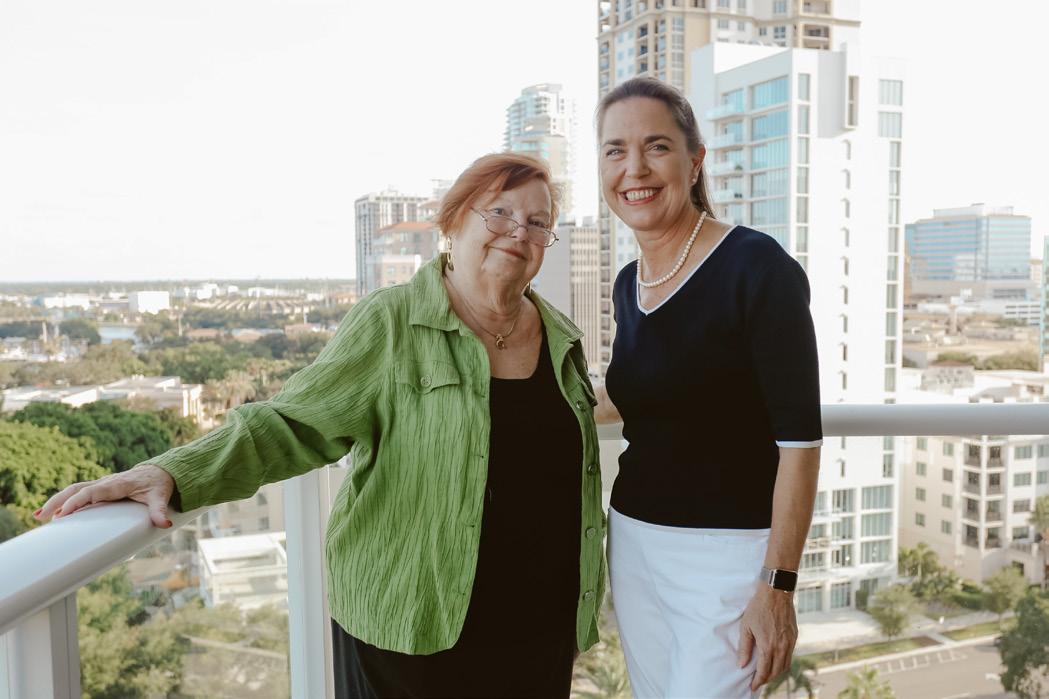
The SIMMS Team was founded by Sharon Simms, a full time REALTOR® in St. Petersburg, Florida, since 1986. She is joined by daughter Tami Simms (now Managing Partner) and supported by Strategic Execution Officer, Amy Dinovo.
Education and active participation in professional organizations are very important to us (see details below). Each team member has real estate designations as well as a college education. Sharon and Tami are often quoted by the media, invited to speak around the country, and Tami is a Trainer for the Institute for Luxury Home Marketing.
We each bring unique talents to the team, but each of us is familiar with every client and the status of their search and transactions. Sharon and Tami work directly with buyers and sellers, each offering unique skill sets and personalities to match our clients’ needs. (All sales production is reported under Sharon’s name, in case you’re looking.) Amy keeps all of us in line, managing our technology and making sure that every deadline is met and every detail is taken care of.
Where We Live Is Where We Work: We enjoy living in this beautiful waterfront community, which encompasses small towns with unique character; cities with dynamic activities, arts, entertainment and recreation; a warm climate with lots of sunshine, and a thriving business community. Our office is in the heart of vibrant downtown St. Petersburg, and we cover areas that are within a 45 minute commute of the main work centers of Pinellas County, from the Gateway / Carillon area to downtown St. Petersburg.
(One or more of the Team have earned the following real estate-specific designations and/or certifications)
• ABR: Accredited Buyer Representative
• ACRE: Accredited Consultant in Real Estate
• ASP: Accredited Staging Professional
• ASR: Accredited Seller Representative
• CIPS: Certified International Property Specialist
• CLHMS: Certified Luxury Home Marketing Specialist
• CNHS: Certified New Home Specialist
• CRB: Certified Real Estate Real Estate Brokerage Manager
• CRS: Certified Residential Specialist
• CSP: Certified New Home Sales Specialist
• Ecobroker Certified
• e-Pro Certification
• GRI: Graduate, REALTOR Institute
• LTG: Leadership Training Graduate
• PMN: Performance Management Network
• RECS: Real Estate CyberSpace Specialist
• RSPS: Resort and Second Home Property Specialist
• SRES: Seniors Real Estate Specialist
• TRC: Transnational Referral Certificate
PAGE 4-7
PAGE 8
PAGE 9
PAGE 10
PAGE 11-14
PAGE 15
PAGE 16
PAGE 17-21
PAGE 22
NORTH AMERICAN LUXURY MARKET REVIEW
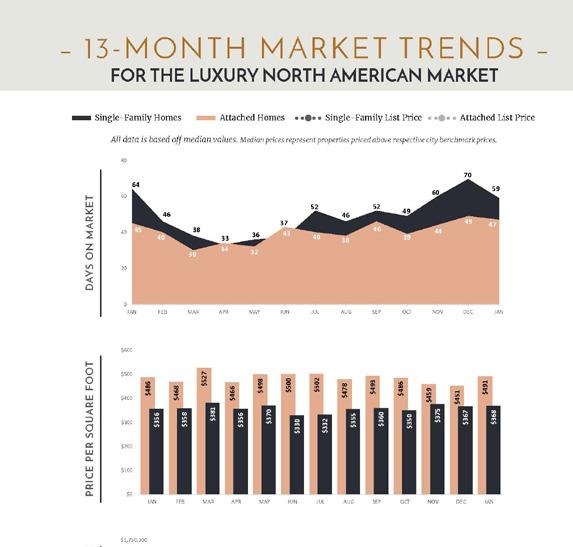
13-MONTH MARKET TRENDS
SINGLE-FAMILY HOMES MONTHLY OVERVIEW
ATTACHED HOMES MONTHLY OVERVIEW
MONTHLY STATISTICS BY CITY
LUXURY REPORT EXPLAINED
WELCOME MESSAGE
LOCAL LUXURY MARKET REVIEW
THANK YOU

As we close out the first half of 2025, the luxury real estate market in North America has presented a narrative of disciplined resilience over the past six months.
While broader economic uncertainty, especially around interest rates, has created a more cautious environment, luxury real estate has proven remarkably steady, with median sold prices holding firm, inventory levels rising, and buyer behavior becoming increasingly strategic.
Now at the midpoint of the year, the market is expected to continue reflecting a balance of resilience, recalibration, and restrained momentum as both buyers and sellers navigate shifting conditions.
The first quarter of 2025 began on an optimistic note. January saw a significant boost in activity, with sales of single-family luxury homes up 17.6% compared to the year prior and attached properties gaining 12.7%. Inventory surged as sellers re-entered the market, and new listings for single-family homes jumped by 33%. This influx of properties and buyer engagement signaled renewed confidence after a more restrained fourth quarter in 2024.
February continued to deliver high inventory levels, up another 24% year-over-year, but both buyers and sellers began to pull back slightly. The growth in new listings slowed to 17.9%, and single-family sales softened, increasing by just 4.5% year-over-year. Sellers began hesitating, waiting to see if interest rates might fall, while buyers started to factor financing costs and economic signals more carefully.
March brought a notable resurgence. Single-family home sales rebounded 7.3% over the previous year and rose nearly 40% compared to February, reflecting a wave of reengaged buyers. Attached inventory climbed by more than 28%, and new listings increased again.
The tone shifted back to cautious optimism, with buyers focused on long-term value, lifestyle alignment,
and location quality - often leaning into all-cash purchases or equity-based financing to move quickly in an uncertain lending environment.
As the second quarter unfolded, market behavior became more nuanced. In April and May, sales volumes slowed. Single-family home sales declined 2.9% year-over-year in May, while attached properties experienced a steeper 11.9% drop.
Despite these slower sales, inventory levels kept climbing. By May, total inventory for single-family homes had risen over 30% compared to the previous year, although new listings were growing more moderately. The trend was clear: sellers weren’t flooding the market with new inventory; instead, existing listings were accumulating as properties took longer to sell.
In the attached segment, inventory was up 23.5% year-over-year, while new listings grew only 4%. This widening gap suggested that many homeowners were still waiting for better financial conditions before listing their properties.
June’s numbers further clarified the market’s mid-year stance. Sales of single-family luxury homes rose 11.0% compared to June 2024, while attached home sales ticked up just 0.6%. Buyers remained active, especially for desirable single-family homes in lifestyle-driven markets, but were no longer rushing. This pointed to a healthy but deliberate pace, with affluent clients willing to wait for the right property.

Inventory continued to exceed 2024 levels by approximately 26% for single-family homes and 20% for attached properties, providing buyers with expanded choices. However, the rate of new listings entering the market had slowed. While new listings for single-family homes were still up 12.8% and attached homes 5.3% year-over-year, both figures were nearly 20% lower than the year-over-year increases recorded in April. This tapering off highlights the ongoing hesitation from sellers, many of whom are likely holding back until interest rate cuts materialize.
Prices, meanwhile, remained steady. The median sold price for single-family luxury homes appreciated by 1.6% yearover-year in June, while attached homes saw a robust 6.4% increase. These gains reflect the underlying strength of demand, particularly for well-positioned and updated homes in high-demand regions. Despite the slower pace, buyers continue to recognize long-term value and are willing to pay a premium when they find the right fit.

One notable change has been time on market. Properties in June 2025 took roughly 23% longer to sell than they did a year ago. Buyers are moving more cautiously, and with more options available, they are taking time to compare, negotiate, and align decisions with broader financial goals. This increased deliberation is not a sign of weakness - it’s a reflection of a market maturing out of the urgency that defined the post-pandemic years.
Several trends are driving today’s luxury real estate dynamics.
First, buyer behavior has become far more strategic. Many are still purchasing, but they are doing so with a sharper focus on value, timing, and lifestyle alignment. Second, inventory has grown significantly, yet new listings are not flooding in as one might expect. Sellers, especially the aspirational wealthy rather than the ultra-high-net-worth, remain cautious watching interest rates, stock market variations and broader economic influences closely before listing.
The dominance of cash continues to reshape the luxury segment. With borrowing costs still elevated, many buyers, especially those relocating or downsizing, are transacting in cash or leveraging alternative financing strategies, such as private equity or asset-backed lines. This shift has helped insulate the high end from the financing volatility affecting other segments of the housing market.
Lastly, prices have shown notable resilience. While overall demand has softened in certain regions, median sold prices continue to reflect modest appreciation, particularly in the attached home segment. However, this upward trend is largely driven by properties that meet the expectations of today’s affluent buyers: quality, uniqueness, and scarcity. Homes that don’t align with these standards are facing increased downward pressure. In other words, while the median sold price is rising, it’s not a universal lift - properties lacking in desirability or move-in readiness are sitting longer and often selling below list.
Looking ahead, the trajectory of the luxury market will likely be shaped by interest rate policy. A meaningful rate cut could prompt a wave of new listings from sellers who have been waiting on the
sidelines, while also restoriing financing confidence for buyers who have hesitated.
That said, buyer selectiveness isn’t going away. The affluent consumer in 2025 is not rushing into transactions. They are prioritizing properties that align with evolving lifestyle preferences, including wellness features, turnkey finishes, and location versatility.
Second-home markets and low-tax destinations continue to outperform urban cores, although a subtle return to city living is taking shape among Gen X and millennial luxury buyers. Others are increasingly targeting below-market homes needing renovations - a trend supported by the North American Home Builders Association, which forecasts strong remodeling growth in 2025 due to aging housing stock, high homeowner equity, and a growing preference toward upgrading over building new.
Time on market may continue to trend higher in the near term, especially if more inventory is introduced without a corresponding spike in buyer urgency. However, with pricing remaining firm and inventory growth slowing, sellers who are well-prepared and well-advised still stand to perform strongly.
The first half of 2025 has underscored that the luxury real estate market is not cooling, it’s recalibrating. Prices are holding. Inventory has grown, but not recklessly. Buyers are active but careful. Sellers are confident but cautious. Everyone is watching interest rates and monitoring the broader economic impacts, including the recent U.S. tariff implementation.
In this kind of market, preparation and strategy are everything. Whether you are considering selling a legacy property or buying in a different market, the key is using the data to help your clarity and timing. The second half of 2025 may not be a sprint, but it promises meaningful movement for those who are ready to act when the signal turns green.
Single-Family Homes
Attached Homes Single-Family List Price Attached List Price
All data is based off median values. Median prices represent properties priced above respective city benchmark prices.
$1,700,000
$1,500,000
$1,300,000
$1,100,000
$900,000
$700,000
$500,000
3.34%
• Official Market Type: Seller's Market with a 25.62% Sales Ratio.1
• Homes are selling for an average of 98.48% of list price.
• The median luxury threshold2 price is $900,000, and the median luxury home sales price is $1,340,723.
• Markets with the Highest Median Sales Price: Telluride ($7,752,500), Pitkin County ($7,100,000), Eagle County ($4,947,000), and Naples ($4,450,000).
• Markets with the Highest Sales Ratio: Cleveland Suburbs (93.4%), Howard County, MD (90.4%), Central Connecticut (85.4%), and Chicago (83.9%).
1
• Official Market Type: Balanced Market with a 17.92% Sales Ratio.1
• Attached homes are selling for an average of 98.49% of list price.
• The median luxury threshold2 price is $700,000, and the median attached luxury sale price is $930,750.
• Markets with the Highest Median Sales Price: Pitkin County ($3,050,000), Maui ($2,475,000), San Francisco ($2,360,000), and Palm Beach Towns ($2,225,000).
• Markets with the Highest Sales Ratio: Baltimore County (118.2%), Howard County, MD (116.7%), Fairfax County, VA (105.2%), and Arlington & Alexandria, VA (92.6%).
The Institute for Luxury Home Marketing has analyzed a number of metrics — including sales prices, sales volumes, number of sales, sales-price-to-list-price ratios, days on market and price-per-squarefoot – to provide you a comprehensive North American Luxury Market report.
Additionally, we have further examined all of the individual luxury markets to provide both an overview and an in-depth analysis - including, where data is sufficient, a breakdown by luxury singlefamily homes and luxury attached homes.
It is our intention to include additional luxury markets on a continual basis. If your market is not featured, please contact us so we can implement the necessary qualification process. More in-depth reports on the luxury communities in your market are available as well.
Looking through this report, you will notice three distinct market statuses, Buyer's Market, Seller's Market, and Balanced Market. A Buyer's Market indicates that buyers have greater control over the price point. This market type is demonstrated by a substantial number of homes on the market and few sales, suggesting demand for residential properties is slow for that market and/or price point.
By contrast, a Seller's Market gives sellers greater control over the price point. Typically, this means there are few homes on the market and a generous demand, causing competition between buyers who ultimately drive sales prices higher.
A Balanced Market indicates that neither the buyers nor the sellers control the price point at which that property will sell and that there is neither a glut nor a lack of inventory. Typically, this type of market sees a stabilization of both the list and sold price, the length of time the property is on the market as well as the expectancy amongst homeowners in their respective communities – so long as their home is priced in accordance with the current market value.
DAYS ON MARKET: Measures the number of days a home is available on the market before a purchase offer is accepted.
LUXURY BENCHMARK PRICE: The price point that marks the transition from traditional homes to luxury homes.
NEW LISTINGS: The number of homes that entered the market during the current month.
PRICE PER SQUARE FOOT: Measures the dollar amount of the home's price for an individual square foot.
SALES RATIO: Sales Ratio defines market speed and determines whether the market currently favors buyers or sellers. A Buyer's Market has a Sales Ratio of less than 12%; a Balanced Market has a ratio of 12% up to 21%; a Seller's Market has a ratio of 21% or higher. A Sales Ratio greater than 100% indicates the number of sold listings exceeds the number of listings available at the end of the month.
SP/LP RATIO: The Sales Price/List Price Ratio compares the value of the sold price to the value of the list price.
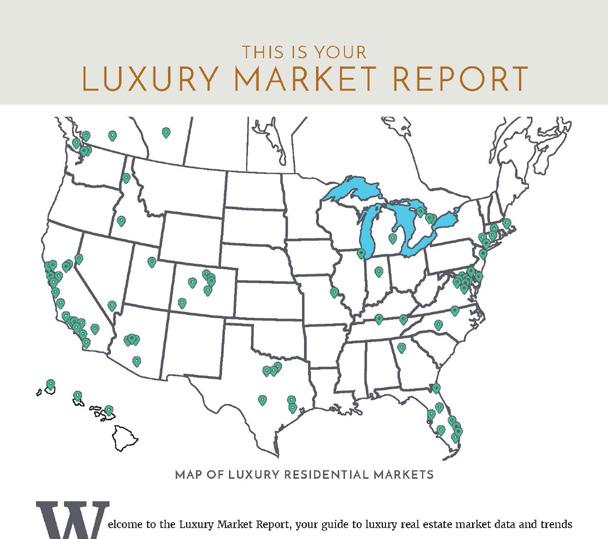
The Luxury Market Report is your guide to luxury real estate market data and trends for North America
Produced monthly by The Institute for Luxury Home Marketing, this report provides an in-depth look at the top residential markets across the United States and Canada. Within the individual markets, you will find established luxury benchmark prices and detailed survey of luxury active and sold properties designed to showcase current market status and recent trends. The national report illustrates a compilation of the top North American markets to review overall standards and trends.
Copyright © 2025 Institute for Luxury Home Marketing | www.luxuryhomemarketing.com | 214.485.3000
The Luxury Market Report is a monthly analysis provided by The Institute for Luxury Home Marketing. Luxury benchmark prices are determined by The Institute. This active and sold data has been provided by REAL Marketing, who has compiled the data through various sources, including local MLS boards, local tax records and Realtor.com. Data is deemed reliable to the best of our knowledge, but is not guaranteed.


$5,400,000
$4,000,000 - $4,699,999
$3,500,000 - $3,999,999
$3,000,000 - $3,499,999
$2,600,000 - $2,999,999
$2,200,000 - $2,599,999
$1,800,000
$1,500,000
$900,000 - $999,999
$850,000 - $899,999
$3,500,000+
$3,000,000 - $3,499,999
$2,700,000 - $2,999,999
$2,400,000
$1,000,000
$900,000
$850,000
$800,000
$750,000
Solds